

The retinoblastoma homolog RBR1 mediates localization of the repair protein RAD51 to DNA lesions in Arabidopsis
- PMID: 28320735
- PMCID: PMC5412766
- DOI: 10.15252/embj.201694571
The retinoblastoma homolog RBR1 mediates localization of the repair protein RAD51 to DNA lesions in Arabidopsis
Abstract
The retinoblastoma protein (Rb), which typically functions as a transcriptional repressor of E2F-regulated genes, represents a major control hub of the cell cycle. Here, we show that loss of the Arabidopsis Rb homolog RETINOBLASTOMA-RELATED 1 (RBR1) leads to cell death, especially upon exposure to genotoxic drugs such as the environmental toxin aluminum. While cell death can be suppressed by reduced cell-proliferation rates, rbr1 mutant cells exhibit elevated levels of DNA lesions, indicating a direct role of RBR1 in the DNA-damage response (DDR). Consistent with its role as a transcriptional repressor, we find that RBR1 directly binds to and represses key DDR genes such as RADIATION SENSITIVE 51 (RAD51), leaving it unclear why rbr1 mutants are hypersensitive to DNA damage. However, we find that RBR1 is also required for RAD51 localization to DNA lesions. We further show that RBR1 is itself targeted to DNA break sites in a CDKB1 activity-dependent manner and partially co-localizes with RAD51 at damage sites. Taken together, these results implicate RBR1 in the assembly of DNA-bound repair complexes, in addition to its canonical function as a transcriptional regulator.
Keywords: Arabidopsis; DNA‐damage response; RAD51; retinoblastoma.
© 2017 The Authors. Published under the terms of the CC BY NC ND 4.0 license.
Figures
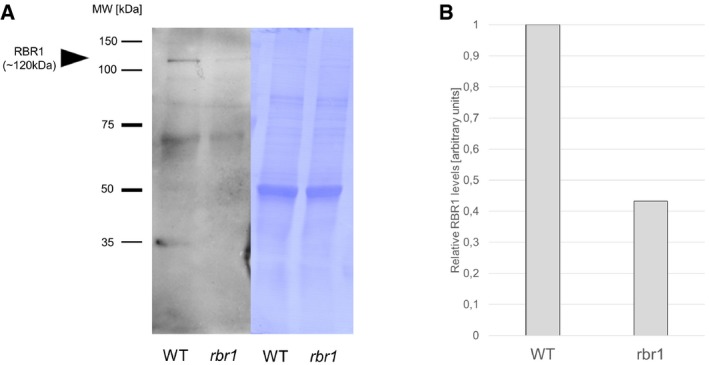
Western blot of RBR1 protein in WT and rbr1 plants at the restrictive temperature of 17°C.
Relative quantification of the signal intensity of the RBR1 bands (gray mean values measured by ImageJ) in (A).
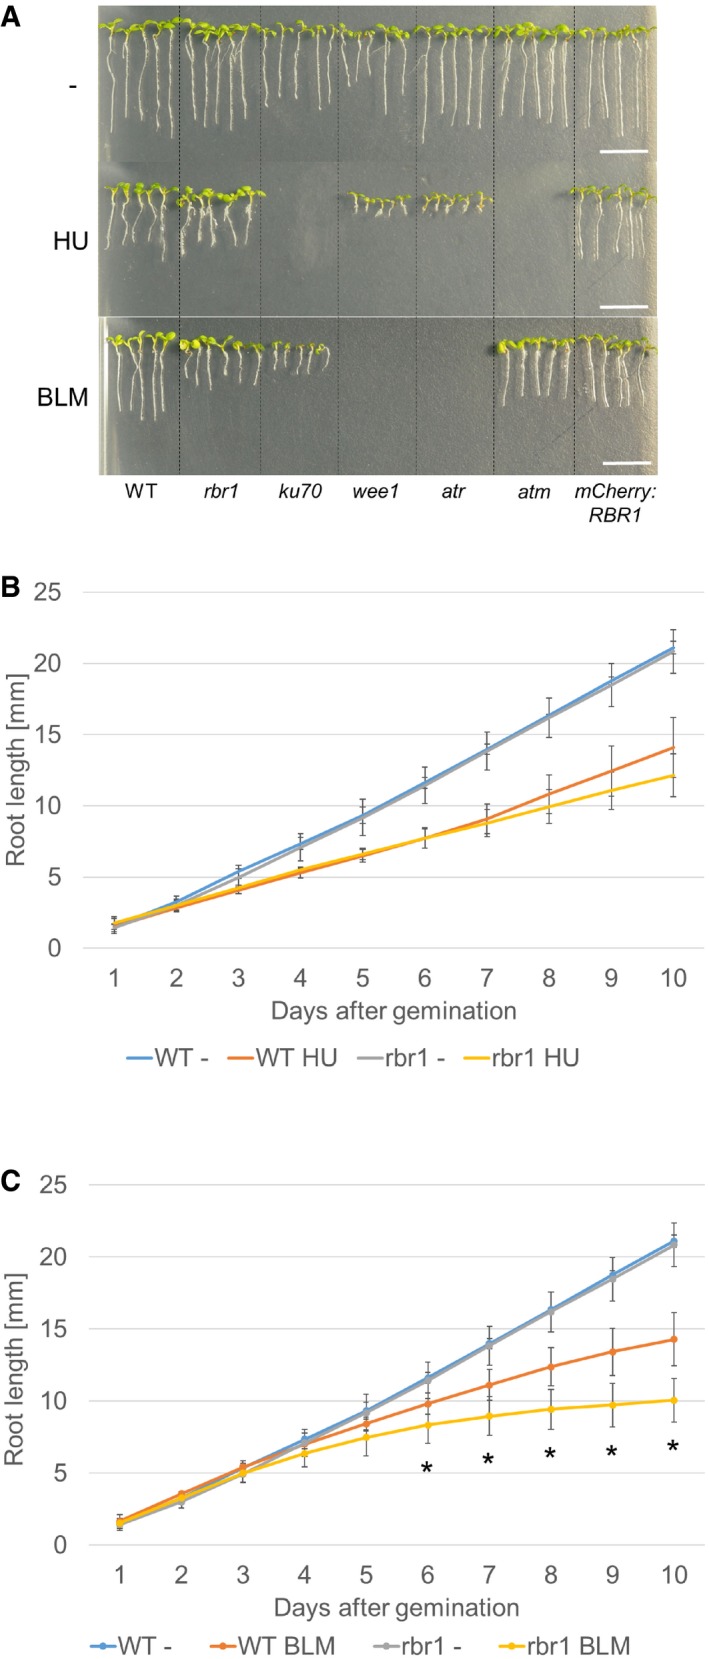
Root length of plants germinated and grown on medium containing 1 mM HU, 6 μg/ml BLM, or no supplement (‐). Broken lines were added to visually separate the different plant lines. Scale bars: 10 mm.
Comparison of root growth of the wild‐type and rbr1 mutant plants germinated and grown on medium containing 1 mM HU or no supplement (‐). Error bars signify the standard deviation in three independent experiments.
Comparison of root growth of the wild‐type and rbr1 plants germinated and grown on medium containing 6 μg/ml BLM or no supplement (‐). Error bars signify the standard deviation in three independent experiments. The asterisks indicate a P‐value lower than 0.05 in Student's t‐test.
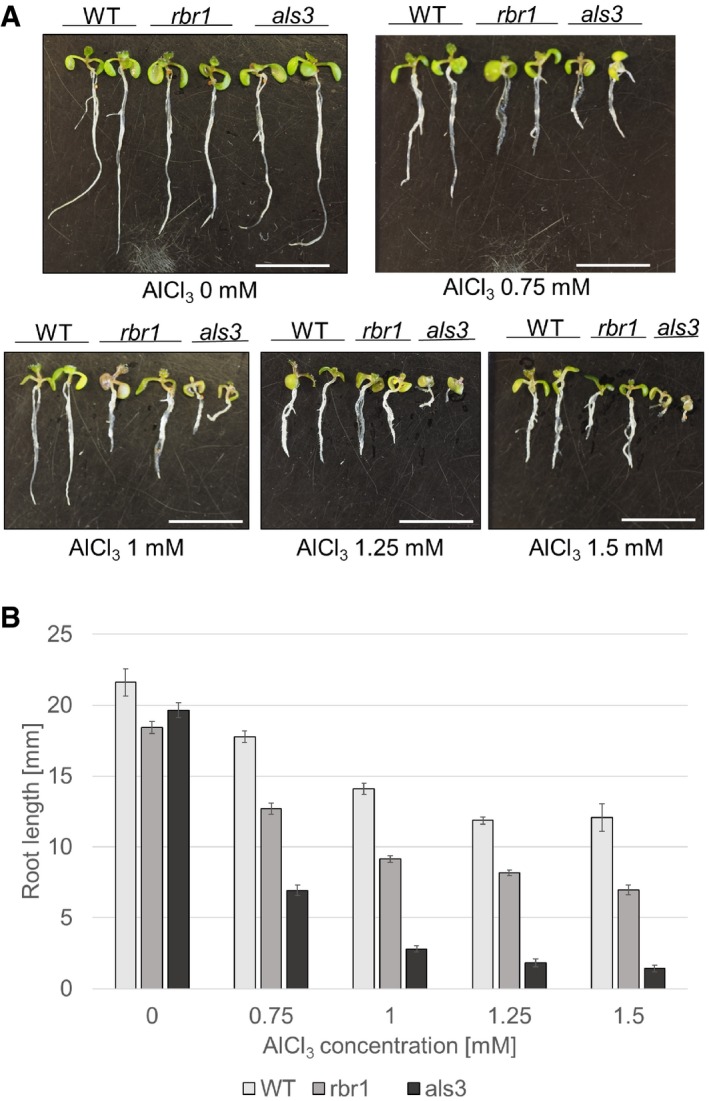
Root length of 10‐day‐old plants germinated and grown on medium containing AlCl3 in four different concentrations (0.75, 1, 1.25, and 1.5 mM) or no supplement (‐) compared to the aluminum‐sensitive mutant als3. Scale bars: 10 mm.
Comparison of root growth of 10‐day‐old wild‐type, rbr1, and als3 plants germinated and grown on medium containing 0.75, 1, 1.25, or 1.5 mM AlCl3 or no supplement (‐). Error bars signify the standard deviation in three independent experiments.
- A, B
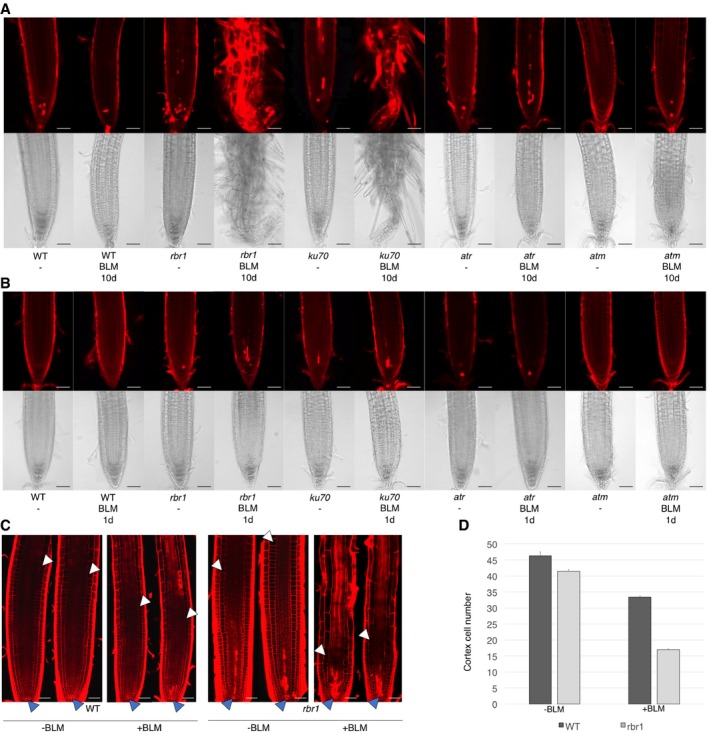
Cell death in root tips upon drug treatment. (A) Root tip phenotypes of 10‐day‐old seedlings germinated and grown on medium containing BLM (6 μg/ml) or no supplement (‐). (B) Root tip phenotypes of 8‐day‐old seedlings germinated and grown on medium containing no supplement and transferred to medium containing BLM (6 μg/ml) for 1 day. Root tip phenotypes after 2 days of incubation can be seen in Appendix Fig S1A. Upper rows show cell death visualized by propidium iodide staining; lower rows show brightfield microscopic images of root tips. Scale bars: 50 μm.
- C
Root apical meristems of roots treated with 6 μg/ml BLM or mock for 24 h. Dark arrowheads mark the stem‐cell niche and white arrowheads the position of the first elongating cortex cell. Scale bars: 50 μm.
- D
Number of cortex cells from the stem‐cell niche to the first elongating cortex cell of roots treated with 6 μg/ml BLM or mock for 24 h. Standard deviation from 15 plants and three replicates (total is 45 plants).
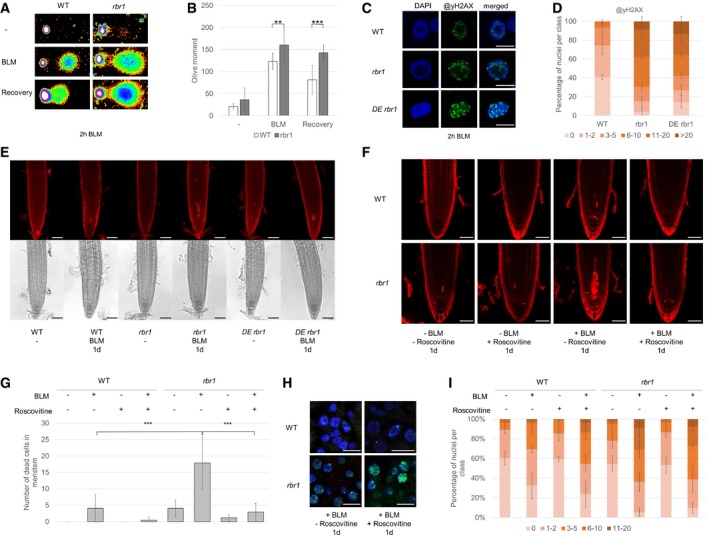
Fragmentation of nuclear DNA following BLM treatment visualized by neutral comet assays. Shown are false color depictions of representative comets generated by the TriTek CometScore Software. Twenty‐one‐day‐old plantlets were incubated for 1 h in liquid medium with or without 30 μg/ml BLM. For recovery, BLM‐stressed plantlets were rinsed and incubated for 20 min in medium without BLM.
Olive moment of BLM‐stressed plants and plants after the 20 min recovery period as calculated by the TriTek CometScore software. Error bars indicate the standard deviation in three independent experiments. Two asterisks indicate significance higher than 99% and three asterisks higher than 99.9% as calculated by Student's t‐test.
Immunofluorescence analysis of γH2AX accumulation (green) in root tip spreads following 2 h of 30 μg/ml BLM treatment in the wild‐type, rbr1, and rbr1 DE plants with DAPI staining (DNA, blue). Scale bars: 5 μm.
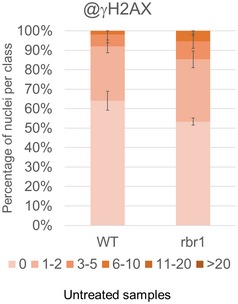
Quantification of γH2AX foci in WT, rbr1, and rbr1 DE plants after BLM treatment. One hundred nuclei per line per experiment were filed into six classes according to their counted number of γH2AX foci: nuclei containing no γH2AX foci, 1–2, 3–5, 6–10, 11–20, or more than 20 γH2AX foci, respectively. Three independent experiments were analyzed. Error bars indicate the standard deviation.
Cell death in response to BLM treatment in root tips of rbr1 DE plants compared to rbr1 and wild‐type plants. Six‐day‐old plants were transferred for 1 day to medium containing 0.6 μg/ml BLM. Scale bars: 50 μm.
PI staining of root tips of wild‐type and rbr1 plants treated for 24 h with BLM (0.6 μg/ml) and/or Roscovitine (1 μM). Scale bars: 50 μm.
Quantification of dead cells in the plane of the quiescent center of root apical meristems of wild‐type and rbr1 plants treated for 24 h with BLM (0.6 μg/ml) and/or Roscovitine (1 μM). Error bars indicate the standard deviation. Three asterisks indicate significance higher than 99.9% in three replicates as calculated by Student's t‐test.
Immunofluorescence analysis of γH2AX accumulation (green) in root tip spreads of wild‐type and rbr1 plants treated for 24 h with BLM (0.6 μg/ml) and/or Roscovitine (1 μM) with DAPI staining (DNA, blue). Scale bars: 5 μm.
Quantification of γH2AX foci in root tip spreads of wild‐type and rbr1 plants treated for 24 h with BLM (0.6 μg/ml) and/or Roscovitine (1 μM). A table of significance levels can be found in Appendix Table S1. Error bars indicate the standard deviation. The experiment was done in three replicates and 50 nuclei per replicate were analyzed.
Fifty nuclei per line per experiment were filed into six classes according to their counted number of γH2AX foci: nuclei containing no γH2AX foci, 1–2, 3–5, 6–10, 11–20, or more than 20 γH2AX foci, respectively. Three independent experiments were analyzed. Error bars indicate the standard deviation.
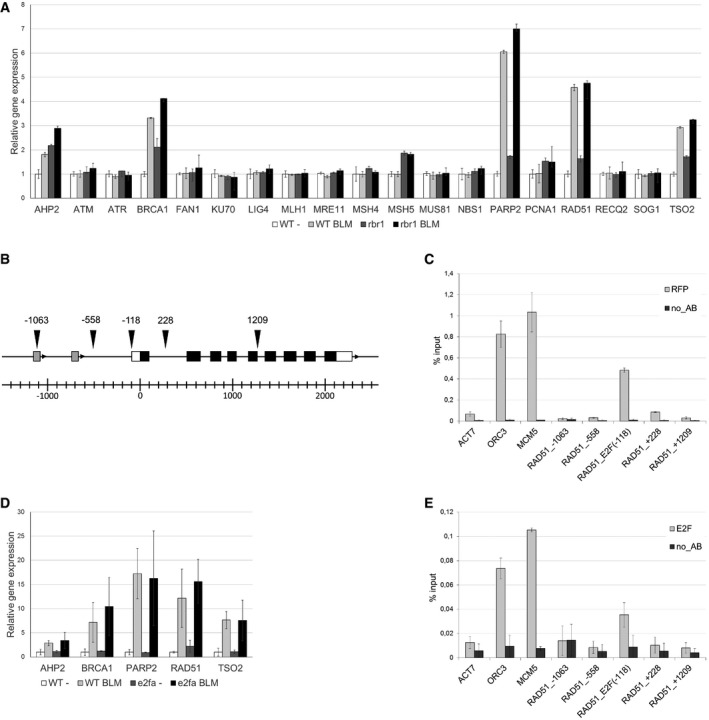
Relative expression analysis of DNA‐damage response factors in 10‐day‐old BLM‐treated (2 h, 30 μg/ml) and untreated rbr1 seedlings compared to the wild type. Error bars indicate the standard deviation in three independent biological replicates.
Genomic region of the RAD51 gene. Arrowheads indicate the positions of the amplified fragments in the ChIP assay. Numbers indicate distance to the translational start site. White boxes represent the UTRs and black boxes the coding exons of the RAD51 gene. Gray boxes indicate unrelated genes upstream of RAD51.
RBR1 ChIP. Transgenic plants expressing PRO RBR1 mCherry:RBR1 were used in a ChIP assay with a DsRed antibody. ORC3 and MCM5 were used as positive controls, ACT7 as a negative control. The labeling of the RAD51 fragments corresponds to the positions indicated in (B). Error bars indicate the standard deviation in two independent biological replicates.
Relative expression analysis of DNA‐damage response factors in 10‐day‐old BLM‐treated (2 h, 30 μg/ml) and untreated e2fa seedlings compared to the wild type. Error bars indicate the standard deviation in three biological replicates.
E2F ChIP. Transgenic plants expressing PRO RBR1 mCherry:RBR1 were used in a ChIP assay with an E2FA antibody. ORC3 and MCM5 were used as positive controls, ACT7 as a negative control. The labeling of the RAD51 fragments corresponds to the positions indicated in (B). Error bars indicate the standard deviation in two independent biological replicates.
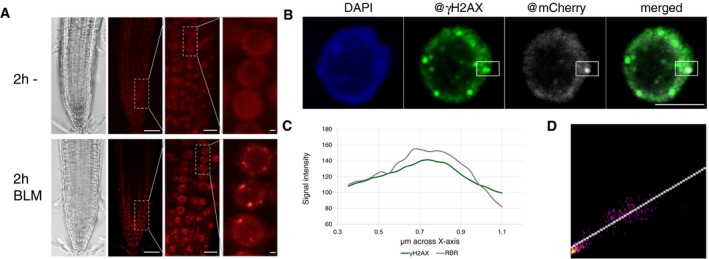
In vivo accumulation of mCherry:RBR1 in root tips of BLM‐treated (2 h, 30 μg/ml) PRO RBR1 mCherry:RBR1 rbr1‐3 plants in comparison with untreated plants. First image from left depicts brightfield microscopic image, and second to fourth depicts the mCherry fluorescence signal. The third and fourth images are magnifications of the areas framed in the second and third image, respectively. Scale bars: 50, 10, and 1 μm, respectively, from left to right.
Localization of RBR1 (gray) and γH2AX foci (green) in immunostained spreads of BLM‐treated (6 h, 6 μg/ml BLM) roots tips of PRO RBR1 mCherry:RBR1 rbr1‐3 plants, counterstained with DAPI (DNA, blue). The box marks the co‐localized foci. Scale bars: 5 μm.
Signal intensity distribution of the total amount of pixels in the box of the stained nucleus in (B).
2D correlation histogram of the co‐localized γH2AX and RBR1 foci in (B). Pearson's coefficient: 0.821, Manders coefficients M1 = 1.0 (fraction of γH2AX overlapping RBR1) and M2 = 0.995 (fraction of RBR1 overlapping γH2AX), Costes randomization (200 rounds)‐based co‐lcalization: r = 0.82.
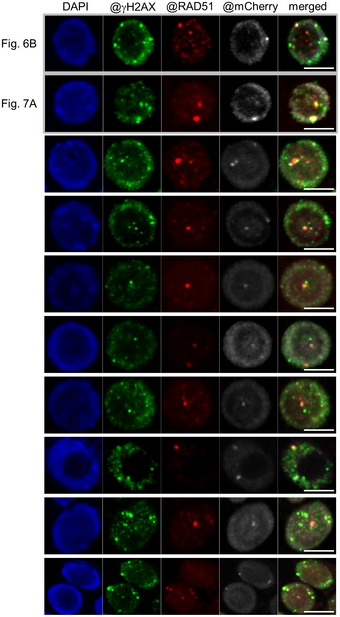
Co‐localization of γH2AX (green) and RAD51 (red) to RBR1 foci (gray) in immunostained spreads of BLM‐treated root tips of PRO RBR1 mCherry:RBR1 rbr1‐3 plants, counterstained with DAPI (DNA, blue). Note that the examples shown in Figs 6 and 7 were also added to this figure (the first two rows) for better comparison. Scale bars: 5 μm.
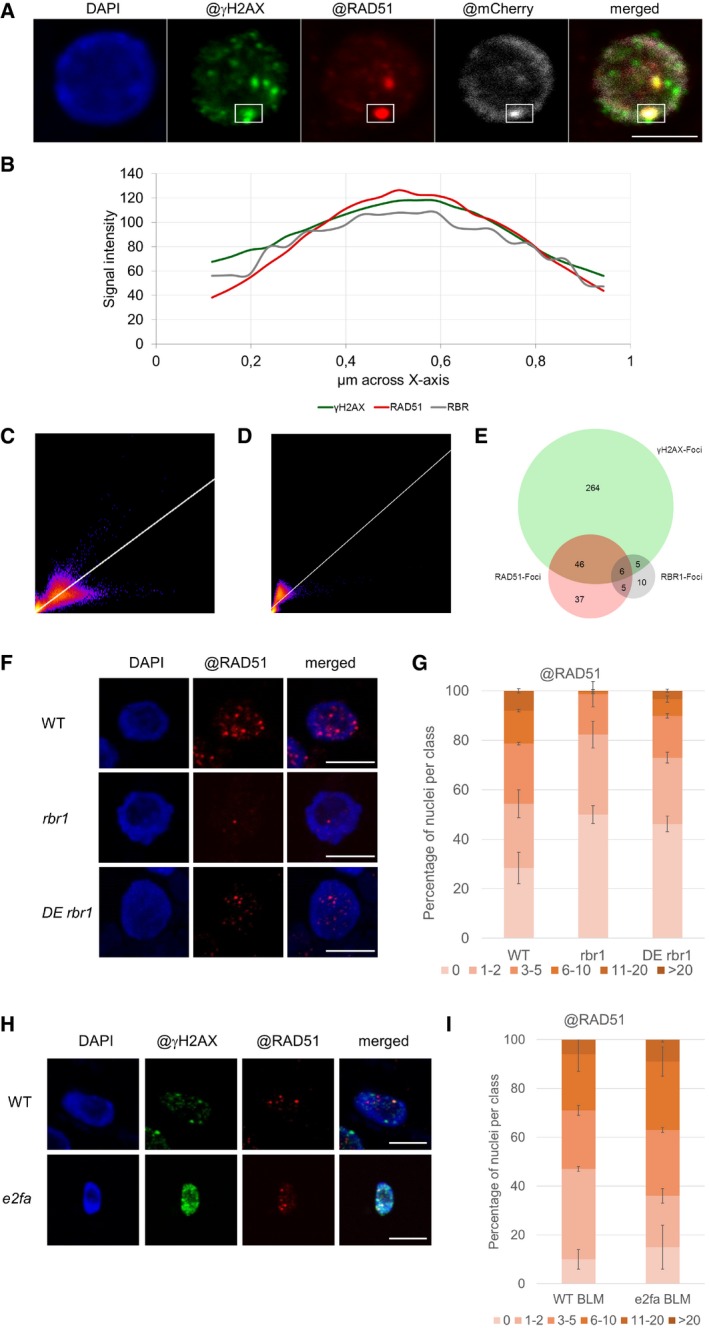
Co‐localization of γH2AX foci (green) and RAD51 (red) to RBR1 (gray) in immunostained spreads of BLM‐treated root tips (6 h, 6 μg/ml BLM) of PRO RBR1 mCherry:RBR1 rbr1‐3 plants, counterstained with DAPI (DNA, blue). See Appendix Fig S3 for more examples. Scale bars: 5 μm.
Signal intensity distribution of the total amount of pixels in the box of the stained nucleus in (A).
2D correlation histogram of the co‐localized γH2AX and RAD51 foci in (A). Pearson's coefficient: 0.899, Manders coefficients M1 = 0.923 (fraction of γH2AX overlapping RAD51) and M2 = 0.984 (fraction of RAD51 overlapping γH2AX), Costes randomization (200 rounds)‐based co‐localization: r = 0.9.
2D correlation histogram of the co‐localized RAD51 and RBR11 foci in (A). Pearson's coefficient: 0.87, Manders coefficients M1 = 0.9 (fraction of RAD51 overlapping RBR1) and M2 = 0.79 (fraction of RBR1 overlapping RAD51), Costes randomization (200 rounds)‐based co‐localization: r = 0.84.
Venn diagram showing the co‐localization of γH2AX, RAD51, and RBR1 foci in the nuclei shown in Fig EV3.
Immunofluorescence localization of RAD51 (red) in rbr1 and rbr1 DE in spreads of BLM‐treated (2 h, 30 μg/ml) root tips compared to the wild type. DNA is counterstaining with DAPI (blue fluorescence). Scale bars: 5 μm.
Quantification of RAD51 foci in the wild‐type, rbr1, and rbr1 DE plants after BLM treatment. One hundred nuclei per line per experiment were filed into six classes according to their counted number of RAD51 foci: nuclei containing no RAD51 foci, 1–2, 3–5, 6–10, 11–20, or more than 20 RAD51 foci, respectively. Three independent experiments were analyzed. Error bars indicate the standard deviation.
Immunofluorescence analysis of γH2AX (green) and RAD51 (red) accumulation in root tip spreads following BLM treatment in the wild‐type and e2fa plants. DNA counterstaining with DAPI in blue. Scale bars: 5 μm.
Quantification of RAD51 foci in WT and e2fa plants after BLM treatment. One hundred nuclei per line per experiment were filed into six classes according to their counted number of RAD51 foci: nuclei containing no RAD51 foci, 1–2, 3–5, 6–10, 11–20, or more than 20 RAD51 foci, respectively. Three independent experiments were analyzed. Error bars indicate the standard deviation.
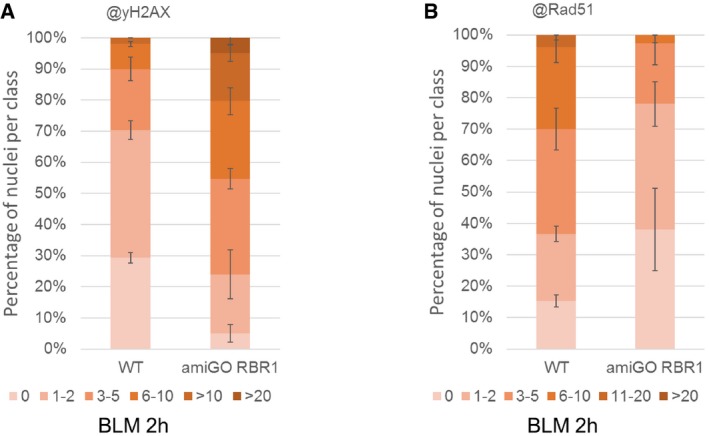
Quantification of γH2AX foci in WT and amiGO RBR1 plants after BLM treatment. Fifty nuclei per line per experiment were filed into six classes according to their counted number of γH2AX foci: nuclei containing no γH2AX foci, 1–2, 3–5, 6–10, 11–20, or more than 20 γH2AX foci, respectively. Three independent experiments were analyzed. Error bars indicate the standard deviation.
Quantification of RAD51 foci in WT and amiGO RBR1 plants after BLM treatment. Fifty nuclei per line per experiment were filed into six classes according to their counted number of RAD51 foci: nuclei containing no RAD51 foci, 1–2, 3–5, 6–10, 11–20, or more than 20 RAD51 foci, respectively. Three independent experiments were analyzed. Error bars indicate the standard deviation.
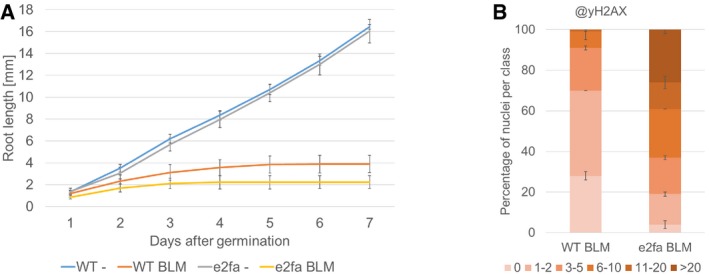
Comparison of root growth of wild‐type and e2fa plants germinated and grown on medium containing 6 μg/ml BLM or no supplement (‐). Error bars signify the standard deviation in three independent experiments.
Quantification of γH2AX foci in WT and e2fa plants after BLM treatment. One hundred nuclei per line per experiment were filed into six classes according to their counted number of γH2AX foci: nuclei containing no γH2AX foci, 1–2, 3–5, 6–10, 11–20, or more than 20 γH2AX foci, respectively. Three independent experiments were analyzed. Error bars indicate the standard deviation.
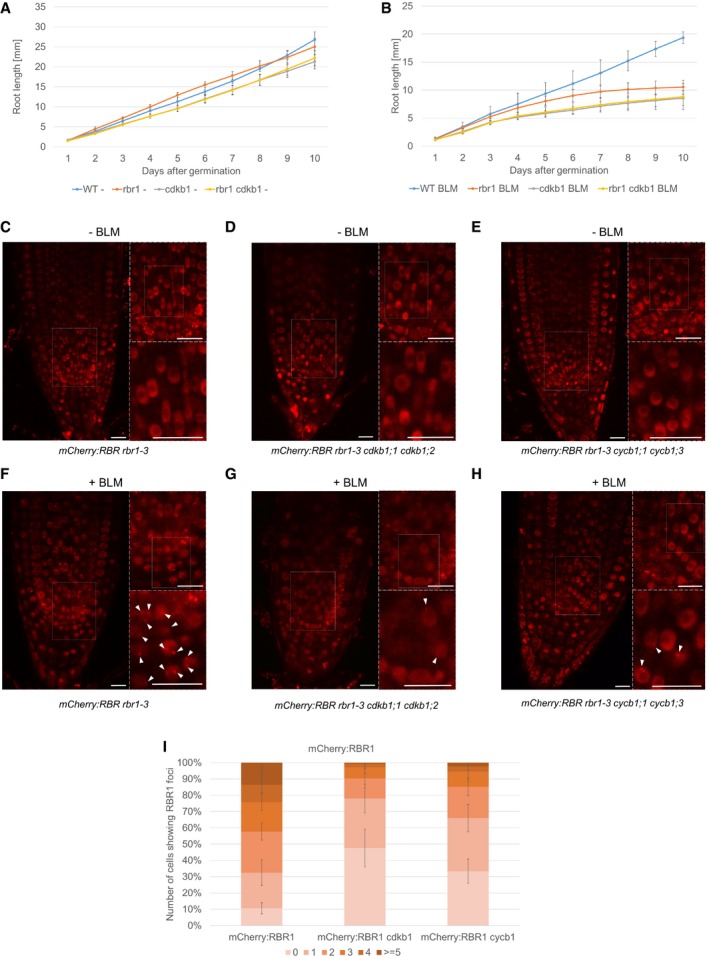
- A, B
Comparison of root growth of the wild‐type, rbr1, cdkb1, and rbr1 cdkb1 triple‐mutant plants germinated and grown on medium containing no supplement (A) or 0.6 μg/ml BLM (B). Error bars signify the standard deviation in three independent experiments.
- C–E
In vivo accumulation of mCherry:RBR1 in root tips of non‐treated PRO RBR1 mCherry:RBR1 rbr1‐3 (C), PRO RBR1 mCherry:RBR1 rbr1‐3 cdkb1;1 cdkb1;2 (D), and PRO RBR1 mCherry:RBR1 rbr1‐3 cycb1;1 cycb1;3 (E) plants. White boxes in the left part of each panel are shown in the upper right inlay, and boxed area in the upper inlay is shown in the lower inlay. Scale bars: 10 μm.
- F–H
In vivo accumulation of mCherry:RBR1 in root tips of BLM‐treated (6 h, 6 μg/ml) in PRO RBR1 mCherry:RBR1 rbr1‐3 (F), PRO RBR1 mCherry:RBR1 rbr1‐3 cdkb1;1 cdkb1;2 (G), and PRO RBR1 mCherry:RBR1 rbr1‐3 cycb1;1 cycb1;3 (H) plants. White boxes in the left part of each panel are shown in the upper right inlay, and boxed area in the upper inlay is shown in the lower inlay. Arrowheads point to RBR1 foci. Scale bars: 10 μm.
- I
Quantification of RBR1 foci in PRO RBR1 mCherry:RBR1 rbr1‐3, PRO RBR1 mCherry:RBR1 rbr1‐3 cdkb1;1 cdkb1;2, and PRO RBR1 mCherry:RBR1 rbr1‐3 cycb1;1 cycb1;3 plants after BLM treatment (6 h, 6 μg/ml). Fifty nuclei per line per experiment were filed into six classes according to their counted number of RBR51 foci: nuclei containing no foci, 1–2, 3–5, 6–10, 11–20, or more than 20 foci, respectively. Three independent experiments were analyzed. Error bars indicate the standard deviation.
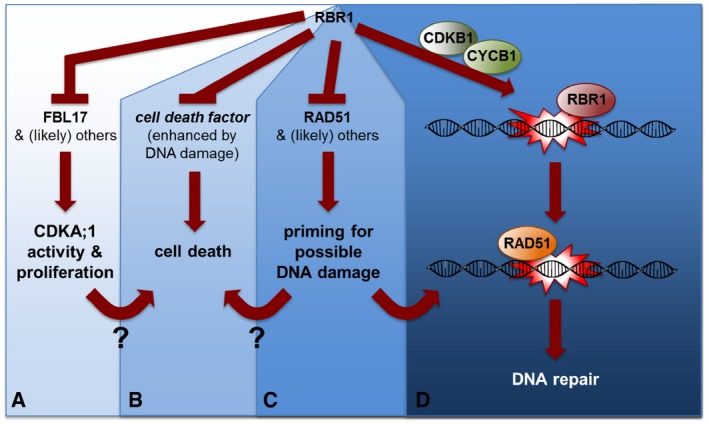
RBR1 directly represses the expression of the F‐box‐like protein FBL17 as one the central most proliferation‐control genes (Zhao et al, 2012). FBL17, as a part of an SCF complex, mediates the degradation of CDK inhibitors of the KRP class (not shown) and by that promotes CDKA;1 activity (target of KRP action) (Kim et al, 2008; Gusti et al, 2009; Noir et al, 2015).
RBR1 directly or indirectly promotes cell survival in an as yet unknown way, for example, by suppressing a cell‐death factor (direct scenario). The RBR1‐dependent cell death is proliferation/CDKA;1‐activity dependent since reduction in CDKA;1 activity restores viability but not the sensitivity toward genotoxic drugs. How proliferation/CDKA;1 activity could promote cell death is not yet understood. It is also not understood whether the execution of cell death upon RBR1 loss represents a safety belt in proliferating cells to promote their removal, preventing the propagation of mutations to daughter cells.
RBR1 directly represses the expression of the DDR gene RAD51 (shown here). Hence, inactivation of RBR1 by CDKA;1 phosphorylation presumably not only promotes the expression of cell‐proliferation genes such as FBL17 but also DDR genes. This possibly primes proliferating cells for likely occurring damage during the cell cycle. The priming may also contribute to the execution of cell death in an unknown mechanism.
RBR1 may bind to DNA lesions as revealed here by its partial co‐localization to γH2AX foci. There, RBR1 possibly acts to assemble local repair complexes. RBR1 is especially needed for the recruitment of RAD51 to damaged DNA. Notably, this function is independent of E2FA. For proper RBR1 localization in foci, the action of the CDKB1‐CYCB1 complexes, which play a major role DDR in plants, is needed.
References
-
- Abrams JM (2002) Competition and compensation: coupled to death in development and cancer. Cell 110: 403–406 - PubMed
Publication types
MeSH terms
Substances
LinkOut - more resources
Full Text Sources
Other Literature Sources
Molecular Biology Databases
Research Materials
