

Mechanism for microbial population collapse in a fluctuating resource environment
- PMID: 28320772
- PMCID: PMC5371734
- DOI: 10.15252/msb.20167058
Mechanism for microbial population collapse in a fluctuating resource environment
Abstract
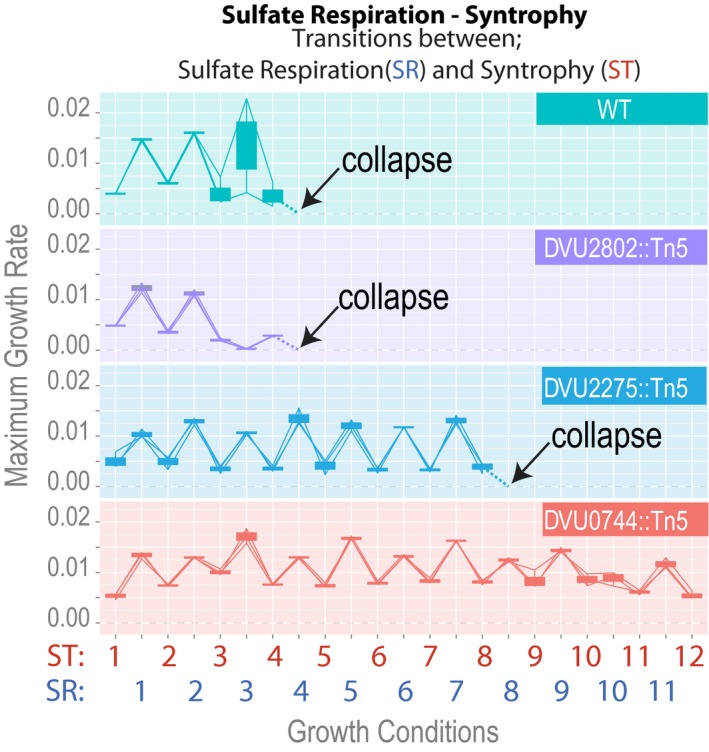
Managing trade-offs through gene regulation is believed to confer resilience to a microbial community in a fluctuating resource environment. To investigate this hypothesis, we imposed a fluctuating environment that required the sulfate-reducer Desulfovibrio vulgaris to undergo repeated ecologically relevant shifts between retaining metabolic independence (active capacity for sulfate respiration) and becoming metabolically specialized to a mutualistic association with the hydrogen-consuming Methanococcus maripaludis Strikingly, the microbial community became progressively less proficient at restoring the environmentally relevant physiological state after each perturbation and most cultures collapsed within 3-7 shifts. Counterintuitively, the collapse phenomenon was prevented by a single regulatory mutation. We have characterized the mechanism for collapse by conducting RNA-seq analysis, proteomics, microcalorimetry, and single-cell transcriptome analysis. We demonstrate that the collapse was caused by conditional gene regulation, which drove precipitous decline in intracellular abundance of essential transcripts and proteins, imposing greater energetic burden of regulation to restore function in a fluctuating environment.
Keywords: fluctuating resource environment; microbial population collapse; regulation; resilience; syntrophy.
© 2017 The Authors. Published under the terms of the CC BY 4.0 license.
Figures
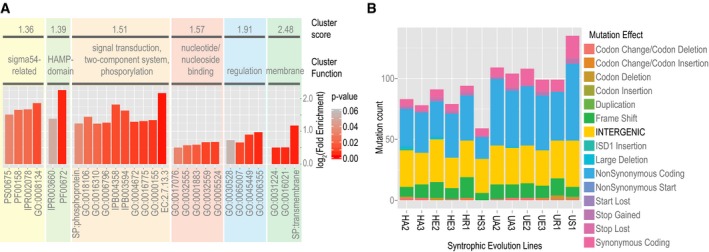
Functional enrichment of mutations accumulated during experimental evolution of Dv‐Mm syntrophic community. Fold‐enrichment for enriched ontology terms (P‐values < 0.05) is shown in functionally related clusters.
Number, type, and SnpEff‐predicted effects of mutations (Cingolani et al, 2012) accumulated over 1,000 generations during evolution of obligate ST between Dv and Mm. Enrichment of intergenic mutations was determined by a permutation test.
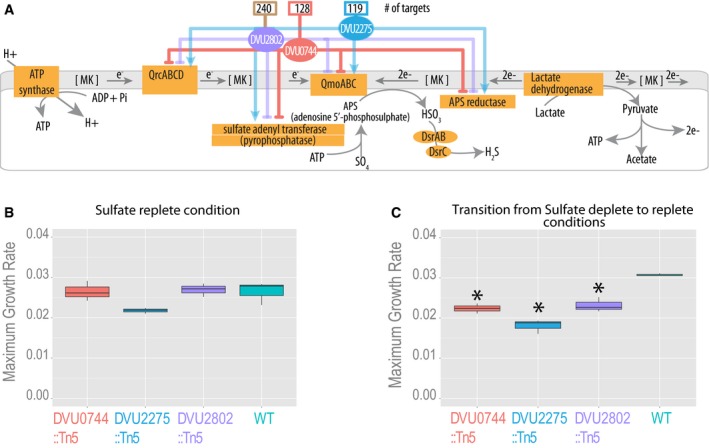
Three transcriptional regulators were predicted by the EGRIN model to influence the expression of SR genes. Influence of each regulator on its predicted targets is shown with color‐coded lines, with total number of gene targets above each regulator.
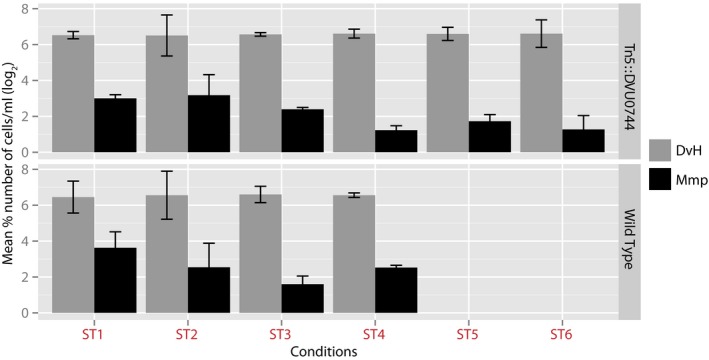
Maximum growth rates for all Dv strains in excess sulfate condition.
Maximum growth rates for wild type and the three regulatory mutants of Dv subsequent to transfer from a sulfate‐depleted condition to a growth medium with excess sulfate. Significant growth rate differences relative to wild type are indicated with an asterisk.
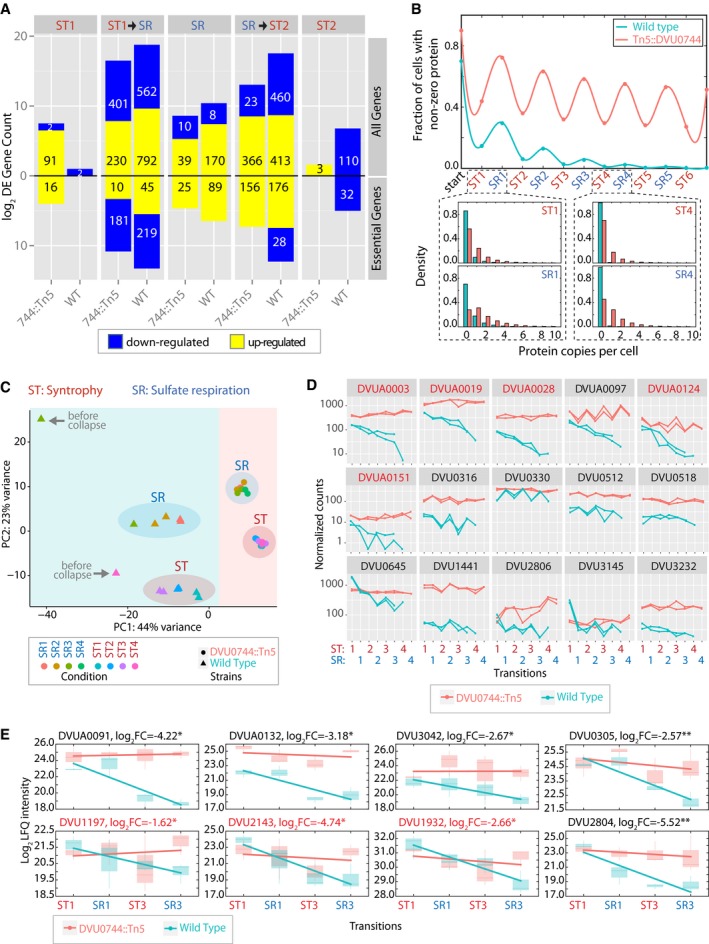
Global transcriptomes were profiled and compared between early and mid‐log phase within each condition, denoted ST1 (first iteration of ST), SR, and ST2 (second iteration of ST); and after transition between ST and SR. Upward barplot shows all differentially expressed genes, and the downward barplot shows only essential genes.
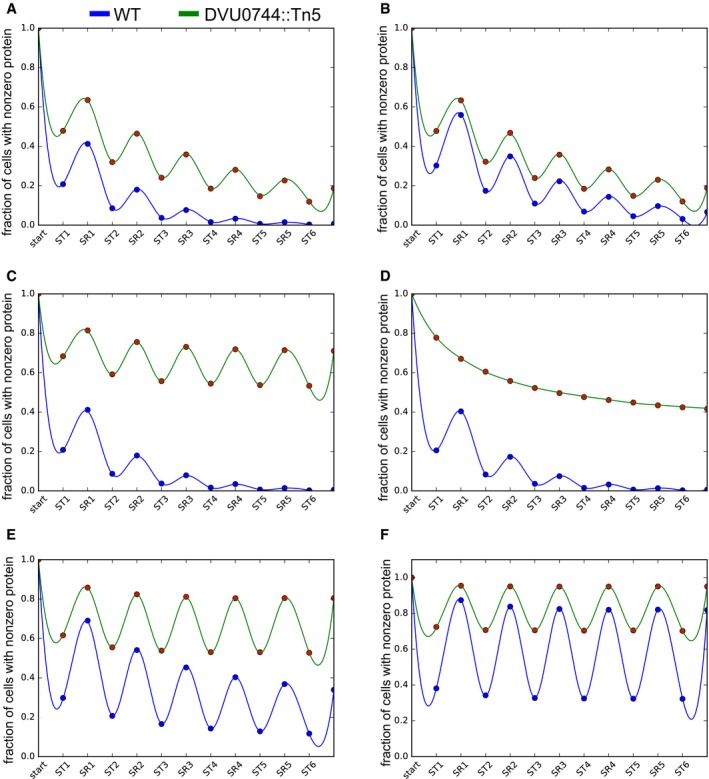
We simulated the protein copy number distribution in each phase of growth (ST and SR), assuming that a hypothetical gene was repressed in ST, but essential for SR. The fraction of cells with nonzero copies of an essential protein for sulfate respiration is plotted over several transfers (upper panel). Lower panel shows histogram of protein copy numbers per cell for selected early (ST1 and SR1) and later (ST4 and SR4) transitions.
PCA plot created by DESeq2 R package for visualizing clustering of experimental covariates based on the normalized read counts.
Change in abundance of selected Dv transcripts during experimental evolution of wild‐type and mutant co‐cultures. Normalized RNA‐seq read counts for each gene across two replicates for wild type (green) and mutant (red) are plotted on a log10 scale. Essential gene names are indicated in red. See Appendix Fig S1 for the complete list of transcripts.
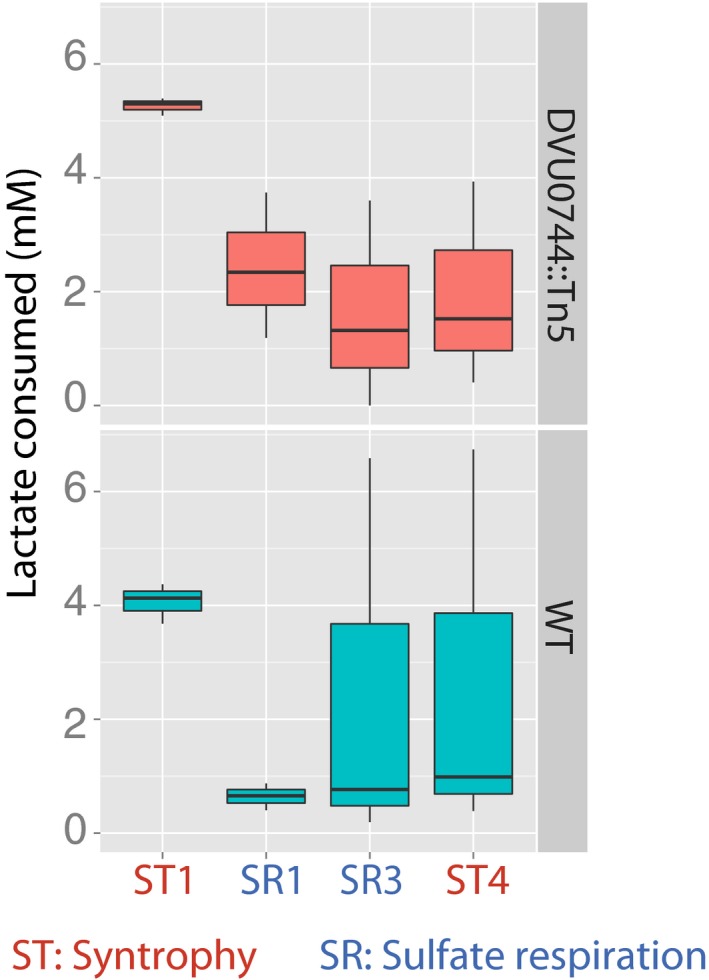
Log2‐fold change of protein abundance in ST1, SR1, ST3, and SR3 conditions, in the wild‐type and mutant co‐cultures (* indicates P‐value < 0.05, or ** indicates P‐value < 0.01). Essential gene names are indicated in red. See Table EV10 for the complete list of proteins. The lower and upper ends of the boxes (“hinges”) correspond to the first and third quartiles (the 25th and 75th percentiles). Horizontal lines correspond to median values. Error bars extend from the upper or lower hinges to the highest or lowest values that are within 1.5× IQR (interquartile range) of the hinge, respectively.
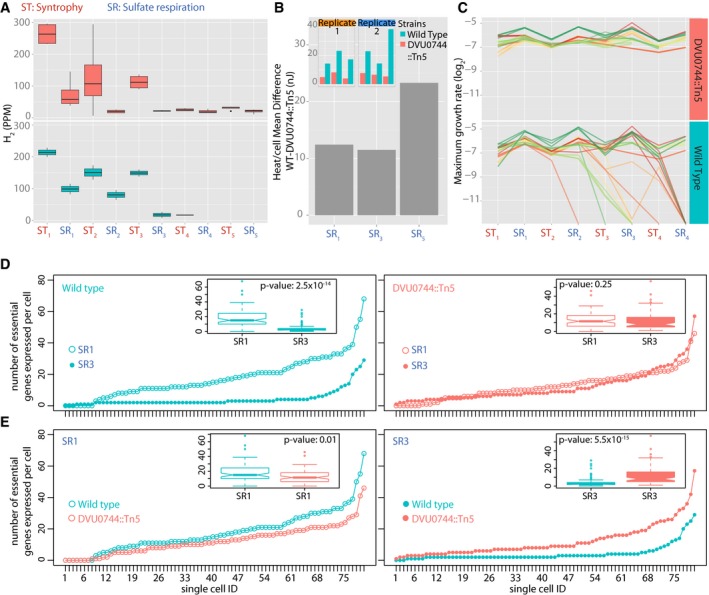
Boxplots for H2 levels in replicate wild‐type (lower panel) and mutant (upper panel) co‐cultures.
Microcalorimetry measurement of heat released (nj) per cell upon transition of wild‐type and mutant co‐cultures into SR conditions. Inset plots report total heat released by wild‐type (green) and mutant (red) co‐cultures in SR1, SR3, and SR5 conditions, in two replicate experiments. Gray bar plots represent difference between average heat production per cell of wild‐type and mutant strains, across the three successive SR conditions.
Growth rates for > 24 replicate co‐cultures of Mm with either wild‐type Dv (lower panel) or DVU0744::Tn5 (upper panel).
Significantly fewer essential genes are expressed across most single cells of the wild‐type population that is unable to grow in the subsequent transition. Here, the number of essential genes expressed above background genomic DNA are plotted for each analyzed single cell and cells are ordered by rank abundance for WT SR1‐ initial transfer versus SR3 transfer prior to collapse (left); and mutant SR1‐ initial transfer versus SR3 where growth continues in contrast to the WT population (right). Insets are boxplots of the same data with P‐values calculated from the equivalent of Mann–Whitney test (n = 80 single cells).
Number of essential genes per cell in wild type is compared to mutant during SR1 (left) and SR3 (right). See Materials and Methods. Insets are boxplots of the same data with P‐values calculated from the equivalent of Mann–Whitney test (n = 80 single cells).
- A–E
Best estimates for starting points were obtained from the empirical fitting of Cai et al (2006), and our observed population‐level transcript differences to produce the baseline figure in panel (A). Parameters were then modified as shown in Table EV13. In panel (B), we modified the degree of repression in the wild type to simulate a gene that was not as strongly repressed. In panels (C) and (D), we modified the degree of repression in the mutant to see the effect of increasing loss of regulation due to a regulatory mutation. Panel (C) shows that with twofold conditional repression, a protein will experience very little dilution across a cell population. In panel (D), there is no conditional repression at all, and the trajectory is a standard exponential decay. In panels (E) and (F), we explored the effect of translational efficiency by increasing the amount of proteins produced per burst. This simulation showed that very high translational efficiency can offset the effect of differential regulation, supporting the notion that conditionally essential low‐abundance proteins are the most likely culprit in causing the extinction event.
References
-
- Alexa A, Rahnenführer J (2009) Gene set enrichment analysis with topGO. (www.bioconductor.org).
-
- Alon U (2007) An introduction to systems biology: design principles of biological circuits. London, UK: Chapman and Hall/CRC;
-
- Andrews S (2010) FastQC: A quality control tool for high throughput sequence data. http://www.bioinformatics.babraham.ac.uk/projects/fastqc/
Publication types
MeSH terms
Substances
Grants and funding
LinkOut - more resources
Full Text Sources
Other Literature Sources
Molecular Biology Databases
