Review
. 2017 Apr;29(4):666-680.
doi: 10.1105/tpc.16.00931. Epub 2017 Mar 20.

Mechanisms to Mitigate the Trade-Off between Growth and Defense

Affiliations
Review

Mechanisms to Mitigate the Trade-Off between Growth and Defense

Talia L Karasov et al. Plant Cell. 2017 Apr.

Abstract

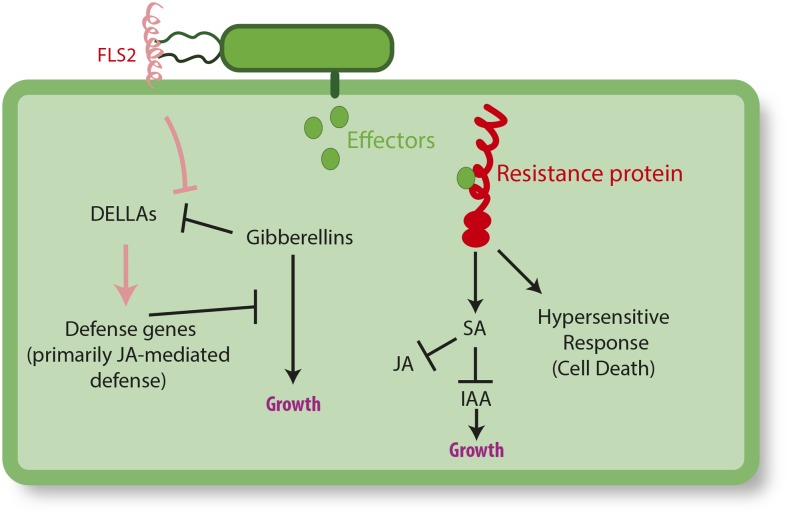
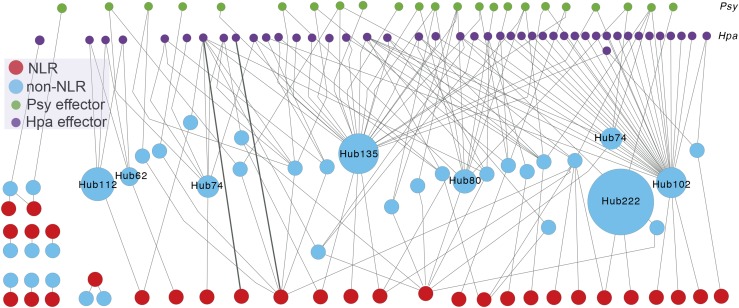
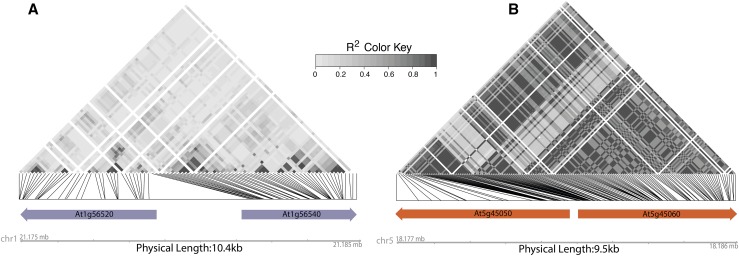
Plants have evolved an array of defenses against pathogens. However, mounting a defense response frequently comes with the cost of a reduction in growth and reproduction, carrying critical implications for natural and agricultural populations. This review focuses on how costs are generated and whether and how they can be mitigated. Most well-characterized growth-defense trade-offs stem from antagonistic crosstalk among hormones rather than an identified metabolic expenditure. A primary way plants mitigate such costs is through restricted expression of resistance; this can be achieved through inducible expression of defense genes or by the concentration of defense to particular times or tissues. Defense pathways can be primed for more effective induction, and primed states can be transmitted to offspring. We examine the resistance (R) genes as a case study of how the toll of defense can be generated and ameliorated. The fine-scale regulation of R genes is critical to alleviate the burden of their expression, and the genomic organization of R genes into coregulatory modules reduces costs. Plants can also recruit protection from other species. Exciting new evidence indicates that a plant's genotype influences the microbiome composition, lending credence to the hypothesis that plants shape their microbiome to enhance defense.


Figures

Figure 1.
Figure 1.
Examples of Immune Receptor Crosstalk with Plant Development. A simplified cartoon illustrating the response of a plant to recognition of pathogen via two different immune proteins: recognition of bacterial flagellin via FLS2 and recognition of a bacterial effector via an R protein. Detection of flagellin by FLS2 causes the stabilization of DELLA proteins, the upregulation of defense (primarily JA-mediated defenses), and the downregulation of gibberellin-mediated growth (Zentella et al., 2007; Navarro et al., 2008). Recognition of bacterial effectors by the corresponding R protein causes upregulation of SA, and downregulation of indole-3-acetic acids (IAAs; involved in growth promotion) and of JA (involved in resistance to necrotrophs and herbivores). The recognition by the R protein also induces HR, a type of programmed cell death in plants. In summary, the recognition of non-self by immune receptors results in both the downregulation of several growth pathways but also in the upregulation of defense genes and cell death. Note, there is additional crosstalk between IAA, SA, JA, and HR not depicted here. The interactions illustrated here are not exhaustive and instead are a small subset of the extensive crosstalk interactions that have been elucidated (for thorough review, see Denancé et al., 2013; Huot et al., 2014).
Figure 2.
Figure 2.
The Interconnected Activity of NLRs and Protein Interaction Hubs. A network illustrating interactions among pathogen effectors, effector targets, and NLRs reconstructed from the PPIN-1 interactome study by Mukhtar et al. (2011). The reconstruction using Cytoscape visualizes complexity of the interactions that NLR proteins make through other host proteins. Nodes representing effectors are aligned in the top two rows: green nodes for P. syringae (Psy) effectors and purple nodes for effectors from the biotrophic oomycete, Hpa. Red nodes represent 30 NLRs included in the PPIN-1, and turquoise nodes represent Arabidopsis proteins showing interactions with NLRs. Gray edges represent protein-protein interactions assayed by yeast two-hybrid system in PPIN-1. The number after Hub indicates the number of interaction partners of the host protein in the main interactome AI-1 (Mukhtar et al., 2011). A single NLR can be connected with multiple effector targets, while an effector target can be connected to multiple NLRs. Only two NLRs show direct interactions with effector proteins (bold edges), while most other NLRs in the main network make indirect connections to effectors through host proteins. R gene activities are highly interconnected both with one another and with other immune proteins. This interconnectedness makes optimizing the immune response more difficult, as changes in one protein have a high probability of affecting the activity of another immune protein. The interactome network analysis was inferred from yeast two-hybrid associations.
Figure 3.
Figure 3.
Linkage between R Gene Haplotypes May Provide Evidence of Functional Cooperation and Coevolution. Linkage across 762 Arabidopsis genotypes (Kawakatsu, 2016) is represented as R2 values of SNPs (minor allele frequency > 0.2) within R genes and visualized as a heat map. Only R genes are marked with arrows in these regions. Linkage disequilibrium in the region carrying At1g56520 and At1g56540 (A) is relatively low compared with that in the region carrying At5g45050 (RRS1B) and At5g45060 (RPS4B) (B). The increased linkage (higher R2) across the entire locus in (B) may be the result of the coevolution of alleles of the two R genes for their cooperative function. Functional cooperation of At5g45050 and At5g45060 (B) as a pair was demonstrated for disease resistance specificity as well as for tight cross-regulation against constitutive activity (Narusaka et al., 2009; Saucet et al., 2015). No such interaction was observed for the two R genes depicted in (A). If two R genes nearby or at a distance function together, mismatched allelic combinations could result in fitness costs. It is therefore reasonable to expect such R gene pairs to evolve tight linkage at either short range or long distance. Measuring linkage and population genomic statistics of R gene pairs in large sequencing projects, as we demonstrate here, may allow for the identification of candidate loci for interacting/coevolving pairs and allelic variants.

References

    1. Agler M.T., Ruhe J., Kroll S., Morhenn C., Kim S.-T., Weigel D., Kemen E.M. (2016). Microbial hub taxa link host and abiotic factors to plant microbiome variation. PLoS Biol. 14: e1002352. - PMC - PubMed
    1. Agrawal A.A. (2001). Transgenerational consequences of plant responses to herbivory: an adaptive maternal effect? Am. Nat. 157: 555–569. - PubMed
    1. Akkerman K.C., Sattarin A., Kelly J.K., Scoville A.G.(2016). Transgenerational plasticity is sex-dependent and persistent in yellow monkeyflower (Mimulus guttatus). Environ. Epigenet. 2: dvw003. - PMC - PubMed
    1. Alsdurf J.D., Ripley T.J., Matzner S.L., Siemens D.H. (2013). Drought-induced trans-generational tradeoff between stress tolerance and defence: consequences for range limits? AoB Plants 5: plt038. - PMC - PubMed
    1. Anderson R.M., May R.M. (1982). Coevolution of hosts and parasites. Parasitology 85: 411–426. - PubMed