. 2017 Apr 19;37(16):4255-4269.
doi: 10.1523/JNEUROSCI.3481-16.2017. Epub 2017 Mar 20.

STAT3 Controls the Long-Term Survival and Phenotype of Repair Schwann Cells during Nerve Regeneration

Affiliations

STAT3 Controls the Long-Term Survival and Phenotype of Repair Schwann Cells during Nerve Regeneration

Cristina Benito et al. J Neurosci. .

Abstract

After nerve injury, Schwann cells convert to a phenotype specialized to promote repair. But during the slow process of axonal regrowth, these repair Schwann cells gradually lose their regeneration-supportive features and eventually die. Although this is a key reason for the frequent regeneration failures in humans, the transcriptional mechanisms that control long-term survival and phenotype of repair cells have not been studied, and the molecular signaling underlying their decline is obscure. We show, in mice, that Schwann cell STAT3 has a dual role. It supports the long-term survival of repair Schwann cells and is required for the maintenance of repair Schwann cell properties. In contrast, STAT3 is less important for the initial generation of repair Schwann cells after injury. In repair Schwann cells, we find that Schwann cell STAT3 activation by Tyr705 phosphorylation is sustained during long-term denervation. STAT3 is required for maintaining autocrine Schwann cell survival signaling, and inactivation of Schwann cell STAT3 results in a striking loss of repair cells from chronically denervated distal stumps. STAT3 inactivation also results in abnormal morphology of repair cells and regeneration tracks, and failure to sustain expression of repair cell markers, including Shh, GDNF, and BDNF. Because Schwann cell development proceeds normally without STAT3, the function of this factor appears restricted to Schwann cells after injury. This identification of transcriptional mechanisms that support long-term survival and differentiation of repair cells will help identify, and eventually correct, the failures that lead to the deterioration of this important cell population.SIGNIFICANCE STATEMENT Although injured peripheral nerves contain repair Schwann cells that provide signals and spatial clues for promoting regeneration, the clinical outcome after nerve damage is frequently poor. A key reason for this is that, during the slow growth of axons through the proximal parts of injured nerves repair, Schwann cells gradually lose regeneration-supporting features and eventually die. Identification of signals that sustain repair cells is therefore an important goal. We have found that in mice the transcription factor STAT3 protects these cells from death and contributes to maintaining the molecular and morphological repair phenotype that promotes axonal regeneration. Defining the molecular mechanisms that maintain repair Schwann cells is an essential step toward developing therapeutic strategies that improve nerve regeneration and functional recovery.

Keywords: Schwann; denervation; injury; nerve; regeneration; repair.


Figures

Figure 1.
Figure 1.
Basal activation of STAT3 takes place early in Schwann cell development and persists in the adult. A, Western blots showing total STAT3 and its phosphorylated forms in sciatic nerve extracts from WT control mice at different developmental stages. STAT3 is present throughout the Schwann cell lineage. P-STAT3-Ser727 is found at very low levels in Schwann cell precursors (E12), but its expression increases at the immature Schwann cell stage and is maintained in adulthood. P-STAT3-Tyr705 is expressed at lower levels and seen from the immature Schwann cell stage (E18) onwards. GAPDH is used as a loading control. B, Fibers in teased sciatic nerve preparations showing P-STAT3-Ser727 immunoreactivity in Schwann cell nuclei (red; top two panels) also stained with DAPI (bottom two panels). Two left panels, Nonmyelinated (Remak) fiber, identified by L1 antibodies. Right panels, Myelinated fiber, identified by MBP antibodies. Scale bar, 25 μm.
Figure 2.
Figure 2.
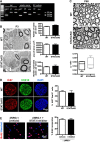
STAT3 appears dispensable for Schwann cell development and myelination. A, Cre-mediated deletion of the STAT3 gene in Schwann cells. PCR analysis for STAT3 gene deletion in DNA extracts from tail and sciatic nerve of adult genetically wild-type (gWT), STAT3f/f (f/f), and P0-Cre+STAT3f/f (cKO) mice. Amplification of the gWT allele results in a 210 bp fragment, whereas STAT3f/f allele containing the loxP sites generates a bigger band (370 bp). The deleted allele generates a 310 bp fragment. Specific recombination is absent from the tail of cKO mice but present in cKO sciatic nerve where Cre recombinase is expressed under the control of the P0 gene. Successful deletion in the STAT3 gene was also detected in DNA samples from P8 purified Schwann cell cultures from STAT3cKO mice. B, Electron micrographs from P3 sciatic nerves of WT and STAT3cKO mice showing normal nerve morphology and no apparent abnormalities of myelination in the mutant. Graphs represent quantification of number of nuclei per transverse nerve section (top), nerve area (middle), and number of axons starting to be myelinated (bottom) in WT and STAT3cKO nerves. n = 5 mice of each genotype. Data are mean ± SEM. Scale bar, 1 μm. C, Electron micrographs from adult sciatic nerves of WT and STAT3cKO mice showing normal myelin profiles in the mutant. Graph represents g-ratio analysis; the differences in g-ratios are not significant. n = 4 of each genotype. Data are mean ± SEM. Scale bar, 1 μm. D, Ki67 immunolabeling showing similar Schwann cell proliferation in P1.5 sciatic nerves of WT and STAT3cKO mice. Transverse nerve sections were double-labeled for SOX10 and Ki67. Graph represents the percentage of Ki67+SOX10+ cells relative to total number of SOX10+ cells, showing no differences between groups. n = 4 for each genotype. Data are mean ± SEM. Scale bar, 25 μm. E, BrdU immunolabeling showing that inhibition of STAT3 has no significant effect on Schwann cell proliferation induced by βNRG-1. Cultured, purified Schwann cells from WT mice were treated with βNRG-1 (20 ng/ml) for 48 h to stimulate proliferation with BrdU included for the last 24 h. The experiment was performed in the presence of vehicle or a STAT3 peptide inhibitor. Graph represents the percentage of BrdU+ nuclei relative to the number of Hoechst-stained nuclei. n = 4 for each genotype. Data are mean ± SEM. Scale bar, 50 μm.
Figure 3.
Figure 3.
STAT3 activation after injury promotes Schwann cell survival. A, Western blots showing the upregulation of P-STAT3-Tyr705 and P-STAT3-Ser727 distal to injury in uncut, as well as in 3, 7, and 28 d cut sciatic nerves from WT mice. The measurements were performed on 2 and 5 mm segments measured from the cut site as indicated. Densitometric quantification of Western blots shows the percentage of activation in cut relative to uncut nerves. n = a minimum of 4 mice per time point. Data are mean ± SEM. **p < 0.01, cut versus uncut (one-way ANOVA). ***p < 0.001, cut versus uncut (one-way ANOVA). ****p < 0.0001, cut versus uncut (one-way ANOVA). B, Western blots comparing WT tibial nerve segments maintained in vitro for 3 d, to uninjured WT nerves. Note activation of P-STAT3-Tyr705 in the segments while P-STAT3-Ser727 levels remain as in uninjured nerves. Graphs represent the percentage of activation in segments relative to uninjured nerves. n = 5. Data are mean ± SEM. **p < 0.01 (Mann–Whitney U test). C, Teased fibers of 3 d cut nerves from WT control mice labeled with P-STAT3-Tyr705 and P-STAT3-Ser727 antibodies. Positive immunostaining is localized in Schwann cell nuclei. DAPI labels nuclei. Scale bar, 50 μm. D, TUNEL labeling of sections from the distal stump of sciatic nerve 3 d after cut. Note higher percentage of apoptotic nuclei in STAT3cKO mice compared with WT controls. Arrows indicate TUNEL-positive nuclei. Graph represents percentage of TUNEL/S100-positive cells in the Hoechst/S100-positive Schwann cell population. n = 4 for each genotype. Data are mean ± SEM. *p < 0.05 (Mann–Whitney U test). Scale bar, 20 μm.
Figure 4.
Figure 4.
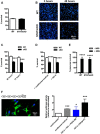
STAT3 protects Schwann cells from apoptosis after 24 h exposure to UV light. A, Graph shows higher percentage of apoptotic nuclei in rat Schwann cells treated with AG490 (25 μm) to inhibit JAK2/STAT3 signaling compared with vehicle. n = 3 for each genotype. Data are mean ± SEM. **p < 0.01 (two-way ANOVA). B, Graph shows lower percentage of cell apoptosis in rat Schwann cells expressing a constitutively active form of STAT3 (STAT3-CA). Cultured Schwann cells were cotransfected with STAT3-CA or an empty vector (pRcCMV) and GFP. n = 5 for each genotype. Data are mean ± SEM. ****p < 0.0001 (two-way ANOVA). C, Graph showing percentage of apoptotic nuclei in STAT3f/f mouse Schwann cells infected with a control GFP- (WT) or Cre-expressing (STAT3cKO) adenovirus. Cre-mediated deletion of the STAT3 gene in STAT3f/f Schwann cells increased the percentage of UV-induced apoptosis. n = 5 for each genotype. Data are mean ± SEM. ****p < 0.0001 (two-way ANOVA).
Figure 5.
Figure 5.
STAT3 promotes long-term survival of Schwann cells after nerve injury. A, Western blots of uncut, and of 1 and 8 week cut nerves in WT mice showing that P-STAT3-Tyr705 and P-STAT3-Ser727 remain elevated at 8 weeks, although the levels are somewhat lower than at 1 week. Densitometric quantification shows the percentage of activation in 8 week cut nerves relative to 1 week cut nerves. n = 3 for each genotype. Data are mean ± SEM. *p < 0.05 (Wilcoxon's signed rank test). B, Graphs representing the number of cell nuclei per transverse section of the tibial nerve. Electron micrographs of WT and STAT3cKO tibial nerves 5 mm distal to injury were used to identify and count cell types at 4 weeks (n = 3), 8 weeks (n = 7), and 10 weeks (n = 6) after sciatic nerve transection. Upper panels, Reduced number of Schwann cell nuclei in STAT3cKO tibial nerves 8 and 10 weeks after injury. Lower panels, No differences in macrophage number, but 10 week cut nerves from STAT3cKO mice had reduced numbers of fibroblasts. Data are mean ± SEM. *p < 0.05, STAT3cKO versus WT (Mann–Whitney U test). **p < 0.01, STAT3cKO versus WT (Mann–Whitney U test). C, Western blots showing no differences in cyclin D1 expression in 4 d and 4 week STAT3cKO cut nerves compared with WT nerves. GAPDH is used as a loading control. Graph represents the densitometric analysis of the Western blot. Each value is normalized to that seen in 4 d cut WT nerves. n = 4 for each condition. Data are mean ± SEM. D, Graphs show higher caspase-3 expression in 8 week cut nerves from STAT3cKO mice than in WT mice. n = 4 for WT and n = 3 for STAT3cKO. Data are mean ± SEM. *p < 0.05 (Mann–Whitney U test).
Figure 6.
Figure 6.
STAT3 is required for normal autocrine survival signaling by denervated Schwann cells. A, Without autocrine support (at low density, 200 cells/400 μl of medium), STAT3cKO and WT Schwann cells show similar 48 h survival in sDM without serum. Survival is expressed as a percentage of cells present on sister coverslips 3 h after plating. n = 3. Data are mean ± SEM. B, Hoechst staining shows nuclei of Schwann cells from P1 WT and STAT3cKO nerves cultured at high density (4000 cells/400 μl of medium) in sDM without serum for 3 and 48 h. There are reduced cell numbers in STAT3cKO cultures at 48 h. Scale bar, 50 μm. C, With autocrine support (at high density, 4000 cells/400 μl), STAT3cKO Schwann cells survive poorly at 48 and 72 h compared with WT cells. The cells were cultured in sDM without serum. Survival is expressed as in A. n = 3. Data are mean ± SEM. ***p < 0.001, STAT3cKO versus WT (two-way ANOVA). D, Graph showing that low-density WT cultures respond to conditioned medium, or IGF-II at high concentration (100 ng/ml) by increase in survival at 48 h (compare with A). STAT3cKO cultures do not show this response. n = 3. Data are mean ± SEM. ****p < 0.0001, WT versus STAT3cKO (two-way ANOVA). E, WT and STAT3cKO Schwann cell precursors are equally responsive to the survival signal βNRG-1. Schwann cell precursors were dissected from STAT3cKO and WT E13 mouse embryos and cultured for 24 h with or without βNRG-1 (20 ng/ml). Survival was assessed as in A. n = 4. Data are mean ± SEM. ****p < 0.0001, βNRG-1-treated versus untreated (two-way ANOVA). F, Micrograph represents cultured rat Schwann cells infected with the STAT3-Luc-GFP adenovirus (green) and Hoechst nuclear staining (blue). Graph represents luciferase fluorescence, indicative of STAT3 activation, in response to 48 h exposure to conditioned medium, the combination of IGF-II (1.6 ng/ml), NT3 (0.8 ng/ml), and PDGF-BB (0.8 ng/ml) that mimics the conditioned medium, or high concentration of IGF-II (100 ng/ml). The activation is expressed relative to the signal obtained from control medium. n = 6 for conditioned medium and n = 12 for the combination of IGF-II, NT3, and PDGF-BB and high concentration of IGF-II. Data are mean ± SEM. *p < 0.05 (Kruskal–Wallis test). ***p < 0.001 (Kruskal–Wallis test). Scale bar, 10 μm.
Figure 7.
Figure 7.
STAT3 is required for the maintenance of the repair Schwann cell phenotype. A, Electron micrographs showing transverse sections of WT and STAT3cKO distal stumps at 4 and 8 weeks after transection (without regeneration). Note abnormal morphology of the regeneration tracks (bands of Büngner) in 8 week STAT3cKO nerves compared with 8 week WT controls. Right panels, Higher-power micrographs from STAT3cKO nerves illustrating redundant basal lamina (asterisks) and regeneration tracks containing a single (one arrow) or a few (double arrow) Schwann cell profiles, enclosed by a basal lamina. Scale bar, 1 μm. B–E, Morphometric analysis of 8 week cut nerves. B, The number of Schwann cell profiles per Büngner band is reduced by more than half in 8 week cut STAT3cKO nerves. n = 3. Data are mean ± SEM. ****p < 0.0001 (Mann–Whitney U test). C, Schwann profiles in STAT3cKO regeneration tracks lose their roundness and become flatter. n = 3. Data are mean ± SEM. ****p < 0.0001 (Mann–Whitney U test). D, The average area of Schwann cell profiles in STAT3cKO nerves is larger than in WT nerves. n = 3. Data are mean ± SEM. ****p < 0.0001 (Mann–Whitney U test). E, STAT3cKO nerves show sixfold increase in the number of redundant basal laminae compared with WT samples. n = 3. Data are mean ± SEM. ****p < 0.0001 (Mann–Whitney U test). F, qRT-PCR analysis showing significantly lower mRNA expression of the repair Schwann cell genes c-Jun, Olig1, Shh, GDNF, and BDNF, in 8 week cut distal nerves from STAT3cKO mice compared with WT controls. A pool of 9 WT and STAT3cKO distal stumps were used for RNA extraction. n = 3. Data are mean ± SEM. *p < 0.05 (Mann–Whitney U test). G, Western blots showing lower expression of c-Jun in 8 week cut nerves from STAT3cKO mice compared with WT controls. n = 4 for each genotype. Data are mean ± SEM. *p < 0.05 (Mann–Whitney U test). H, Western blots showing lower expression of GAP-43 in 8 week cut nerves from STAT3cKO mice compared with WT controls. Shown also are the relatively low GAP-43 levels 1 week after cut in both genotypes. Graphs represent the densitometric analysis of Western blots relative to WT uncut. n = 4 for each genotype. Data are mean ± SEM. ***p < 0.001 (two-way ANOVA). I, Western blots showing similar levels of p75NTR and N-Cadherin in 8 week cut nerves of WT and STAT3cKO mice. n = 4 for each genotype. Graphs represent the densitometric analysis of Western blots relative to WT uncut. Data are mean ± SEM.
Figure 8.
Figure 8.
STAT3 is not required for the initial generation of the repair Schwann cell phenotype. A, qRT-PCR analysis shows that, 1 week after cut, c-Jun expression in WT and STAT3cKO nerves is similar. RNA was extracted from 1 week cut nerves using a pool of 2 distal stumps from STAT3cKO and WT mice for each experiment. n = 4. Data are mean ± SEM. B, Western blots showing similar c-Jun protein levels in 1 week cut WT and STAT3cKO nerves. Graphs represent the densitometric analysis of Western blots relative to WT uncut. n = 4 mice for each genotype. Data are mean ± SEM. C, Western blots showing no differences in the expression of N-Cadherin and p75NTR proteins in WT and STAT3cKO nerves 1 week after cut. Graphs represent the densitometric analysis of Western blots relative to WT uncut. n = 4 mice for each genotype. Data are mean ± SEM. D, Walking track analysis to quantify sensory-motor function following sciatic nerve injury. Sciatic function index (Inserra et al., 1998), which assesses nerve-mediated function of the hindlimb by measuring toe spread and print length of hindpaw footprints, showed similar values for WT and STAT3cKO mice before and, significantly, after nerve injury. Right, Representative examples of footprints from uninjured mice and at different times after injury as indicated. Note the increased print length and decreased toe spread after peripheral nerve lesion in both mouse lines. ui, Uninjured. n = 6. Data are mean ± SEM. E, Toe spread reflex measurements show no significant differences in recovery of motor function between WT and STAT3cKO mice. n = 6. Data are mean ± SEM. F, Toe pinch test for sensory function shows no significant differences between WT and STAT3cKO mice in the percentage of mice responding to pinching distal parts of toes 3, 4, and 5 after sciatic nerve lesion. n = 6. Data are mean ± SEM.

References

    1. Aaronson DS, Horvath CM (2002) A road map for those who don't know JAK-STAT. Science 296:1653–1655. 10.1126/science.1071545 - DOI - PubMed
    1. Ahmad I, Fernando A, Gurgel R, Clark JJ, Xu L, Hansen MR (2015) Merlin status regulates p75(NTR) expression and apoptotic signaling in Schwann cells following nerve injury. Neurobiol Dis 82:114–122. 10.1016/j.nbd.2015.05.021 - DOI - PMC - PubMed
    1. Akagi K, Sandig V, Vooijs M, Van der Valk M, Giovannini M, Strauss M, Berns A (1997) Cre-mediated somatic site-specific recombination in mice. Nucleic Acids Res 25:1766–1773. 10.1093/nar/25.9.1766 - DOI - PMC - PubMed
    1. Allan CH. (2000) Functional results of primary nerve repair. Hand Clin 16:67–72. - PubMed
    1. Alonzi T, Maritano D, Gorgoni B, Rizzuto G, Libert C, Poli V (2001) Essential role of STAT3 in the control of the acute-phase response as revealed by inducible gene inactivation [correction of activation] in the liver. Mol Cell Biol 21:1621–1632. 10.1128/MCB.21.5.1621-1632.2001 - DOI - PMC - PubMed

Publication types

MeSH terms

Substances