. 2017 Apr 19;37(16):4332-4342.
doi: 10.1523/JNEUROSCI.2700-16.2017. Epub 2017 Mar 20.

Working Memory Load Strengthens Reward Prediction Errors

Affiliations

Working Memory Load Strengthens Reward Prediction Errors

Anne G E Collins et al. J Neurosci. .

Abstract

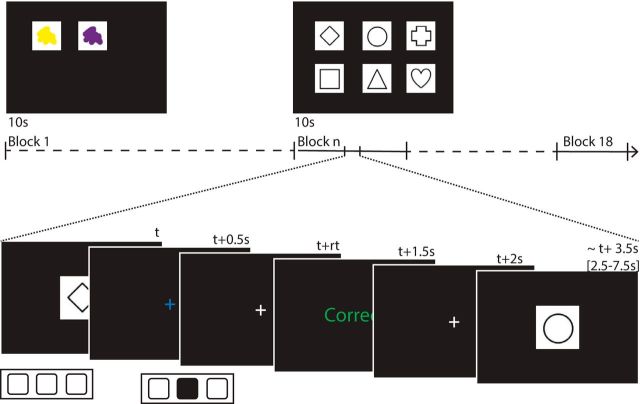
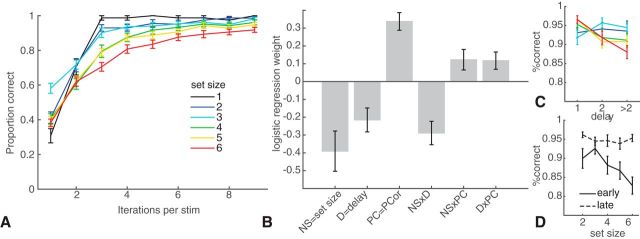
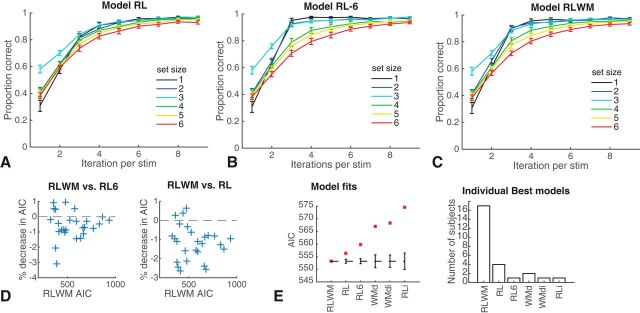
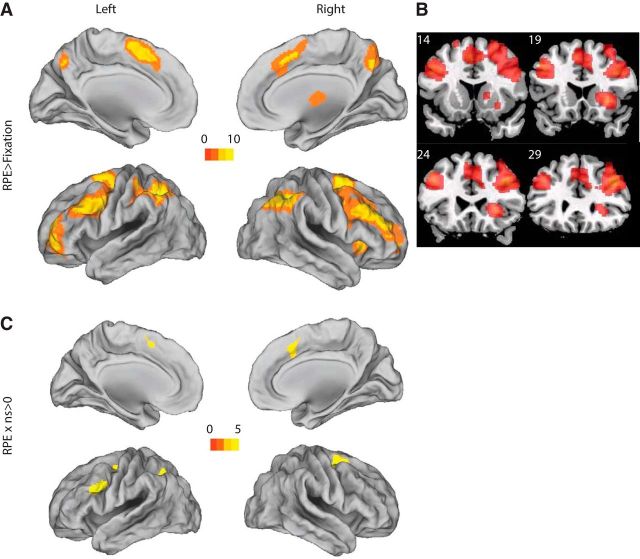
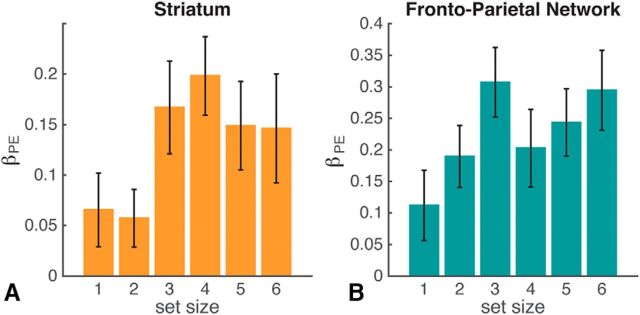
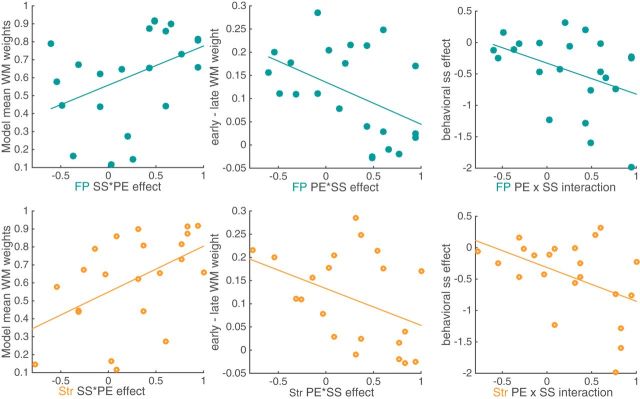
Reinforcement learning (RL) in simple instrumental tasks is usually modeled as a monolithic process in which reward prediction errors (RPEs) are used to update expected values of choice options. This modeling ignores the different contributions of different memory and decision-making systems thought to contribute even to simple learning. In an fMRI experiment, we investigated how working memory (WM) and incremental RL processes interact to guide human learning. WM load was manipulated by varying the number of stimuli to be learned across blocks. Behavioral results and computational modeling confirmed that learning was best explained as a mixture of two mechanisms: a fast, capacity-limited, and delay-sensitive WM process together with slower RL. Model-based analysis of fMRI data showed that striatum and lateral prefrontal cortex were sensitive to RPE, as shown previously, but, critically, these signals were reduced when the learning problem was within capacity of WM. The degree of this neural interaction related to individual differences in the use of WM to guide behavioral learning. These results indicate that the two systems do not process information independently, but rather interact during learning.SIGNIFICANCE STATEMENT Reinforcement learning (RL) theory has been remarkably productive at improving our understanding of instrumental learning as well as dopaminergic and striatal network function across many mammalian species. However, this neural network is only one contributor to human learning and other mechanisms such as prefrontal cortex working memory also play a key role. Our results also show that these other players interact with the dopaminergic RL system, interfering with its key computation of reward prediction errors.

Keywords: fMRI; reinforcement learning; reward prediction error; working memory.


Figures

Figure 1.
Figure 1.
Experimental protocol. At the beginning of each block, subjects were shown for 10 s the set of stimuli they would see in that block. In this example, Block 1 uses color patches for stimuli and has a set size ns = 2; Block n uses shapes and has ns = 6. Each trial included the presentation of a stimulus for 0.5 s, followed by a blue fixation cross until subject pressed 1 of 3 buttons or up to 1.5 s after trial onset. Button press caused the fixation cross to turn white. Feedback was presented for 1 s and came 1.5 s after trial onset. Feedback consisted of the words “correct” or “incorrect” in green and red, respectively. The intertrial interval consisted of a white fixation cross with jittered duration to allow trial-by-trial event-related analysis of fMRI signal. Blocks set sizes varied between one and six and the order was randomized across subjects.
Figure 2.
Figure 2.
Behavioral results. A, Proportion of correct choices as a function of how many times a specific stimulus was encountered (i.e., learning curves) for each set size. B, Logistic regression on factors that contribute to accuracy for a given image, including set size (NS), delay since last previous correct choice for a given image (D), PCor (number of previous correct choices for that image), and their interactions. C, Illustration of the interaction between delay and set size. D, Illustration of the interaction between set size and PCor-early indicates PCor < 4; late indicates PCor > 6. Error bars indicate SEM.
Figure 3.
Figure 3.
Model validation. AC, Proportion of correct responses as a function of how many times a specific stimulus was encountered, for each set size, for simulation of different models with individually fit parameters. Models were simulated 100 times per subject and then averaged within subjects to represent this subject's contribution. Error bars indicate SEM across subjects. A, Simple RL model including decay and different sensitivity to gains/losses. B, Identical model to A but with learning rate varying per set size. C, Model incorporating both RL and WM. D, Model comparisons show a significantly lower AIC for RLWM than RL6 or RL for a significant number of subjects. Each cross indicates a single subject. E, Model comparison with other potential models show best fit for RLWM (see Materials and Methods for other model names).
Figure 4.
Figure 4.
Whole-brain effects of RPE and RPExns. A, B, Regions positively correlated with RPE (p < 0.05, cluster corrected). C, Regions showing a positive interaction of RPE with set size.
Figure 5.
Figure 5.
Striatum and frontoparietal ROIs show increased RPE effects in higher set sizes. Average β coefficient for RPE regressor per set size for striatal ROI (A) and frontoparietal network ROI (B) defined by Yeo et al. (2011). Error bars indicate SEM.
Figure 6.
Figure 6.
Effect of set size on RPE in the fMRI signal is related to individual differences in behavior. Left, Average model-inferred mixture weight assigned to WM over RL (“Model mean WM weight”) is significantly related to a stronger effect of set size in frontoparietal ROI (ρ = 0.49, p = 0.02) and in the striatum (ρ = 0.55, p = 0.01). Middle, Decrease in WM weight from early (first 3 iterations) to late in a learning block (last 3 iterations) is significantly related to fMRI effect in FP ROI (ρ= −0.46, p = 0.03) and marginally so in striatum (ρ= −0.41, p = 0.06). Right, Behavioral set size effect is measured as the logistic regression weight of the set size predictor; stronger behavioral effect is marginally related to a stronger neural effect in FP ROI (ρ= −0.41, p = 0.059) and in striatum ROI (ρ = 0.4, p = 0.063).

References

    1. Badre D, D'Esposito M (2007) Functional magnetic resonance imaging evidence for a hierarchical organization of the prefrontal cortex. J Cogn Neurosci 19:2082–2099. - PubMed
    1. Badre D, Frank MJ (2012) Mechanisms of hierarchical reinforcement learning in cortico-striatal circuits 2: evidence from fMRI. Cereb Cortex 22:527–536. - PMC - PubMed
    1. Björklund A, Dunnett SB (2007) Dopamine neuron systems in the brain: an update. Trends Neurosci 30:194–202. 10.1016/j.tins.2007.03.006 - DOI - PubMed
    1. Botvinick MM, Niv Y, Barto AC (2009) Hierarchically organized behavior and its neural foundations: a reinforcement learning perspective. Cognition 113:262–280. 10.1016/j.cognition.2008.08.011 - DOI - PMC - PubMed
    1. Burnham KP, Anderson DR (2002) Model selection and multi-model inference: a practical information-theoretic approach. New York: Springer.

Publication types