. 2017 Apr;27(4):501-511.
doi: 10.1101/gr.212225.116. Epub 2017 Mar 20.

Pan-cancer analysis distinguishes transcriptional changes of aneuploidy from proliferation

Affiliations

Pan-cancer analysis distinguishes transcriptional changes of aneuploidy from proliferation

Christopher Buccitelli et al. Genome Res. 2017 Apr.

Abstract

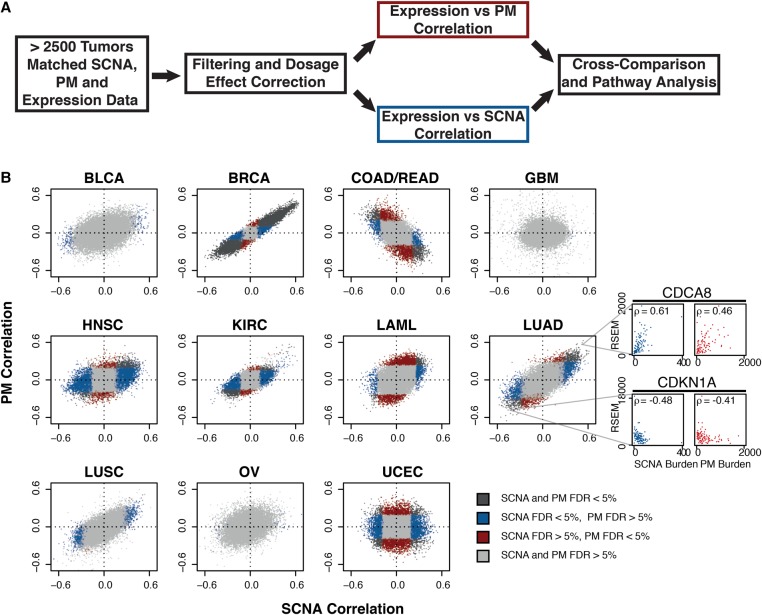
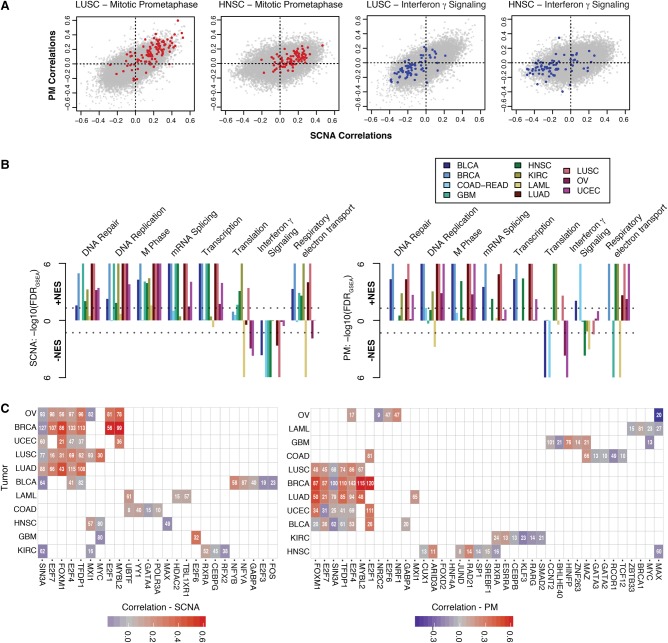
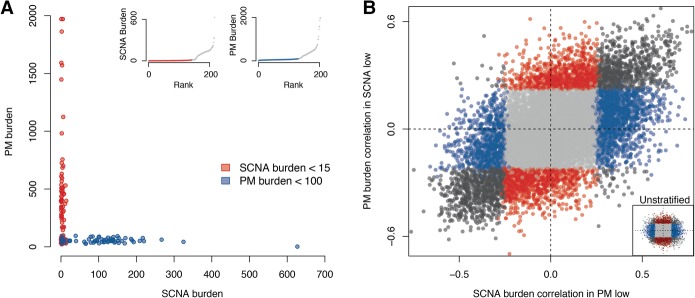
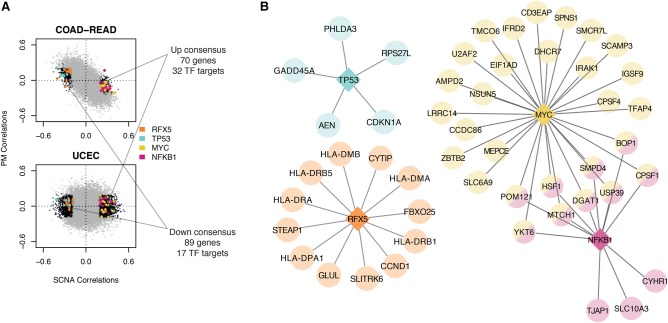
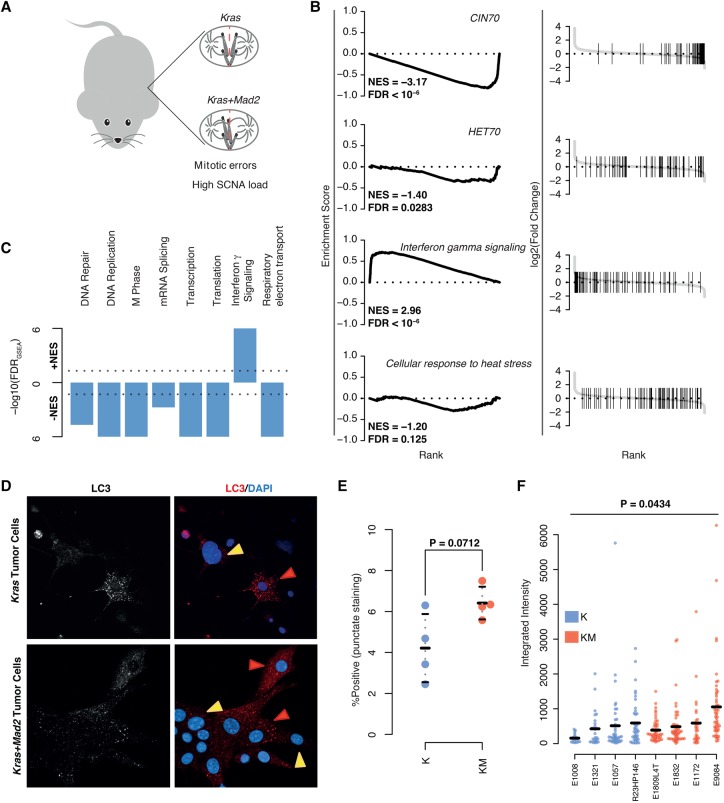
Patterns of gene expression in tumors can arise as a consequence of or result in genomic instability, characterized by the accumulation of somatic copy number alterations (SCNAs) and point mutations (PMs). Expression signatures have been widely used as markers for genomic instability, and both SCNAs and PMs could be thought to associate with distinct signatures given their different formation mechanisms. Here we test this notion by systematically investigating SCNA, PM, and transcriptome data from 2660 cancer patients representing 11 tumor types. Notably, our data indicate that similar expression signatures can be derived from correlating gene expression with either SCNA or PM load. Gene sets related to cell growth and proliferation generally associated positively, and immunoregulatory gene sets negatively, with variant burden. In-depth analyses revealed several genes whose de-regulation correlates with SCNA but not with PM burden, yielding downstream effectors of TP53 and MYC signaling unique to high-SCNA tumors. We compared our findings to expression changes observed in two different cancer mouse models with persistent mitotic chromosomal instability, observing a decrease in proliferative expression signatures. Our results suggest that overexpression of cell-cycle-related genes are a characteristic of proliferation, and likely tumor evolution, rather than ongoing genomic instability.


Figures

Figure 1.
Figure 1.
Comparative correlative analysis between gene expression, exonic PM burden, and SCNA burden. (A) Summary of correlation analysis workflow. (B) Gene-wise comparisons between SCNA burden (x-axis) and PM burden (y-axis). Shown are Spearman correlations across 11 tumor types from TCGA. Tumor type: bladder carcinoma (BLCA), breast carcinoma (BRCA), colon/rectal carcinoma (COAD-READ), glioblastoma (GBM), head and neck squamous cell carcinoma (HNSC), renal carcinoma (KIRC), acute myeloid leukemia (LAML), lung adenocarcinoma (LUAD), lung squamous cell carcinoma (LUSC), ovarian carcinoma (OV), and uterine cervix endometrial carcinoma (UCEC). Gray: FDRPM > 5% and FDRSCNA > 5%; blue: FDRPM > 5% and FDRSCNA < 5%; red: FDRPM < 5% and FDRSCNA > 5%; black: FDRPM < 5% and FDRSCNA < 5%. Representative correlation plots between variant burdens and expression shown in side panels. Colors represent specified FDR cutoffs (see legend). Representative examples of genes whose expression (RSEM, RNA-seq by expectation maximization values) are positively (CDCA8) or negatively (CDKN1A) correlating with SCNA or PM burden are shown in the side panel.
Figure 2.
Figure 2.
Pathway and transcriptional regulation prediction analyses of genes associated with PM and SCNA burden. (A) Examples of 2D gene set enrichment analyses (GSEA). Genes from sample Reactome gene sets are superimposed on HNSC and LUSC correlation plots. (B) GSEA across 11 tumor types. −log10-transformed FDRs are displayed on the y-axis with directionality denoting the direction of the enrichment. Colors denote tumor types described in the legend. (Left panel) SCNA correlation enrichments. (Right panel) PM correlation enrichments. Dotted lines denote cutoffs corresponding to FDRGSEA < 0.05. (C) iRegulon transcription factor prediction of top 200 genes correlating with SCNA (left) or PM (right) burden. Per tumor type (rows), transcription factors (columns) predicted to regulate a significant number (number within tile) are shown. In cases where a transcription factor is predicted, the correlation coefficient of that factor's gene itself is denoted by the color (see legend).
Figure 3.
Figure 3.
Comparative correlative analysis of gene expression in tumors stratified by variant type. (A) Endometrial cancers (UCEC) segregated based on low-SCNA (red) or low-PM (blue) burden. Insets show sample composition of low-SCNA (left) and low-PM (right) tumors. (B) Comparison between SCNA burden correlations in low-PM tumors (x-axis) and PM burden correlations in low-SCNA tumors (y-axis). Gray: FDRPM > 5% and FDRSCNA > 5%; blue: FDRPM > 5% and FDRSCNA < 5%; red: FDRPM < 5% and FDRSCNA > 5%; black: FDRPM < 5% and FDRSCNA < 5%. Lower right inset displays distribution of the unstratified UCEC correlation distribution.
Figure 4.
Figure 4.
Comparison of gene signatures present in UCEC and COAD-READ. (A) Correlation distributions of COAD-READ and UCEC. Black dots represent FDRSCNA < 5% and FDRPM > 5%. Colored dots represent regulated genes predicted by iRegulon (corresponding transcription factors in legend). Text describes overlap between negative (down consensus) and positive (up consensus) correlating sets. (B) Predicted transcriptional networks based on iRegulon. Circular nodes represent target genes, with predicted regulators denoted by diamonds.
Figure 5.
Figure 5.
Gene set enrichment analysis of transcriptional changes between Kras-Mad2l1 and Kras breast tumors. (A) Descriptive image of mouse model. (B) GSEA plots of select gene sets. (Left) Running-sum plots with running sum on y-axis and gene rank based on fold change on x-axis. (Right) Ranked fold changes with gene-set members denoted by shaded lines. Normalized enrichment scores (NESs) and FDRs are displayed in the plot. (C) Overview of GSEA results for breast KM versus K models. −log10-transformed FDRs are displayed on the y-axis with directionality denoting the direction of the enrichment. (D) Representative images of cultured tumor cells taken ex vivo for analyses for LC3 staining. Red arrows mark positive and yellow arrows mark negative cells. (E) Comparison of average percentages of cells staining positive for LC3 in K versus KM cells. P-value calculated using Student's t-test. (F) Comparison of LC3 staining intensities in positive staining cells between K and KM cells. P-value calculated using a linear mixed model ANOVA for the effect of genotype on observed staining intensity. At least 18 cells per tumor were used.

References

    1. Alexandrov LB, Nik-Zainal S, Wedge DC, Aparicio SA, Behjati S, Biankin AV, Bignell GR, Bolli N, Borg A, Borresen-Dale AL, et al. 2013. Signatures of mutational processes in human cancer. Nature 500: 415–421. - PMC - PubMed
    1. Bakhoum SF, Silkworth WT, Nardi IK, Nicholson JM, Compton DA, Cimini D. 2014. The mitotic origin of chromosomal instability. Curr Biol 24: R148–R149. - PMC - PubMed
    1. Barboza JA, Liu G, Ju Z, El-Naggar AK, Lozano G. 2006. p21 delays tumor onset by preservation of chromosomal stability. Proc Natl Acad Sci 103: 19842–19847. - PMC - PubMed
    1. Bieda M, Xu X, Singer MA, Green R, Farnham PJ. 2006. Unbiased location analysis of E2F1-binding sites suggests a widespread role for E2F1 in the human genome. Genome Res 16: 595–605. - PMC - PubMed
    1. Birkbak NJ, Eklund AC, Li Q, McClelland SE, Endesfelder D, Tan P, Tan IB, Richardson AL, Szallasi Z, Swanton C. 2011. Paradoxical relationship between chromosomal instability and survival outcome in cancer. Cancer Res 71: 3447–3452. - PMC - PubMed

Publication types

Substances

LinkOut - more resources