Meta-Analysis
. 2017 Apr 4;114(14):3714-3719.
doi: 10.1073/pnas.1618569114. Epub 2017 Mar 20.

Meta-assessment of bias in science

Affiliations
Meta-Analysis

Meta-assessment of bias in science

Daniele Fanelli et al. Proc Natl Acad Sci U S A. .

Abstract

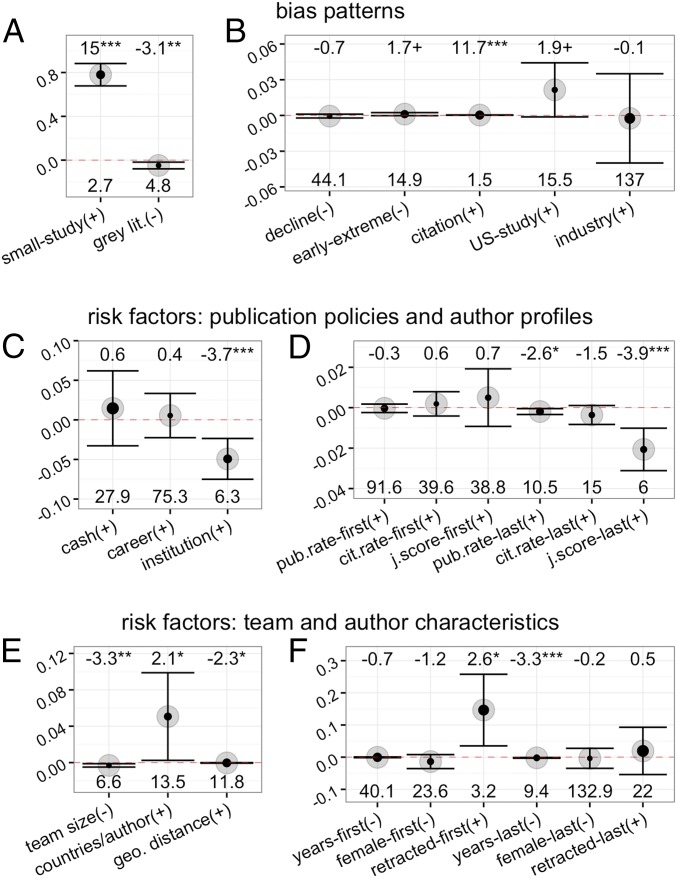
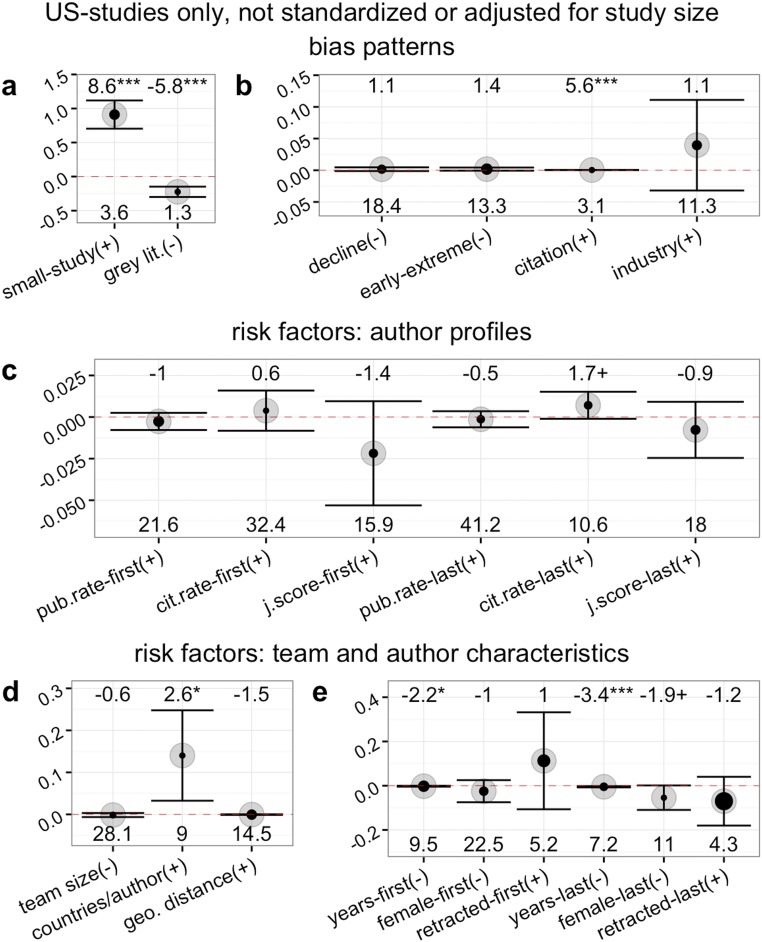
Numerous biases are believed to affect the scientific literature, but their actual prevalence across disciplines is unknown. To gain a comprehensive picture of the potential imprint of bias in science, we probed for the most commonly postulated bias-related patterns and risk factors, in a large random sample of meta-analyses taken from all disciplines. The magnitude of these biases varied widely across fields and was overall relatively small. However, we consistently observed a significant risk of small, early, and highly cited studies to overestimate effects and of studies not published in peer-reviewed journals to underestimate them. We also found at least partial confirmation of previous evidence suggesting that US studies and early studies might report more extreme effects, although these effects were smaller and more heterogeneously distributed across meta-analyses and disciplines. Authors publishing at high rates and receiving many citations were, overall, not at greater risk of bias. However, effect sizes were likely to be overestimated by early-career researchers, those working in small or long-distance collaborations, and those responsible for scientific misconduct, supporting hypotheses that connect bias to situational factors, lack of mutual control, and individual integrity. Some of these patterns and risk factors might have modestly increased in intensity over time, particularly in the social sciences. Our findings suggest that, besides one being routinely cautious that published small, highly-cited, and earlier studies may yield inflated results, the feasibility and costs of interventions to attenuate biases in the literature might need to be discussed on a discipline-specific and topic-specific basis.

Keywords: bias; integrity; meta-analysis; meta-research; misconduct.


Conflict of interest statement

The authors declare no conflict of interest.

Figures

Fig. S1.
Fig. S1.
Flow diagram illustrating the stages of selection of meta-analyses to include in the study. Electronic search in the Web of Science yielded an initial list of potentially relevant titles. From this list 30,225 titles were actually screened and, in successive phases of selection, a total of 14,885 titles were identified for potential inclusion. A total of 10,485 studies were eventually excluded for failing to meet one or more of the criteria, whereas 1,457 were deemed of unclear status. Of the latter, 187 were identified too late in the process to be included, whereas multiple attempts were made to contact the authors of the 1,270 previously identified studies. The authors of 516 of these studies responded, and communications with them led to discarding 417 studies, which either did not meet our inclusion criteria or had unretrievable data. Therefore, 99 meta-analyses could be included, bringing our final sample to a total of 3,042 distinct meta-analyses. Meta-analyses in the multidisciplinary category (MU) were reclassified by hand.
Fig. 1.
Fig. 1.
(A–F) Meta-meta–regression estimates of bias patterns and bias risk factors, adjusted for study precision. Each panel shows second-order random-effects meta-analytical summaries of meta-regression estimates [i.e., b ± 95% confidence interval (CI)], measured across the sample of meta-analyses. Symbols in parentheses indicate whether the association between factor and effect size is predicted to be positive (+) or negative (−). The gray area within each circle is proportional to the percentage of total variance explained by between–meta-analysis variance (i.e., heterogeneity, measured by I2). To help visualize effect sizes and statistical significance, numbers above error bars display t scores (i.e., summary effect size divided by its corresponding SE, b/SE) and conventional significance levels (i.e., +P < 0.1, *P < 0.05, **P < 0.01, ***P < 0.001). Numbers below each error bar reflect the cross–meta-analytical consistency of effects, measured as the ratio of between–meta-analysis SD divided by summary effect size (i.e., τ/b; the smaller the ratio, the higher the consistency). A few of the tested variables were omitted from D for brevity (full numerical results for all variables are in Dataset S2). See main text and Table 1 for details of each variable.
Fig. S2.
Fig. S2.
Histograms of meta-regression coefficients measured for each bias pattern and risk factor tested in the study. Symbols in parentheses indicate whether the association between factor and effect size is predictive to be positive (+) or negative (−). Numbers in parentheses indicate the number of meta-analyses that could be used in the analysis (i.e., in which the corresponding independent variable had nonzero variance). Histograms are centered on zero, marked by a vertical red bar.
Fig. 2.
Fig. 2.
Bias patterns partitioned by disciplinary domain. Each panel reports the second-order random-effects meta-analytical summaries of meta-regression estimates (b ± 95% CI) measured across the sample of meta-analyses. Symbols in parentheses indicate whether the association between factor and effect size is predicted to be positive (+) or negative (−). The gray area within each circle is proportional to the percentage of total variance explained by between–meta-analysis variance (i.e., heterogeneity, measured by I2). To help visualize effect sizes and statistical significance, numbers above error bars display t scores (i.e., summary effect size divided by its corresponding SE, b/SE) and conventional significance levels (i.e., +P < 0.1, *P < 0.05, **P < 0.01, ***P < 0.001). Numbers below each error bar reflect the cross–meta-analytical consistency of effects, measured as the ratio of between–meta-analysis SD divided by summary effect size (i.e., τ/b; the smaller the ratio is, the higher the consistency). The sample was partitioned between meta-analyses from journals classified based on discipline indicated in Thompson Reuters’ Essential Science Indicators database. Using abbreviations described in Methods, discipline classification is the following: physical sciences (P), MA, PH, CH, GE, EN, CS; social sciences (S), EB, PP, SO; and biological sciences (B), all other disciplines. See main text and Table 1 for further details.
Fig. S3.
Fig. S3.
Bias patterns and bias risk factors tested in our study, partitioned by discipline (see Methods for details). Each panel reports the second-order random-effects meta-analytical summaries of meta-regression estimates (b ± 95% CI) measured across the sample of meta-analyses. The shaded portion of the area of each circle is proportional to the percentage of total variance that is explained by between–meta-analysis variance (i.e., heterogeneity, measured by I2, all numerical results available as Supporting Information). Symbols in parentheses indicate whether the association between factor and effect size is predictive to be positive (+) or negative (−). Percentages above each panel report between-discipline heterogeneity. Meta-analyses in the “multidisciplinary” category were reclassified by hand in one of the other disciplines, and those from the physical sciences disciplines, being few in number, were combined in one category. Abbreviations are defined in Methods in the main text. CEGM, Chemistry + Engineering + Geosciences + Mathematics. To help visualize effects, numbers on the right of error bars display t scores and statistical significance levels (i.e., °P < 0.1, *P < 0.05, **P < 0.01, ***P < 0.001). Numbers on the left of each error bar reflect the cross–meta-analytical consistency of effects, measured as the ratio of between–meta-analysis variance divided by summary effect size (i.e., τ2/b; the smaller the ratio is, the higher the consistency).
Fig. S4.
Fig. S4.
Bias risk factors tested in our study, partitioned by disciplinary domain. Each panel reports the second-order random-effects meta-analytical summaries of meta-regression estimates (b ± 95% CI) measured across the sample of meta-analyses. Symbols in parentheses indicate whether the association between factor and effect size is predictive to be positive (+) or negative (−). The transparent portion of the area of each circle is proportional to the percentage of total variance that is explained by between–meta-analysis variance (i.e., heterogeneity, measured by I2, all numerical results available as Supporting Information). The sample was partitioned between meta-analyses from journals in the physical (P), biological (B), and social (S) sciences, as classified by Thompson Reuters’ Essential Science Indicators database. To help visualize effects, numbers above error bars display t scores and statistical significance levels (i.e., °P < 0.1, *P < 0.05, **P < 0.01, ***P < 0.001). Numbers below each error bar reflect the cross–meta-analytical consistency of effects, measured as the ratio of between–meta-analysis variance divided by summary effect size (i.e., τ2/b; the smaller the ratio is, the higher the consistency). Using abbreviations described in Methods, discipline classification is the following: physical sciences (P), MA, PH, CH, GE, EN, CS ; social sciences (S), EB, PP, SO; and biological sciences (B), all other disciplines.
Fig. S5.
Fig. S5.
Estimate of changes over time of three of the bias patterns tested (all numerical results are in Dataset S4). Circles in each panel are meta-regression estimates plotted by year of the corresponding meta-analysis. Regression lines and values in red were produced by a second-order mixed-effects meta-regression. Symbols in parentheses indicate whether the association between factor and effect size is predictive to be positive (+) or negative (−). See main text and Table 1 for further details. To help visualize trends, asterisks display conventional statistical significance levels (i.e., +P < 0.1, *P < 0.05, **P < 0.01, ***P < 0.001). Using abbreviations described in Methods, discipline classification is the following: physical sciences (P), MA, PH, CH, GE, EN, CS; social sciences (S), EB, PP, SO; and biological sciences (B), all other disciplines.
Fig. S6.
Fig. S6.
Meta-meta–regression estimates of bias patterns and bias risk factors, not adjusted for study precision, limited to US studies. (AE) The figure reports exactly the same analysis as reported in Fig. 1, with the exception of B, from which the test of the US effect, which does not apply to this sub-analysis, was removed. Details of each analysis and panel are equivalent to those reported in the main text. Each panel plots the second-order random-effects meta-analytical summaries of standardized meta-regression estimates (i.e., beta ± 95% CI), measured across the sample of meta-analyses. Symbols in parentheses indicate whether the association between factor and effect size is predictive to be positive (+) or negative (−). The gray area within each circle is proportional to the percentage of total variance explained by between–meta-analysis variance (i.e., heterogeneity, measured by I2). To help visualize effect sizes and statistical significance, numbers above error bars display t scores (i.e., summary effect size divided by its corresponding SE, b/SE) and conventional significance levels (i.e., +P < 0.1, *P < 0.05, **P < 0.01, ***P < 0.001). Numbers below each error bar reflect the cross–meta-analytical consistency of effects, measured as the ratio of between–meta-analysis SD divided by summary effect size (i.e., τ/b; the smaller the ratio is, the higher the consistency). A few of the tested variables were omitted from D for brevity (full numerical results for all variables are in Dataset S2). See main text and Table 1 for details of each variable.

References

    1. Song F, et al. Dissemination and publication of research findings: An updated review of related biases. Health Technol Assess. 2010;14(8):iii, ix–xi, 1–193. - PubMed
    1. Chavalarias D, Ioannidis JPA. Science mapping analysis characterizes 235 biases in biomedical research. J Clin Epidemiol. 2010;63(11):1205–1215. - PubMed
    1. Young NS, Ioannidis JPA, Al-Ubaydli O. Why current publication practices may distort science. PLoS Med. 2008;5(10):e201. - PMC - PubMed
    1. Dwan K, et al. Systematic review of the empirical evidence of study publication bias and outcome reporting bias. PLoS One. 2008;3(8):e3081. - PMC - PubMed
    1. Fanelli D. “Positive” results increase down the Hierarchy of the Sciences. PLoS One. 2010;5(4):e10068. - PMC - PubMed

Publication types

LinkOut - more resources