. 2017 Apr 4;114(14):3572-3577.
doi: 10.1073/pnas.1620400114. Epub 2017 Mar 20.

Prion protein dynamics before aggregation

Affiliations

Prion protein dynamics before aggregation

Kinshuk Raj Srivastava et al. Proc Natl Acad Sci U S A. .

Abstract

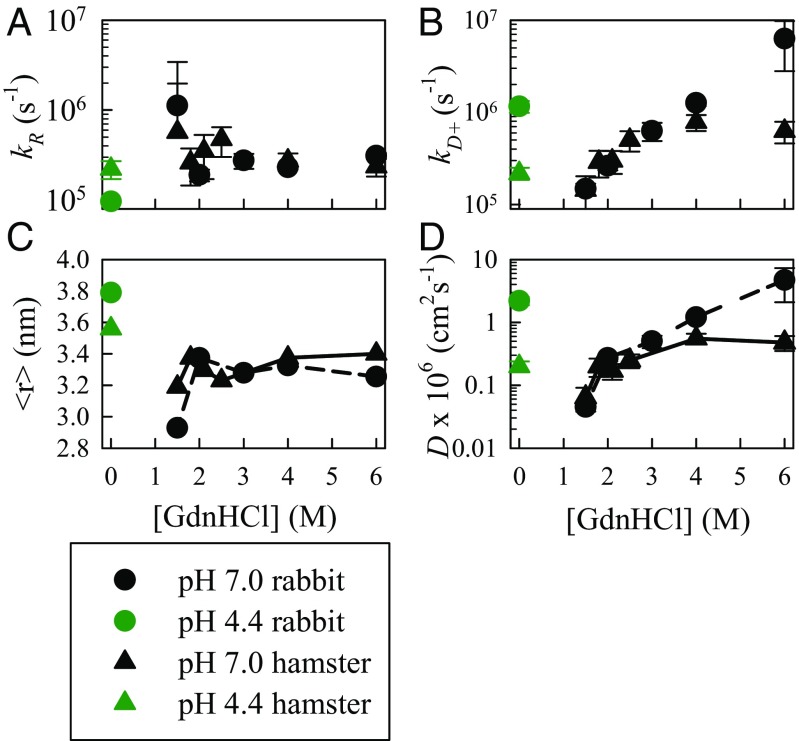
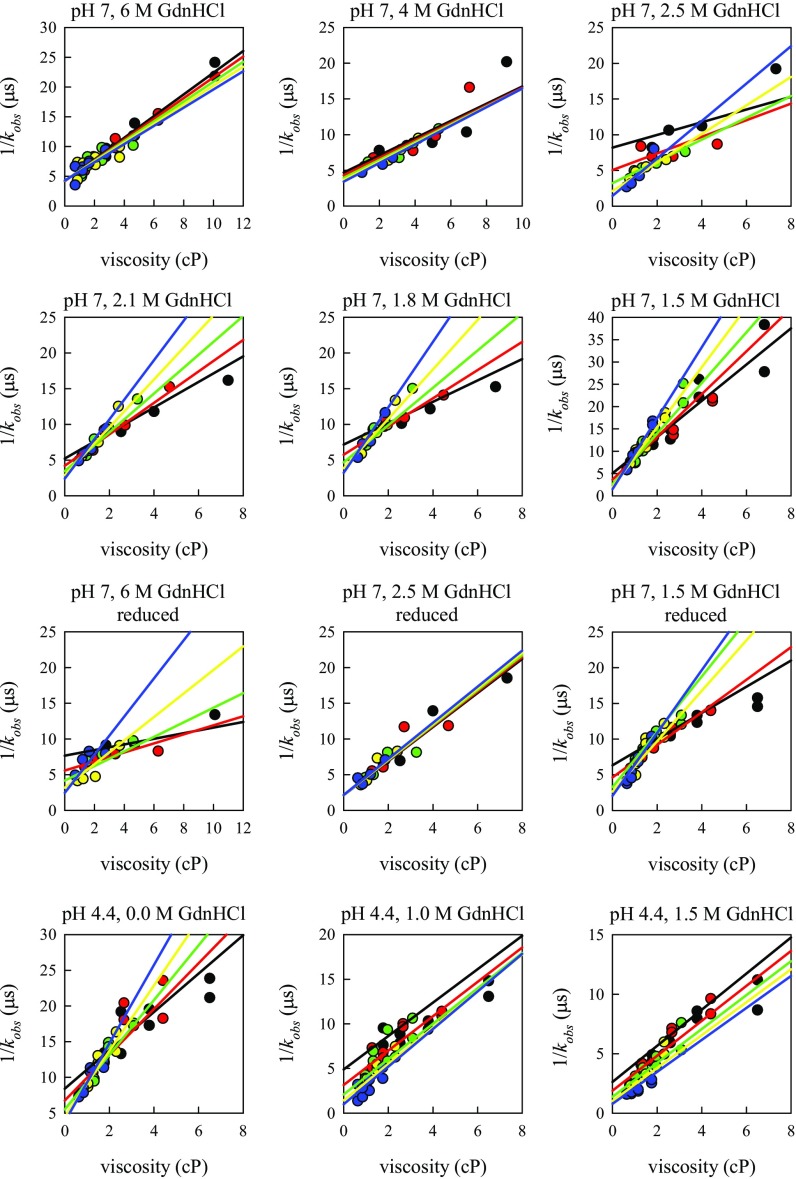
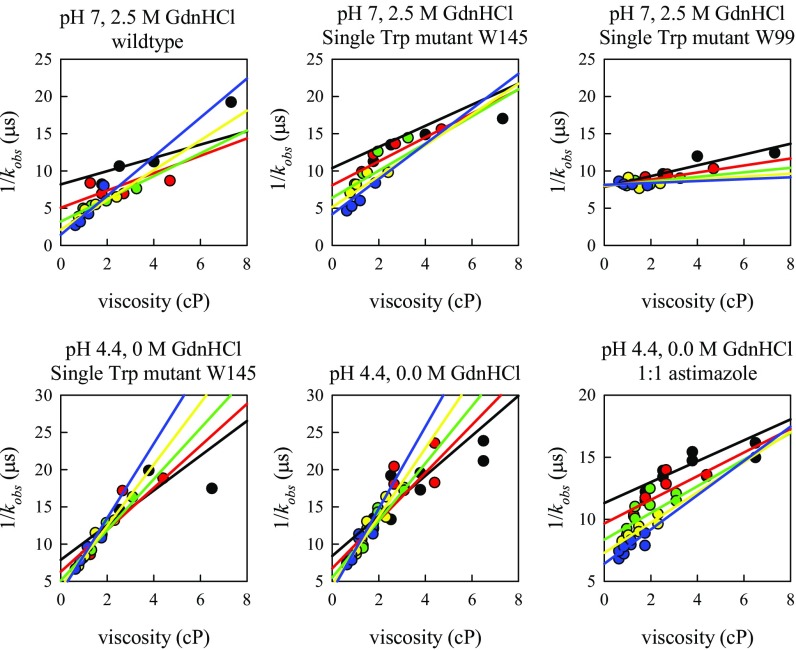
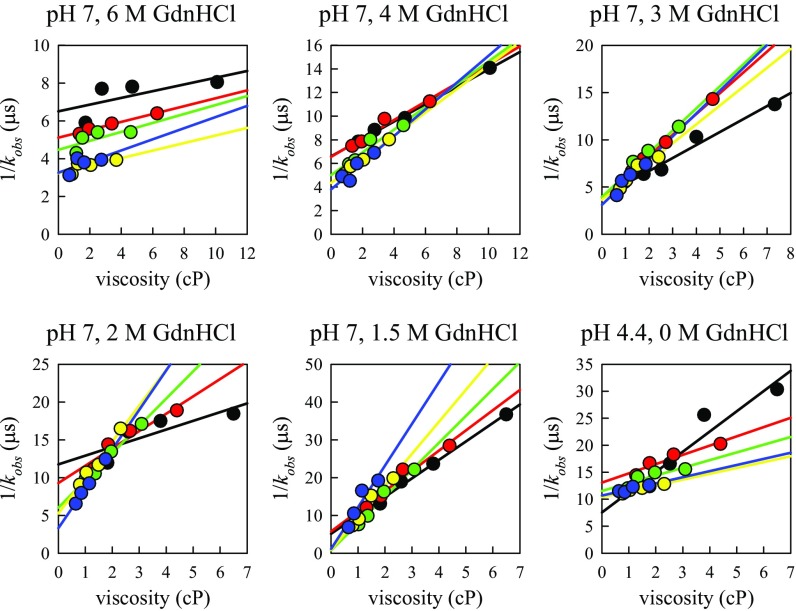
Prion diseases, like Alzheimer's disease and Parkinson disease, are rapidly progressive neurodegenerative disorders caused by misfolding followed by aggregation and accumulation of protein deposits in neuronal cells. Here we measure intramolecular polypeptide backbone reconfiguration as a way to understand the molecular basis of prion aggregation. Our hypothesis is that when reconfiguration is either much faster or much slower than bimolecular diffusion, biomolecular association is not stable, but as the reconfiguration rate becomes similar to the rate of biomolecular diffusion, the association is more stable and subsequent aggregation is faster. Using the technique of Trp-Cys contact quenching, we investigate the effects of various conditions on reconfiguration dynamics of the Syrian hamster and rabbit prion proteins. This protein exhibits behavior in all three reconfiguration regimes. We conclude that the hamster prion is prone to aggregation at pH 4.4 because its reconfiguration rate is slow enough to expose hydrophobic residues on the same time scale that bimolecular association occurs, whereas the rabbit sequence avoids aggregation by reconfiguring 10 times faster than the hamster sequence.

Keywords: astemizole; intramolecular diffusion; prion disease; protein aggregation; protein folding.


Conflict of interest statement

The authors declare no conflict of interest.

Figures

Fig. 1.
Fig. 1.
Cartoon representation of hamster prion protein structure (Protein Data Bank ID 2PRP).
Fig. 2.
Fig. 2.
Measurement of intramolecular diffusion. (A) Schematic of Trp–Cys quenching in the prion. The white ball (Trp) is excited to a long-lived triplet state (green) by a pulse of UV light and probed by transient absorption of blue light. The protein undergoes intramolecular diffusion between the Trp and Cys–Cys disulfide bond (blue balls) until the Cys–Cys quenches the Trp upon close contact and it returns to the ground state (white ball). (B) Typical kinetics of the Trp triplet state at pH 7, 1.5 M GdnHCl, 10 °C as probed by absorption of light at 450 nm. The red line is the fit to three exponentials. The fastest decay represents the Trp triplet lifetime due to quenching in the unfolded state, the medium rate represents the Trp triplet lifetime in the absence of quenching in the folded state, and the slowest decay is due to photophysical effects. (C) The fractional unfolded population vs. [GdnHCl]. The fraction is calculated as AFast/(AFast + Amed), where AFast and Amed are the amplitudes of the fast and medium decays, as shown in B. The black symbols were measured at 30 μM, and the white symbols were measured at 15 μM.
Fig. S1.
Fig. S1.
(A)Total ANS fluorescence vs. time of prion at two different solution conditions as marked. (B) Fractional amplitude of medium phase compared with the total amplitude of the Trp triplet state vs. time in 3 M urea, pH 4, 150 mM NaCl, and T = 30 °C.
Fig. 3.
Fig. 3.
Trp–Cys quenching rates of hamster prion measured under various solvent conditions at 30 °C. (A) Measured reaction-limited rates. (B) Measured diffusion-limited rates. The error bars in A and B were determined as discussed in SI Text. Circles represent the wild-type sequence and diamonds represent the Trp145 mutant. (C) Average Trp–Cys distance, <r>=rZ(r)dr/Z(r)dr, calculated from the energy reweighted WLC model for various conditions that best fit the measured reaction-limited rates using Eq. S7. (D) Effective intramolecular diffusion coefficients determined from Eq. S8.
Fig. 4.
Fig. 4.
Trp–Cys quenching rates of rabbit (circles) and hamster (triangles) prions measured under various solvent conditions at 30 °C. (A) Measured reaction-limited rates. (B) Measured diffusion-limited rates. (C) Average Trp–Cys distance calculated from the energy reweighted WLC model for various conditions that best fit the measured reaction-limited rates using Eq. S7. (D) Effective intramolecular diffusion coefficients determined from Eq. S8.
Fig. S2.
Fig. S2.
Plots of observed decay times of hamster prion versus viscosity at different temperatures for all of the conditions shown in Fig. 3. The lines are the fits to the model in Eqs. S1 and S2. Black circles, T = 0° C; red circles, T = 10° C; green circles, T = 20° C; yellow circles, T = 30° C; blue circles, T = 40° C.
Fig. S3.
Fig. S3.
Comparison of Trp–Cys measurements of the hamster wt and single Trp mutants. Black circles, T = 0° C; red circles, T = 10° C; green circles, T = 20° C; yellow circles, T = 30° C; blue circles, T = 40° C.
Fig. S4.
Fig. S4.
Plots of observed decay times of rabbit prion versus viscosity at different temperatures for all of the conditions shown in Fig. 3. The lines are the fits to independent linear fits at each temperature. Black circles, T = 0° C; red circles, T =10° C; green circles, T = 20° C; yellow circles, T = 30° C; blue circles, T = 40° C.
Fig. S5.
Fig. S5.
CD spectra of the wt, W33Y, and W79Y sequences at pH 7, 25 °C.
Fig. 5.
Fig. 5.
Modeling of the unfolded ensemble and resulting aggregation. (A) Probability distributions calculated from the energy reweighted wormlike chain model for two solvent conditions. (B) Reweighted energies for various values of γ and σ as marked. The change in energy ΔETOT is calculated as the difference between the energies at 7 and 1 nm. (C) Calculated oligomer (O) formation rates using Scheme 3 for rates representing pH 7, 1.5 M GdnHCl (green); pH 4.4, 0 M GdnHCl (red); pH 4.4, 0 M GdnHCl, 1:1 astemizole (blue); and pH 4.4, 1.5 M GdnHCl (cyan). The starting conditions were determined by the equilibrium K = [M*]/[M] and all other species had zero concentration.

References

    1. Liemann S, Glockshuber R. Transmissible spongiform encephalopathies. Biochem Biophys Res Commun. 1998;250(2):187–193. - PubMed
    1. Prusiner SB. Novel proteinaceous infectious particles cause scrapie. Science. 1982;216(4542):136–144. - PubMed
    1. Prusiner SB. Prions. Proc Natl Acad Sci USA. 1998;95(23):13363–13383. - PMC - PubMed
    1. Cohen FE, et al. Structural clues to prion replication. Science. 1994;264(5158):530–531. - PubMed
    1. Horwich AL, Weissman JS. Deadly conformations--protein misfolding in prion disease. Cell. 1997;89(4):499–510. - PubMed

Publication types

LinkOut - more resources