. 2017 Apr 4;114(14):E2816-E2825.
doi: 10.1073/pnas.1617777114. Epub 2017 Mar 20.

Recurrent rewiring and emergence of RNA regulatory networks

Affiliations

Recurrent rewiring and emergence of RNA regulatory networks

Daniel Wilinski et al. Proc Natl Acad Sci U S A. .

Abstract

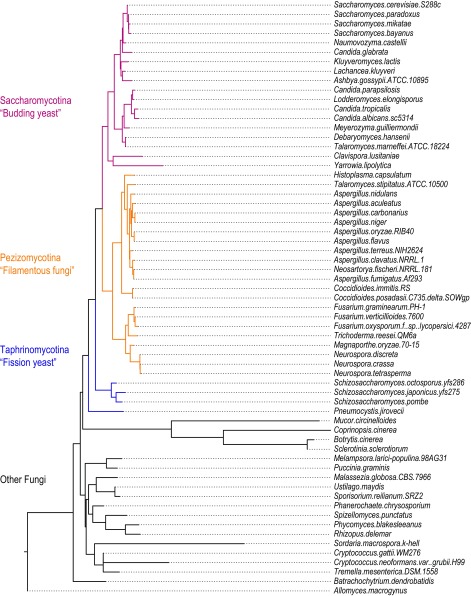
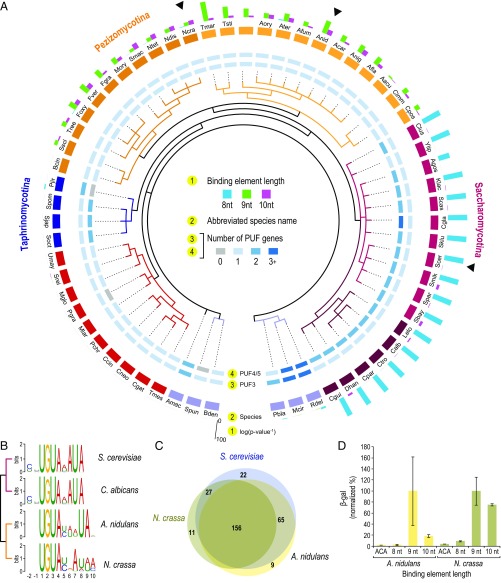
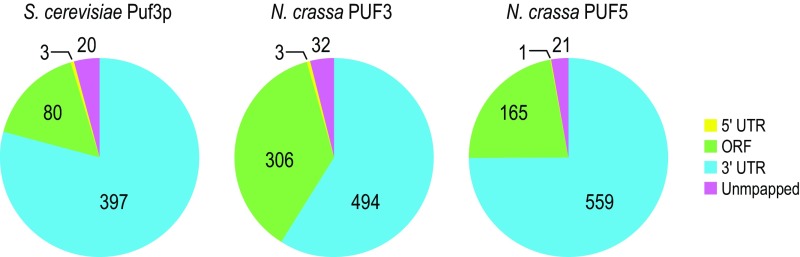
Alterations in regulatory networks contribute to evolutionary change. Transcriptional networks are reconfigured by changes in the binding specificity of transcription factors and their cognate sites. The evolution of RNA-protein regulatory networks is far less understood. The PUF (Pumilio and FBF) family of RNA regulatory proteins controls the translation, stability, and movements of hundreds of mRNAs in a single species. We probe the evolution of PUF-RNA networks by direct identification of the mRNAs bound to PUF proteins in budding and filamentous fungi and by computational analyses of orthologous RNAs from 62 fungal species. Our findings reveal that PUF proteins gain and lose mRNAs with related and emergent biological functions during evolution. We demonstrate at least two independent rewiring events for PUF3 orthologs, independent but convergent evolution of PUF4/5 binding specificity and the rewiring of the PUF4/5 regulons in different fungal lineages. These findings demonstrate plasticity in RNA regulatory networks and suggest ways in which their rewiring occurs.

Keywords: 3′UTR elements; PUF proteins; RNA regulation; evolution.


Conflict of interest statement

The authors declare no conflict of interest.

Figures

Fig. 1.
Fig. 1.
Conservation of putative PUF binding elements in Asycomocota fungi. (A) Phylogenetic tree of selected fungi (see full tree in Fig. S1). Colored branches represent each subphylum. Pink, Saccharomycotina (budding yeasts); orange, Pezizomycontina (filamentous fungi); blue, Taphrinomycontina (fission yeast), black, other fungi. (B) Representation of 8-, 9-, and 10-nt PWM models used to parameterize the log-likelihood function. Height of base represents probability of a base at each position in the binding element. (C–E) k-means clustering of orthologous transcripts based on log-likelihood scores for putative PUF binding elements in 3′UTRs for species in A, as shown in the key. Each row plots the log-likelihood PWM-match scores for an orthologous 3′UTR, and each column represents a species (with the phylogenetic tree shown above). Clustering was done independently for each heat map. Only clusters with a GO term P value lower than E-9 were highlighted (except cluster 2). Shown are the log-likelihood scores based on the 8-nt binding elements (C) found in one or more of 4425 orthologous transcripts. (D) The 9-nt binding elements found in 4,898 transcripts. (E) The 10-nt binding elements found in 4,423 transcripts.
Fig. S1.
Fig. S1.
Phylogenic tree for 62 species of fungi. Maximum likelihood tree was constructed using ribosomal RNA sequences (58).
Fig. 2.
Fig. 2.
Evolution of PUF–mitochondrial RNA network. (A) Enrichment of PUF binding elements in transcripts from the mitochondrial cluster across Ascomycota fungi. Abbreviations used for fungal species are provided in Fig. S5. Ring 1 represents binding element enrichment orthologs in each species. The inner ring is the phylogenic species tree. Black arrows mark the species used in C. (B) MEME-derived PWMs identified in 3′UTRs of mitochondrial cluster transcripts in each species. (C) Overlap of genes in mitochondrial cluster containing a putative PUF binding element for three species. (D) Relative luminescence values as a proxy for binding affinity for each PUF protein binding to each PUF site as assayed by yeast-three hybrid assays (48).
Fig. S5.
Fig. S5.
Abbreviations used for fungal species. Full species names were abbreviated as shown in Fig. 2.
Fig. S2.
Fig. S2.
Phylogenic tree of PUF proteins. Maximum likelihood tree was constructed using all proteins predicted to contain a Pumilo binding domain (45).
Fig. 3.
Fig. 3.
HITS-CLIP data. (A–C) Reproducibility of biological replicates. Height of CLIP peaks were log-transformed and then plotted on each axis. Data were colored based on the precipitated protein (Sc_PUF3, blue; Nc_PUF3, red; Nc_PUF4/5, green). Spearman’s correlation coefficients (ρ), associated P values (P), and Pearson’s correlation coefficient (r) are indicated in A (ρ = 0.69, 0.84, 0.64; P = 0, 0, 0; r = 0.77, 0.96, 0.81; n = 500), B (ρ = 0.64, 0.85, 0.76; P = 0, 0, 0; r = 0.99, 0.99, 0.99; n = 835), and C (ρ = 0.85, 0.92, 0.79; P = 0, 0, 0; r = 0.71, 0.97, 0.67; n = 746). (D–G) Examples of binding peaks (read depth) for COX17, a canonical target of Sc_PUF3. YLL009C (COX17), NCU0058 (al-2), and NCU02530 (cox17) are depicted, with ORFs annotated in blue and the likely binding elements displayed beneath. (H) Overlapping CLIP targets for each protein. Only genes with orthologs in S. cerevisiae and N. crassa are included. RPM, reads per million mapped reads.
Fig. S3.
Fig. S3.
Distribution of peaks in RNAs. Shown are mRNA regions where peaks are found for Sc_PUF3, Nc_PUF3, and Nc_PUF4/5. Sc_PUF5 from previous study was included for comparison (30).
Fig. S4.
Fig. S4.
Example HITS-CLIP peaks. Shown are five example HITS-CLIP peaks from each PUF protein. (A) Sc_PUF3, (B) Nc_PUF3, and (C) Nc_PUF4/5. Each line represents a separate biological replicate. Likely PUF binding element found in each peak is below the gene cartoon.
Fig. 4.
Fig. 4.
In vivo binding elements of PUF proteins. MEME-derived PWMs from CLIP data. (A) S. cerevisiae PUF3, (B) N. crassa PUF3, (C) S. cerevisiae PUF5 (30), (D) N. crassa PUF4/5. (D) The previously defined Par-CLIP of Homo sapiens PUF3 ortholog, PUM2, defined by PhyloGibbs (52, 59). (E) Deconvolution of Nc_PUF4/5 composite binding element (D) into binding elements of 9 nt and 10 nt in length. (F) Mitochondrion GO term enrichment for all mRNAs targets of each PUF protein. (G) Venn diagram depicting the overlap between PUF targets from the mitochondrial cluster. (H) Nc_PUF3 and Nc_PUF4/5 interaction peaks identify separate binding elements for each PUF protein. One biological replicate for Nc_PUF3 and Nc_PUF4/5 are plotted in red and brown, respectively. Likely PUF binding elements are highlighted. RPM, reads per million mapped reads.
Fig. 5.
Fig. 5.
Evolution of PUF elements in PUF-bound transcripts. (AE) k-means clusters. Orthologs of transcripts bound by Sc_PUF3, Sc_PUF4 (14), Nc_PUF3, or Nc_PUF4/5 were aligned and clustered based on the log-likelihood match of 3′UTR sequences to the 8-nt, 9-nt, and 10-nt PUF PWMs (Materials and Methods). Gray indicates a lack of ortholog in that species. Targets bound by each protein are annotated by colored bars to the left of the figure. Enriched GO terms for each cluster are shown to the right (S. cerevisiae in black and N. crassa in tan).
Fig. 6.
Fig. 6.
Functional relatedness of all mRNAs bound by PUF3 and PUF4/5 proteins of S. cerevisiae and N. crassa. All orthologous targets of PUF proteins defined by CLIP are plotted as nodes (gray balls). Edges (lines) link the PUF to the RNAs it binds. Targets are colored based on their annotated function: (A) mitochondria (purple), (B) ribosome (red), (C) hydrolase (black), and (D) light responsive (blue).
Fig. 7.
Fig. 7.
Evolutionary model of PUF network rewiring. Colored boxes represent orthologous sets of mRNA targets. Solid arrows indicate PUF binding of the denoted binding element enriched in the target mRNA UTRs; dashed arrows represent weak binding or secondary modes of regulation (Discussion for details). Dashed colored boxes represent the acquisition or loss of transcripts from the denoted regulon. Mt, mitochondrial; Ribo, ribosomal.

Comment in

References

    1. Doniger SW, Fay JC. Frequent gain and loss of functional transcription factor binding sites. PLOS Comput Biol. 2007;3(5):e99. - PMC - PubMed
    1. Wohlbach DJ, Thompson DA, Gasch AP, Regev A. From elements to modules: Regulatory evolution in Ascomycota fungi. Curr Opin Genet Dev. 2009;19(6):571–578. - PMC - PubMed
    1. Villar D, Flicek P, Odom DT. Evolution of transcription factor binding in metazoans—Mechanisms and functional implications. Nat Rev Genet. 2014;15(4):221–233. - PMC - PubMed
    1. Whiteway M, Tebung WA, Choudhury BI, Rodríguez-Ortiz R. Metabolic regulation in model ascomycetes--Adjusting similar genomes to different lifestyles. Trends Genet. 2015;31(8):445–453. - PubMed
    1. Gasch AP, et al. Conservation and evolution of cis-regulatory systems in ascomycete fungi. PLoS Biol. 2004;2(12):e398. - PMC - PubMed

Publication types

MeSH terms

LinkOut - more resources