. 2017 Apr 6;544(7648):96-100.
doi: 10.1038/nature21726. Epub 2017 Mar 20.

Cerebellar granule cells encode the expectation of reward

Affiliations

Cerebellar granule cells encode the expectation of reward

Mark J Wagner et al. Nature. .

Abstract

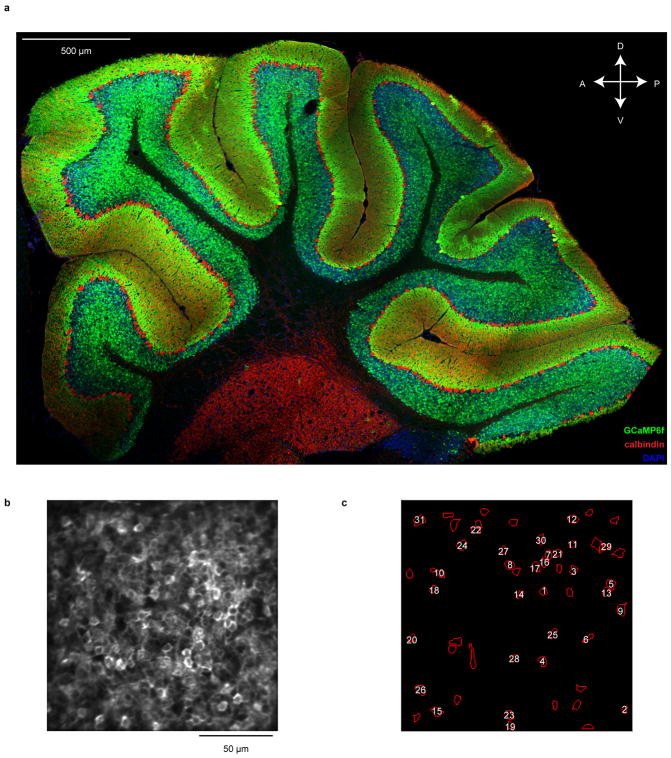
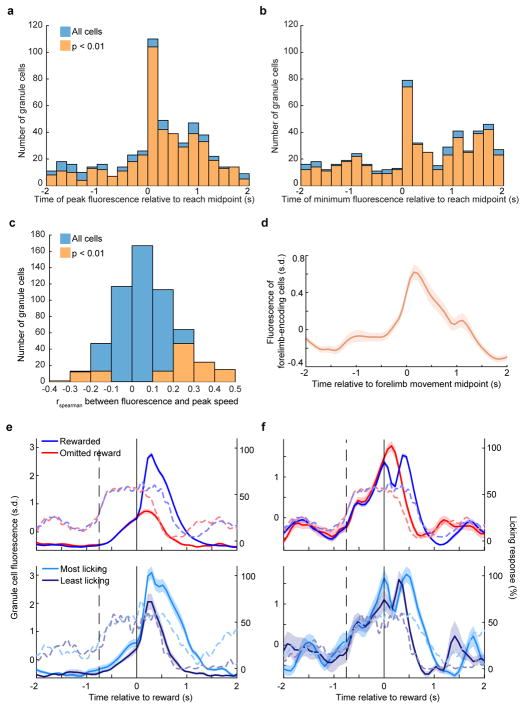
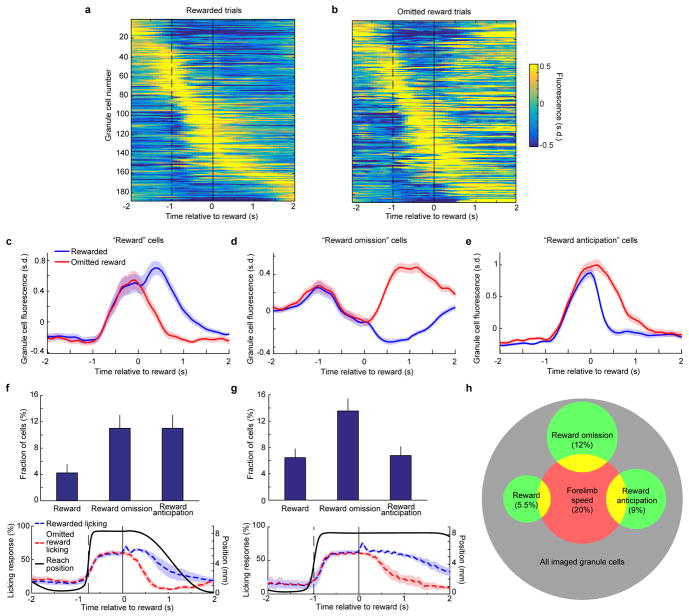
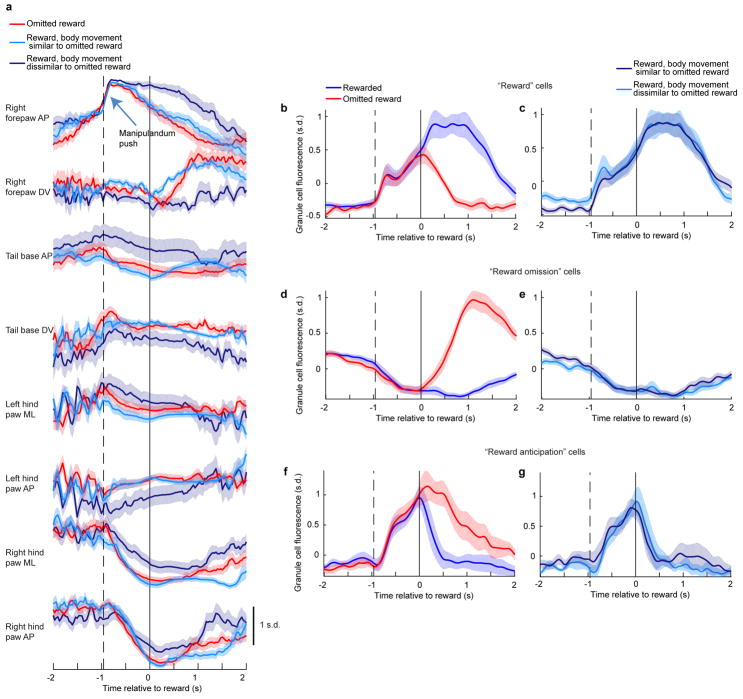
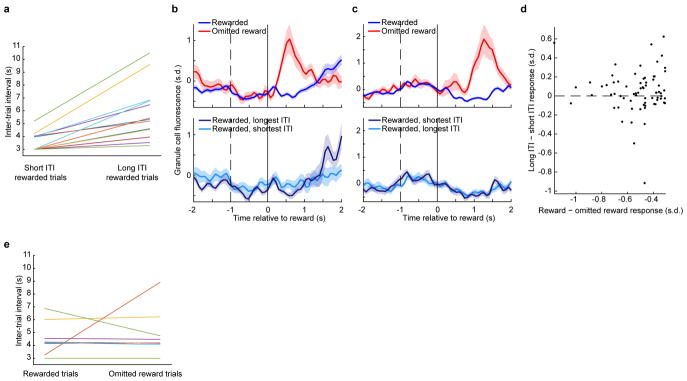
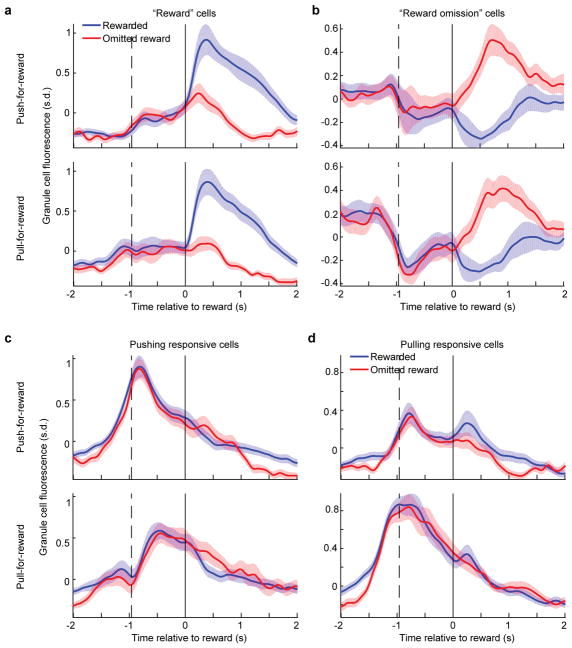
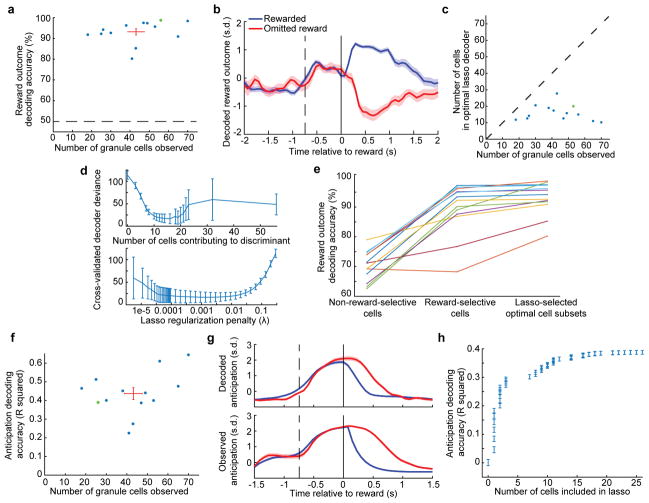
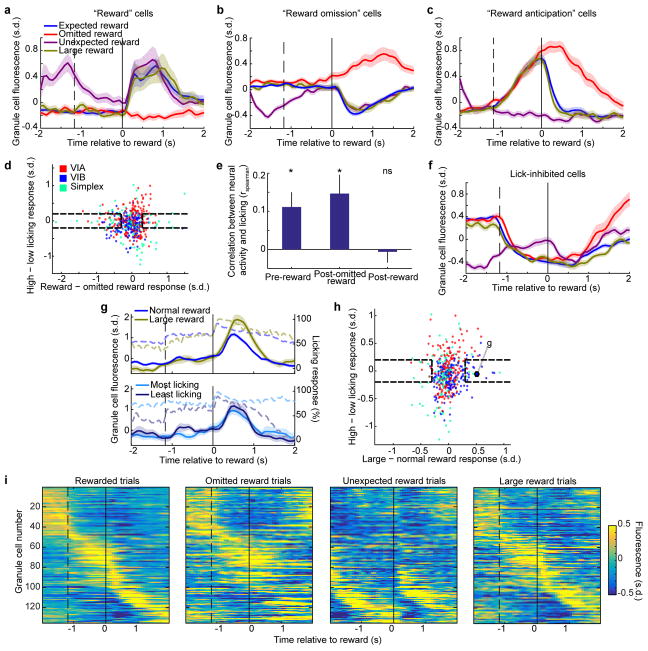
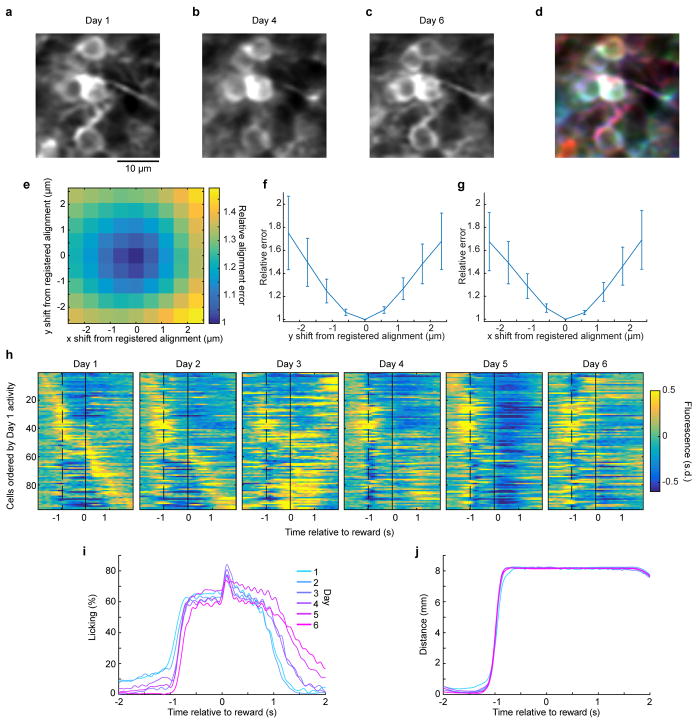
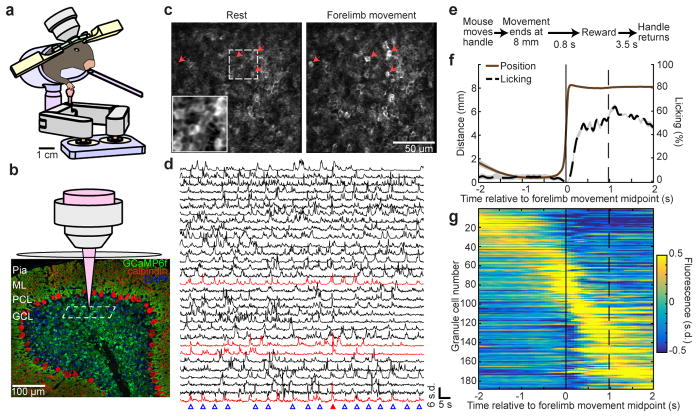
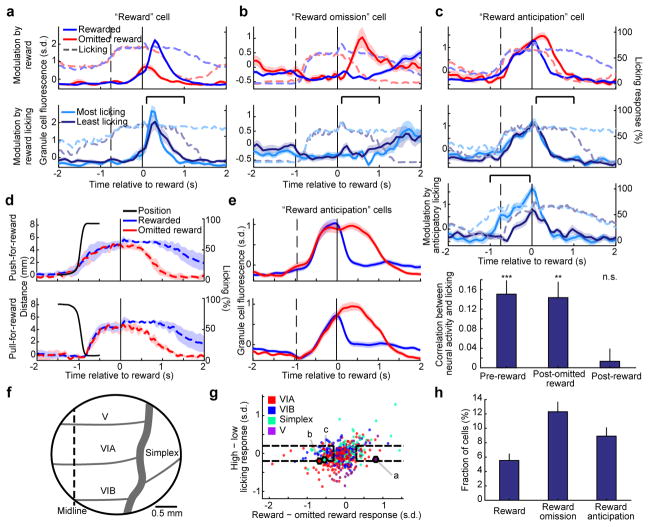
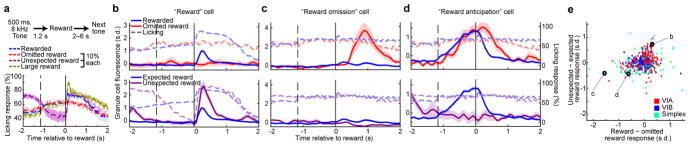
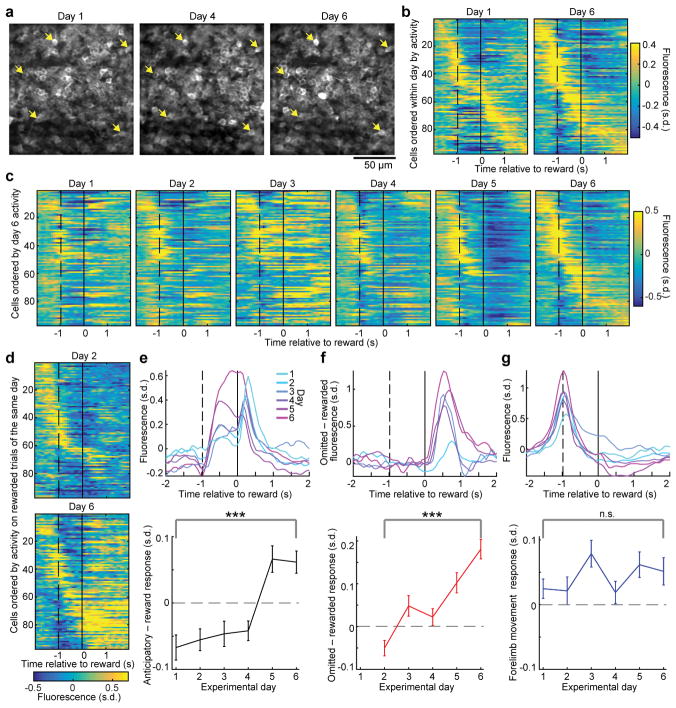
The human brain contains approximately 60 billion cerebellar granule cells, which outnumber all other brain neurons combined. Classical theories posit that a large, diverse population of granule cells allows for highly detailed representations of sensorimotor context, enabling downstream Purkinje cells to sense fine contextual changes. Although evidence suggests a role for the cerebellum in cognition, granule cells are known to encode only sensory and motor context. Here, using two-photon calcium imaging in behaving mice, we show that granule cells convey information about the expectation of reward. Mice initiated voluntary forelimb movements for delayed sugar-water reward. Some granule cells responded preferentially to reward or reward omission, whereas others selectively encoded reward anticipation. Reward responses were not restricted to forelimb movement, as a Pavlovian task evoked similar responses. Compared to predictable rewards, unexpected rewards elicited markedly different granule cell activity despite identical stimuli and licking responses. In both tasks, reward signals were widespread throughout multiple cerebellar lobules. Tracking the same granule cells over several days of learning revealed that cells with reward-anticipating responses emerged from those that responded at the start of learning to reward delivery, whereas reward-omission responses grew stronger as learning progressed. The discovery of predictive, non-sensorimotor encoding in granule cells is a major departure from the current understanding of these neurons and markedly enriches the contextual information available to postsynaptic Purkinje cells, with important implications for cognitive processing in the cerebellum.


Conflict of interest statement

Author Information

The authors declare no competing financial interests.

Figures

Extended Data Fig. 1
Extended Data Fig. 1. Ca2+ imaging in cerebellar granule cells
a, Parasagittal section of the cerebellum of a transgenic mouse (Math1-Cre / CAG-lox-stop-lox-tTA / TRE-lox-stop-lox-GCaMP6f) used for in vivo two-photon Ca2+ imaging. GCaMP6f expression (green) is widespread throughout most granule cells. GCaMP-expressing somas were not detected in the molecular layer, and only rarely coincided with Purkinje cells (red). For unknown reasons, granule cell expression is substantially reduced in lobules IX and X. A, anterior; P, posterior; D, dorsal; V, ventral. b, Mean two-photon fluorescence image for the session shown in Fig. 1c,d. c, Location of all identified active cerebellar granule cells in the field of view in b (n = 53 cells total). Numbered cells indicate the example cell traces shown in Fig. 1d, counting from the bottom to the top.
Extended Data Fig. 2
Extended Data Fig. 2. Granule cells encode movement in a forelimb movement operant task
a, b, Distribution of times of peak (a) or minimum (b) trial-averaged fluorescence response relative to reach midpoint (blue histograms, n = 561 total neurons from 6 mice). Orange histograms denote the subset of cells whose peak (a) or minimum (b) trial-averaged fluorescence modulation was significant. 85% of cells exhibited significant positive modulation, while 90% of cells exhibited significant negative modulation, at a point between −2 to 2 s relative to forelimb movement. To compute significance we compared observed peak and minimum fluorescence, to fluorescence for randomized datasets (Methods). c, For each cell we computed the Spearman correlation coefficient between single-trial fluorescence (mean from −0.1 to +0.3 s relative to movement midpoint) and peak movement velocity. Histogram denotes distribution of Spearman coefficients across neurons (n = 561 total neurons from 6 mice). Neurons correlated with p < 0.01 (permutation test) are shown in orange. d, Mean movement-aligned fluorescence of granule cells whose single-trial fluorescence correlated significantly with peak movement speed, shown in c (n = 111 neurons with p < 0.01 for correlation coefficients, shown in orange in c). e, f, Two example granule cells that encode licking. For these cells, response differences between reward outcomes (top row, examples) can be explained by the encoding of the licking response on rewarded trials (bottom row, 25 trials with the most and least licking from 0.1 to 1 s), n = 209 rewarded and 68 omitted reward trials. Dashed vertical lines denote average time of forelimb movement midpoint, solid vertical line denotes time of reward. In this and all subsequent figures, shaded regions denote s.e.m.
Extended Data Fig. 3
Extended Data Fig. 3. Granule cell reward responses during the operant task
a, b, Fluorescence response of all granule cells recorded from three experiments in lobules VIa, VIb, and simplex from one example mouse on rewarded trials and omitted reward trials. Each row shows the trial-averaged response of a single neuron. Dashed vertical line denotes the average forelimb movement midpoint; solid vertical line denotes time of reward delivery. Many more neurons appear to respond preferentially following omitted reward than reward delivery (n = 188 neurons). c–e, Average reward-aligned fluorescence of all reward-preferring cells (c), omitted reward-preferring cells (d), and reward anticipation cells (e), from all mice and lobules during forelimb movements (n = 31 reward cells, 69 reward omission cells, 50 reward anticipation cells from 13 forelimb movement sessions in 6 mice). See Methods for cell identification criteria. f, g, Comparison of the cohort of mice that performed the operant task with briefer delay periods (f, n = 6 experiments in 3 mice with delay between the end of forelimb movement and reward delivery = 0.6 s and delay between reward delivery and manipulandum handle return = 2 s), or longer delay periods (g, n = 7 experiments in 3 mice with reward delay = 0.8 s and post-reward delay = 3.5 s). Top, prevalence of reward response types as fraction of total neurons (error bars denote counting error). Bottom, average movement and licking behavior across mice on each task version. Results did not differ substantially between the two task versions and thus all data were pooled for all analyses aside from these figure panels. Across all mice, 50% of peak licking rise from baseline was reached in anticipation 0.8 ± 0.04 s before reward. Licking was prolonged following reward compared to omitted reward (p = 4×10⁻⁴ Wilcoxon rank sum test, n = 6 mice; licking declined to half of its anticipatory level by 1.4 ± 0.14 s following reward compared to 0.7 ± 0.08 s following omitted reward). h, Venn diagram illustrating multiplexed representations in granule cells. Relative areas are true to observed cell proportions. Corresponding counting errors for reward-related cell classifications are provided in Fig. 2h. For forelimb speed cells, counting error was 1.7%. The prevalence of multiple representations in a granule cell matched predictions of independent probabilities of each representation (1.1% of cells encode reward and forelimb speed, 2% encode reward omission and forelimb speed, and 2.3% encode reward anticipation and forelimb speed, compared to the independence null hypothesis of 1.1%, 2.4%, and 1.8%, respectively).
Extended Data Fig. 4
Extended Data Fig. 4. Body movement does not explain reward signaling in granule cells
We placed mice (n = 3) in a clear tube during imaging experiments and recorded video of their body movement from the right side and from underneath the animal (Video S2). a, For an example mouse, we computed the average body trajectory for each trial type: omitted reward, and the 25 trials most similar or most dissimilar to omitted reward body motion (Methods). AP, anterior-posterior, DV, dorsal-ventral, ML, medial-lateral. Motion on reward-similar-to-omitted-reward trials more closely matched motion on omitted reward trials than did motion on reward-dissimilar-to-omitted-reward trials. b–g, For reward cells, reward omission cells, and reward anticipation cells, despite robust signaling of reward outcome (b, d, f), higher similarity of body trajectory on rewarded trials to that on omitted reward trials did not result in cellular responses more similar to those on omitted reward trials (c, e, g), n = 21 reward cells, 41 reward omission cells, 10 reward anticipation cells (from n = 201 total granule cells analyzed from 3 mice). Therefore body movement is unlikely to be the cause of granule cell reward signaling. Dashed vertical lines denote average time of forelimb movement midpoint.
Extended Data Fig. 5
Extended Data Fig. 5. Inter-trial interval (ITI) analyses do not support that reward omission responses encode preparation for the next trial
One alternative explanation for the response of “reward omission” cells on omitted reward trials is that, following a trial in which the mouse does not receive a reward, the mouse is more anxious to begin the next trial and therefore quickly begins preparing for the next forelimb movement. If “reward omission” cells were actually just “next trial preparation cells,” then these putative earlier motor preparations on omitted reward trials would elicit a larger response. That these cells exhibit on average no response following rewarded trials could reflect mice choosing to wait before preparing the next trial following reward delivery compared to omitted reward. We tested two predictions of this hypothesis. First, we reasoned that if, following a rewarded trial, mice choose to initiate the next trial very quickly, putative “next trial preparation cells” should exhibit increased response, as they do following omitted reward. By contrast, on rewarded trials after which mice wait before initiating the next trial, the lack of motor preparations should result in a smaller response in “next trial preparation cells.” Second, if mice were substantially more anxious to initiate the next trial following omitted reward, ITIs following omitted reward trials should be shorter compared to ITIs following rewarded trials. a–d, To test the first prediction, we leveraged natural variability in mouse behavior to identify rewarded trials after which mice initiated the next movement very quickly and therefore had the shortest ITI (the earliest time that the robot returns to permit the mouse to initiate the next trial is 2 or 3.5 s following the previous reward, each in 3 mice). For each imaging session, we identified groups of 25 rewarded trials with the longest ITIs and those with the shortest. These two groups of rewarded trials had substantially different ITIs, indicating that their next-trial-preparatory movements varied substantially (mean ITI for the “short” group was 3.6 s, for the “long” group 5.8 s, n = 13 sessions). Each line in (a) represents one imaging session. Yet despite the large difference in next-trial-preparations in these two groups of trials, reward omission cells remained silent in both cases, despite robust responses on omitted reward trials (two cells from two example mice in b, c; b is the example cell from Fig. 2B, n = 97 rewarded and 25 omitted reward trials; for c, n = 129 rewarded and 34 omitted reward trials). Across all 69 identified reward omission cells (d), there was no tendency for a stronger response when mice initiated the next trial quickly compared to when they waited before doing so. Thus the prediction that putative “next trial preparation cells” respond to earlier next trial preparations was not borne out. e, To test the second prediction that mice were preparing the next trial more quickly following omitted reward trials, thereby leading to greater preparatory movements encoded by putative “next trial preparation cells,” we grouped ITIs according to whether they followed rewarded or omitted reward trials within each imaging session (indicated by each line). We found no consistent difference in how long mice chose to wait before initiating the next trial following either reward or omitted reward trials (p = 0.93 Wilcoxon signed-rank test, n = 13 imaging sessions from 6 mice). Thus, the second prediction was also not borne out. Taken together, the selective response of reward omission cells to omitted reward trials is more likely to be related to reward than next-trial-preparations.
Extended Data Fig. 6
Extended Data Fig. 6. Granule cell responses in alternate push-for-reward and pull-for-reward trials
a,b, We identified reward (a) and reward omission cells (b) based only on push-for-reward trials and computed their average response (top). We then computed the average response of these same cells on pull-for-reward trials (bottom) and found they were highly preserved (n = 23 reward omission and 30 reward cells from 4 mice). c,d, For comparison, we identified cells that responded to forelimb movement based only on push-for-reward trials (n = 25 pushing cells) and computed their average response (c, top). We then compared this to the average response of these cells on pull-for-reward trials (c, bottom) and found it was substantially weaker. Similarly, when we identified cells responsive to forelimb motion based only on pulling trials (d, bottom, n = 42 pulling cells) the response of these cells on pushing trials (top) was substantially weaker. This indicates that movement responses (c,d) are substantially less generalized across sensorimotor contexts than reward signaling (a,b). Dashed vertical lines indicate average time of forelimb pushing or pulling movement midpoint, solid line denotes time of reward.
Extended Data Fig. 7
Extended Data Fig. 7. Granule cell ensembles discriminate reward outcome and decode behavior
a, We sought to discriminate reward from omitted reward trials by linearly decoding ensemble granule cell activity. We first used lasso logistic regression to identify the minimal set of neurons that achieve optimal decoding accuracy for each imaging session. For this minimal set, we fit a linear discriminant to the mean fluorescence from 0 to 1 s of each cell on each trial. We tabulated the discriminant’s cross-validated accuracy for each imaging session (dots). Red bars denote mean ± s.e.m. across sessions (n = 13 experiments in 6 mice; Methods). Dashed line denotes chance accuracy. Green dot denotes example session used in (b) and (d). b, For an example imaging session, we applied the discriminant weighting to the time-varying cellular responses on each trial and averaged the output across all rewarded and omitted reward trials (n = 56 neurons, 64 rewarded trials, 19 omitted reward trials). The large separation following reward vs reward omission reflects accurate neural decoding. c, In general, the lasso determined that optimal cross-validated decoding was achieved with a minority of recorded cells. d, For the example session shown in b, we examined how cross-validated reward outcome decoding accuracy varied with the number of neurons included in the decoder, by varying the lasso penalty. We found that optimal performance was achieved with a subset of cells, indicating that larger groups of cells resulted in some overfitting (Methods). Error bars indicate s.e.m. from cross-validation. e, To determine the importance of reward-selective cells in decoding, we fit linear discriminants while excluding reward-selective cells (> 0.2 s.d. absolute fluorescence difference between reward conditions averaged from 0.1 to 1 s), as well as discriminants using only reward selective cells. We compared these decoders’ performance to the optimal subset determined from lasso regression, and found that reward-selective cells recover most of the optimal decoder performance. Each line represents one imaging session (n = 13 sessions). f, We reasoned that if granule cells can signal the mouse’s reward anticipation, it should be possible to use neuronal activity to decode this anticipation on a moment-by-moment basis. We therefore defined the mouse’s instantaneous anticipation state to be its lick rate (in 200 ms bins) until it received reward, in which case we defined anticipation to decline to zero (Methods). For each imaging session, we performed a linear regression to approximate the mouse’s time-varying reward anticipation behavior by using the time-varying fluorescence of all cells. We quantified regression performance as the R2 fraction of variance in reward anticipation that was accounted for by the regression output (using cross-validation). Each dot denotes a single imaging session. Red bars denote average decoder performance. Green dot denotes example session used in (g, h). g, For one example session, concurrence between decoded anticipation (top) and observed anticipation according to the definition in f (bottom), from a single imaging session averaged across all rewarded (blue) and omitted reward trials (red) (n = 26 neurons, 171 rewarded trials, 54 omitted reward trials). h, For the example session in e, we performed a lasso regression that penalizes non-zero weights on cells, to restrict the number of cells used for decoding. We varied the penalty from zero to maximum in order to determine how accuracy scales with the number cells (Methods). Reward anticipation decoding accuracy (using cross-validation) reached nearly asymptotic levels with typically ~10–20 included neurons. Error bars indicate s.e.m. from cross-validation.
Extended Data Fig. 8
Extended Data Fig. 8. Granule cell reward responses during a Pavlovian tone–reward task
a–c, Average reward-aligned fluorescence of all reward preferring cells (a), reward omission cells (b), and reward anticipation cells (c), from all mice and lobules during the tone–reward task (n = 23 reward, 42 reward omission, and 25 reward anticipation cells from 11 experiments in 5 mice). On average, reward anticipation neurons were silent following unexpected reward (p = 0.24 Wilcoxon signed-rank test; mean fluorescence change of −0.05 ± 0.05 s.d. comparing 0 – 1 s to −0.25 to −0.05 s relative to unexpected reward, n = 25 neurons). Reward omission cells did not distinguish expected from unexpected reward (p = 0.48 Wilcoxon signed-rank test comparing mean fluorescence from 0 to 1 s, n = 42 reward omission neurons). Dashed vertical lines indicate time of tone onset. d, Scatter of response properties of individual neurons (colored dots) showing reward preference (x-axis) versus licking sensitivity (y-axis) during the tone–reward task (n = 450 neurons). e, Single-trial correlation between licking and activity of each reward anticipation neuron either before reward delivery, after reward omission, or after reward delivery, averaged across all reward anticipation neurons during the Pavlovian task (n = 25 reward anticipation neurons from 11 experiments in 5 mice; p = 0.02 pre-reward, p = 0.015 post-omitted reward, p = 0.72 post-reward; Wilcoxon signed-rank test). As during forelimb movements, reward anticipation neurons correlate with licking only when licking represents anticipation. Following reward, when anticipation ceases, licking exerts no effect on activity. f, A subset of cells exhibited decreased fluorescence following the tone. To determine what these cells might be encoding, we identified all such neurons (Methods) and examined their response on the various trial types. We determined that these cells remain inhibited while the mouse is licking, beginning with anticipatory licking through reward consumption (n = 20 cells from 5 mice). Importantly, on unexpected reward trials, these neurons are also inhibited. This is unlike reward anticipation cells in (c) that cease to be active following reward delivery and also remain silent on surprise reward trials. Thus cells inhibited by licking are more classically sensorimotor. g, First row compares trials with a normal sized reward to randomly interspersed trials with an larger reward. Second row compares normal reward trials with the most and least reward licking. h, Plot of each cell’s response difference between normal and large rewards (x-axis) and preference for licking on normal reward trials (y-axis). Dashed boxes indicate reward magnitude sensitive neurons without substantial licking sensitivity. Example cell from g is outlined. i, Each row shows the trial-averaged Ca2+ response of a single neuron. Cells in each panel (trial types indicated above) are ordered identically based on their response on rewarded trials (n = 135 neurons from three sessions in lobules VIa, VIb, and simplex from an example mouse).
Extended Data Fig. 9
Extended Data Fig. 9. Chronic imaging cell tracking and registration
a–c, Magnified view of mean two-photon image from the regions shown in Fig. 4a on Day 1 (a), Day 4 (b), and Day 6 (c). d, Colorized overlay of the images in a–c in red, blue and green. We rigidly aligned the mean fluorescence image on each day to that of the final day using TurboReg, resulting in unambiguous alignment of visible morphological features of individual granule cells. e, To quantify any ambiguity in the image registration we offset our images from optimal alignment by small amounts. For one example session, we quantified the image concordance of Day 1 and Day 6, as a function of displacing the Day 1 image in the x and y directions relative to the registered optimum at zero (sum squared pixel differences between days, normalized to the registered optimum). There is a clear trough in the alignment error at the optimum, demonstrating that even slight, submicron misalignments are easily detected by image registration. Thus, there is little appreciable ambiguity in the alignment procedure. f, g, Average alignment error as a function of image displacement from the registered optimum, as in e, here averaged across all sessions and mice (n = 15 alignments from 3 mice). Error bars denote s.e.m. across alignments. Even the smallest, submicron, single pixel displacements result in significantly higher alignment error than the registered optimum (p = 4.4 × 10⁻⁶ and 5.8 × 10⁻⁵ for one-pixel x and y misalignments respectively, Wilcoxon signed-rank test). h, Mean fluorescence response of all neurons for the example mouse shown in Fig. 4c, here ordered by their Day 1 activity peak response time (n = 97 neurons). i–j, Change over the 6 days of the imaging study in licking behavior (i) and forelimb movement behavior (j) for the mouse in (h). Gross changes in motor behavior were relatively modest over the days of the imaging study (Methods).
Extended Data Fig. 10
Extended Data Fig. 10. Granule cell reward responses unlikely result from a direct midbrain dopaminergic projection to the cerebellar cortex
Previous literature on the topic of dopamine in the cerebellum has been controversial, with some anatomical tracing studies suggesting a projection to cerebellar cortex from ventral tegmental area (VTA),, while others failed to find such a projection. Some studies identified the presence of dopamine in the cerebellar cortex directly, yet a major confound arises due to the large noradrenergic projection to the cerebellum from the locus coeruleus, as dopamine is a precursor to norepinephrine. To determine whether our widespread reward-related signals were likely to be driven by a direct dopaminergic projection, we traced the inputs to the cerebellar cortex using viral methods. a, Schematic. We injected CAV2-cre, cre recombinase expressed from canine adenovirus-2 known to robustly infect axons and their terminals in many neuronal types including dopaminergic neurons specifically,, into the cerebellar cortex of a highly sensitive cre-reporter Ai14 transgenic mouse. Thus any neuron in a region presynaptic to the cerebellar injection site infected by CAV2 will express tdTomato. We injected either the vermis of Lobule VI (n =3 mice) or for comparison also the hemisphere lobule crus I (1 mouse). b, We stained serial coronal brain sections for tyrosine hydroxylase (TH, a marker for dopaminergic neurons) and examined the distribution of input cells in the midbrain. In all 4 mice examined (sixty-four 40- or 60-micron sections encompassing all midbrain dopamine neurons), we did not find any VTA or substantia nigra pars compacta (SNc) dopamine neurons projecting to the cerebellar cortex. As a positive control, we noted that all mice exhibited robust tdTomato expression in known inputs to the cerebellum such as the pontine nuclei shown above. To exclude the unlikely possibility that putative VTA dopamine neurons that project to the cerebellum cannot take up CAV2 efficiently, we also performed an experiment where we injected AAVretro-EF1a-FLPo, a virus that robustly infects axonal terminals, into cerebellar lobule VI of a mouse that expresses FLP-dependent tdTomato, and again did not find tdTomato+ neurons in the VTA or SNc, but abundant tdTomato+ neurons in pontine nuclei (data not shown). Thus if a direct midbrain dopaminergic projection to the cerebellum exists, it must be very sparse, and therefore unlikely to drive the very large and widespread reward-related signals in our granule cell imaging data.
Figure 1
Figure 1. Two-photon Ca2+ imaging of cerebellar granule cells during an operant task
a, Mice voluntarily pushed a manipulandum forward for sucrose water reward. We performed Ca2+ imaging while recording the paw position and the mouse’s licking. b, Confocal image of the cerebellar cortex of a transgenic mouse expressing GCaMP6f in granule cells. Calbindin immunostain for Purkinje cells in red. ML, molecular layer; PCL, Purkinje cell layer; GCL, granule cell layer. Two-photon imaging plane is schematized (dashed white box). c, Example in vivo two-photon images of cerebellar granule cells at rest and during a forelimb movement (500-ms average). Arrows denote example granule cells exhibiting fluorescence increases during this forelimb movement. Inset shows magnified view of mean fluorescence signals. d, Each row depicts the Ca2+ trace over time of one granule cell from the image in c. Blue triangles indicate forelimb movements. Red traces correspond to cells with red arrows in c. Red triangle denotes forelimb movement shown in c. Cells are ordered according to Extended Data Fig. 1c. e, Task structure. See Extended Data Fig. 3f for an alternative condition. f, Trial-averaged forelimb movement and licking (68 trials from an example mouse). Solid and dashed vertical lines denote midpoint of forelimb movement and average time of reward, respectively. g, Each row shows the trial-averaged Ca2+ response of a single neuron, with colors representing fluorescence signal in the unit of standard deviation (s.d.) from the mean (188 cells from three sessions in lobules VIa, VIb, and simplex from the mouse in f.). In this and all subsequent figures, shaded regions denote s.e.m.
Figure 2
Figure 2. Granule cells encode reward context during a forelimb movement operant task
a–c, Trial averaged Ca2+ response (solid traces) of three example granule cells, superimposed on licking traces (dashed). Solid and dashed vertical lines denote reward onset and midpoint of forelimb movement, respectively. First row compares rewarded trials and omitted reward trials (trial numbers in a–c, 228, 97, 171 rewarded and 77, 25, 54 omitted reward, respectively). Second row compares rewarded trials with the most or least licking in response to reward delivery (25 of each in the bracketed period). c, Third row compares trials with the most or least anticipatory licking (25 of each in the bracketed period). Fourth row shows the relationship between licking and activity of all reward anticipation neurons. Bars denote the Spearman correlation between fluorescence response and licking either prior to reward delivery (−1 to −0.05 s), or following omitted reward or reward delivery (0.1 to 0.6 s). *** p = 8×10⁻⁶ pre-reward; ** p = 5×10⁻⁴ post-omitted reward; n.s. p = 0.59 post-reward (Wilcoxon signed-rank test; n = 50 reward anticipation neurons from 6 mice). d,e, In a modified task where mice alternated pushing-for-reward (top) with pulling-for-reward (bottom) trials, forelimb movement and licking responses are indicated as solid and dashed lines, respectively (d). Reward anticipation neurons classified on pushing trials (e, top) maintain similar responses on pulling trials (e, bottom), average of 41 neurons from 4 mice. f, Illustration of 3 mm cranial window. Grey lines represent cerebellar lobule boundaries. g, For each granule cell recorded during the (pushing only) operant task, we quantified the reward vs. reward omission response preference (x-axis; mean fluorescence response difference from 0.1 to 1 s), and the licking response preference (y-axis; mean response difference between trials with the most and least reward licking from 0.1 to 1 s; n = 6 mice, 561 cells). Colors denote lobule origin of the cells. Dashed boxes indicate neurons we classified as selective for reward or omitted reward, with minimal licking sensitivity. Example cells from ac are outlined. h, Prevalence of reward, reward omission, and reward anticipation neurons. Reward omission excludes reward anticipation neurons.
Figure 3
Figure 3. Granule cells encode reward context during a Pavlovian tone–reward task
a, Top, task illustration. Bottom, average licking response (11 sessions in 5 mice). b–d, Trial averaged response of three example granule cells (solid traces) superimposed on licking response (dashed). Dashed and solid vertical lines indicate the time of tone onset and reward delivery, respectively. First row compares rewarded trials and randomly interspersed omitted reward trials. Second row compares rewarded trials to interspersed unexpected rewards not preceded by a tone (trial numbers in b–d: 178, 163, 163 rewarded, 26, 24, 24 omitted reward, and 26, 24, 24 unexpected reward, respectively). e, Plot of each cell’s response differences between rewarded and omitted reward trials (x-axis), and between unexpected and expected reward trials (y-axis). Colors denote lobule origin of the cells (450 cells). Example cells from b–d are outlined.
Figure 4
Figure 4. Emergence of reward expectation responses during forelimb movement task learning
a, Example in vivo two-photon mean fluorescence images of the same granule cells acquired on different days, registered to the final day (magnified in Extended Data Fig. 9). Arrows indicate example corresponding neurons across days. b, Average responses of all detected granule cells on rewarded trials on Day 1 and Day 6 of imaging, sorted separately for each day by time of peak response (97 neurons from an example mouse). c, Average response of all granule cells on rewarded trials on all six days, sorted by their Day 6 activity, for the mouse in b. d, Average response to omitted reward on Day 2 and Day 6, ordered by time of peak response on rewarded trials on the same days. e–g, Top, For each day, average fluorescence of the top 10% of cells across mice (24 neurons) ranked by their Day 6: (e) anticipatory rise in fluorescence (mean fluorescence difference between −0.25 to −0.05 s and −1.3 to −1 s), (f) response preference for omitted reward over reward (mean difference over 0.1 to 1 s), or (g) forelimb movement response (fluorescence rise during movement, −1.3 to −1 s, compared to pre-movement, −1.8 to −1.3 s). Bottom, summary across all neurons of changes in anticipatory responsiveness (e), omitted reward preference (f), or forelimb movement responsiveness (g). (***p < 10−6; n.s. p = 0.76; n = 233 neurons from 3 mice, Wilcoxon signed-rank test).

Comment in

References

    1. Herculano-Houzel S. Coordinated Scaling of Cortical and Cerebellar Numbers of Neurons. Front Neuroanatom. 2010;4:12. - PMC - PubMed
    1. Marr D. A theory of cerebellar cortex. J Physiol. 1969;202:437–470. - PMC - PubMed
    1. Albus JS. A theory of cerebellar function. Math Biosci. 1971;10:25–61.
    1. Fujita M. Adaptive filter model of the cerebellum. Biol Cybern. 1982;45:195–206. - PubMed
    1. Rancz EA, et al. High-fidelity transmission of sensory information by single cerebellar mossy fibre boutons. Nature. 2007;450:1245–1248. - PMC - PubMed

Publication types

MeSH terms