. 2017 Mar 30;543(7647):728-732.
doi: 10.1038/nature21676. Epub 2017 Mar 20.

Effective combinatorial immunotherapy for castration-resistant prostate cancer

Affiliations

Effective combinatorial immunotherapy for castration-resistant prostate cancer

Xin Lu et al. Nature. .

Erratum in

Abstract

A significant fraction of patients with advanced prostate cancer treated with androgen deprivation therapy experience relapse with relentless progression to lethal metastatic castration-resistant prostate cancer (mCRPC). Immune checkpoint blockade using antibodies against cytotoxic-T-lymphocyte-associated protein 4 (CTLA4) or programmed cell death 1/programmed cell death 1 ligand 1 (PD1/PD-L1) generates durable therapeutic responses in a significant subset of patients across a variety of cancer types. However, mCRPC showed overwhelming de novo resistance to immune checkpoint blockade, motivating a search for targeted therapies that overcome this resistance. Myeloid-derived suppressor cells (MDSCs) are known to play important roles in tumour immune evasion. The abundance of circulating MDSCs correlates with prostate-specific antigen levels and metastasis in patients with prostate cancer. Mouse models of prostate cancer show that MDSCs (CD11b+Gr1+) promote tumour initiation and progression. These observations prompted us to hypothesize that robust immunotherapy responses in mCRPC may be elicited by the combined actions of immune checkpoint blockade agents together with targeted agents that neutralize MDSCs yet preserve T-cell function. Here we develop a novel chimaeric mouse model of mCRPC to efficiently test combination therapies in an autochthonous setting. Combination of anti-CTLA4 and anti-PD1 engendered only modest efficacy. Targeted therapy against mCRPC-infiltrating MDSCs, using multikinase inhibitors such as cabozantinib and BEZ235, also showed minimal anti-tumour activities. Strikingly, primary and metastatic CRPC showed robust synergistic responses when immune checkpoint blockade was combined with MDSC-targeted therapy. Mechanistically, combination therapy efficacy stemmed from the upregulation of interleukin-1 receptor antagonist and suppression of MDSC-promoting cytokines secreted by prostate cancer cells. These observations illuminate a clinical path hypothesis for combining immune checkpoint blockade with MDSC-targeted therapies in the treatment of mCRPC.


Conflict of interest statement

Author Information The authors declare no competing financial interests. Readers are welcome to comment on the online version of the paper.

Figures

Extended Data Figure 1
Extended Data Figure 1. Chimeric modeling as an efficient approach to generating spontaneous metastatic prostate cancer
(a) Comparison of probability of obtaining PCa-bearing males with CPPSML genotype in a litter, through breeding or chimeric modeling. In chimeric modeling, >75% coat color contributed by injected mESCs is defined as positivity for chimera. (b–c) Predicted and experimental results for PCR-RFLP genotyping of H2 locus from several mouse strains and two mESC lines (JM8 as a standard mESC line derived from C57BL/6 strain as control; Ep61 is also known as JH61). Red asterisk in (b) and yellow highlight wells in (c) indicate that the H2 haplotyte for JH61 is H2b, same as the C57BL/6 strain. (d) SSLP marker analysis of the region on chromosome 17 flanking the H2 complex locus (34-46Mb), showing that JH61 has 100% C57BL/6 background in H2 locus, identical to the standard C57BL/6 mESC line JM8. (e) Experimental steps for generating the CPPSML chimeras. (f) Fluorescence images of prostate, draining lymph node (LN) and lung from a representative chimera at 3 months old. GFP+ signals indicate the presence of metastasis to LN and disseminated tumor cells and micrometastasis in lung. Scale bars: prostate 5mm; lymph node and lung, 1mm. (g) Fluorescence microscopy and H&E image of snap frozen prostate tumor from chimera showing that the GFP+ area corresponds to adenocarcinoma and the GFP- area corresponds to normal host cells. Scale bar 500μm. (h) IHC staining showing the expansion of both CK8+ luminal lineage and CD5+ basal lineage in the prostate tumor formed in CPPSML chimera. Scale bar 50μm.
Extended Data Figure 2
Extended Data Figure 2. Experimental design for preclinical therapy of mCRPC in CPPSML chimeras
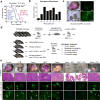
(a) Significant yet transient survival benefit by castration followed by diet admixed with enzalutamide (50mg/kg diet) in PB-Cre+ PtenL/L p53L/L Smad4L/L mice (n=40 and 18, respectively). ****P<0.0001, Log-rank test. (b) Record of enrollment for drug trials showing the time range of prostate tumor formation in the CPPSML chimera. (c) Representative CPPSML chimera with primary CRPC, lymph node metastasis, and micrometastasis in lung. Scale bar: prostate 5mm; lymph node and lung, 1mm. AP, DLP and VP denote anterior, dorsolateral and ventral prostate lobes, respectively. (d) Experimental flow for creating mCRPC cohorts and preclinical testing of monotherapy and combination therapy, followed by tumor characterization. (e) Representative images of prostate tumors with H&E staining, and GFP+ tumor cells in the lymph node and lung. Scale bar: prostate 5mm; lymph node and lung, 1mm; H&E, 200μm.
Extended Data Figure 3
Extended Data Figure 3. Significant combination efficacy by cabozantinib and immune checkpoint blockade observed in chimeras generated from JH58
(a) Experimental design for JH58 chimeras, similar to the JH61 chimera experiments. (b) Longitudinal MRI images from representative chimeras in control or combination cohorts. Red contour denotes area of prostate tumor. (c) Strong anti-tumor effect by combination therapy in JH58 chimeras shown by prostate tumor weight, lymph node (LN) metastasis score and lung micrometastasis number (n=3, biological replicates). **P<0.01, Student’s t-test. (d–e) Quantification of tumor cell proliferation by Ki67 IHC (n=4, biological replicates) with representative images. Anterior prostate (AP) and dorsolateral prostate (DLP) were quantified separately. (f–g) Quantification of tumor cell apoptosis by cleaved caspase 3 (CC3) IHC (n=5, biological replicates) with representative images. Scale bar 100μm. In (c)(d)(f), data represent mean ± s.d. *P<0.05, **P<0.01, ***P<0.001, compared with Control using Student’s t-test.
Extended Data Figure 4
Extended Data Figure 4. Combination efficacy by Gr1 neutralizing antibody with immune checkpoint blockade
(a) Dasatinib, but not cabozantinib or BEZ235, significantly reduced the frequency of infiltrating T cells in CRPC of CPPSML mice (n=4, biological replicates). Data represent mean ± s.e.m. *P<0.05, Mann-Whitney test. (b) Frequency of Gr-MDSCs and Mo-MDSCs in CPPSML prostate tumors (n=13, biological replicates). (c) Weight and representative whole organ and H&E images of prostate tumors from CPPSML chimeras induced to develop CRPC and treated with one month of control IgG, ICB (anti-CTLA4 plus anti-PD1 antibodies), anti-Gr1 neutralizing antibody, or combination of ICB and anti-Gr1 (n=4, biological replicates). Scale bars: 3mm for organ images, 200μm for H&E images. In (b) and (c), data represent mean ± s.d. *P<0.05, **P<0.01, ****P<0.0001, #P>0.05, Mann-Whitney test.
Extended Data Figure 5
Extended Data Figure 5. Characterization of the effect of drugs on MDSCs
(a) Comparison of in vitro sensitivity to Dasa by MDSCs, CD8+ T cells, and GFP+ cancer cells isolated from CRPC of CPPSML mice. Cell viability was measured 24h after start of drug treatment using the WST-1 assay. IC50 values are indicated. (b) Comparison of in vitro sensitivity to BEZ, Cabo and Dasa by MDSCs isolated from CRPC of CPPSML mice. The assay was performed in RPMI1640 supplemented with 10% FBS and 10ng/mL GM-CSF (n=2, biological replicates). (c) Comparison of in vitro sensitivity to BEZ, Cabo and Dasa by MDSCs isolated from CRPC of CPPSML mice. The assay was performed in RPMI1640 supplemented with 10% FBS, 10ng/mL GM-CSF and also pre-conditioned for 12 hours by PCa cell lines established from the CPPSML model (n=2, biological replicates). (d) Representative CFSE flow cytometer histograms showing the effect on in vitro T cell proliferation by MDSCs isolated from CRPC of CPPSML mice treated with indicated drugs. Position of CFSE peaks can be used to denote the T cell division times. (e) Representative CFSE flow cytometer histograms showing the effect of Cabo, BEZ and Dasa on in vitro T cell proliferation.
Extended Data Figure 6
Extended Data Figure 6. Cabozantinib and BEZ235 inhibit PI3K signaling in prostate tumor and intratumoral MDSCs
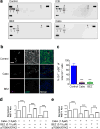
(a) Mouse Phospho-RTK Array measuring phospho-RTK activity in prostate tumors with indicated treatments. 1 through 5 represents p-EGFR, p-ErbB2, p-ErbB3, p-Axl and p-PDGFRα, respectively (n=2, biological replicates). (b-c) Reduced phospho-S6 signal in intratumoral MDSCs by Cabo and BEZ treatment, revealed by immunofluorescence co-staining of pS6 and Gr-1 (n=3, biological replicates). Scale bar 100μm. (d) WST-1 assay showing that co-transfection of active ERK2 and p70S6K proteins mediated the resistance of MDSCs isolated from CPPSML tumors to the cytotoxicity by Cabo (1.5μM) or BEZ (0.15μM). The assay was performed in RPMI1640 supplemented with 10% FBS and 10ng/mL GM-CSF (n=3, biological replicates). (e) WST-1 assay similar as in (d) but performed in RPMI1640 supplemented with 10% FBS, 10ng/mL GM-CSF and also pre-conditioned for 12 hours by PCa cell lines established from the CPPSML model (n=3, biological replicates). In (c)(d)(e), data represent mean ± s.d. ***P<0.001, Student’s t-test.
Extended Data Figure 7
Extended Data Figure 7. Cabozantinib or BEZ235 suppress secretion by prostate cancer cells of several cytokines that promote MDSC activity
(a) Quantification of intratumoral cytokine levels in CRPC chimera tumors with indicated treatment using cytokine array (n=2, biological replicates). 1 through 9 represent CCL5, CCL12, CCL21, CD40, CD142, HGF, IGFBP-6, IL-1ra and VEGF, respectively. (b) Quantification of intratumoral cytokine levels in Dasa + ICB combination treated CPPSML chimera CRPC with mouse cytokine assay, with image and relative intensity of the numbered cytokines shown (n=2, biological replicates). (c) Experimental design for MDSC culture in the presence of PCa conditioned medium. (d) Cytokine array results for conditioned medium from CPPSML PCa cell lines treated with vehicle, Cabo (1μM) or BEZ (1μM) for 12 hours (n=2, biological replicates). Boxed cytokine is CCL5. (e) Effect of supplementation of individual cytokines to the conditioned medium from PCa cell lines treated with Cabo (1μM) or BEZ (1μM) on Arg1, Cybb, Ncf1 and Ncf4 from cultured MDSCs (n=3, biological replicates). (f–g) Chemical structure and synthesis of allosteric CXCR1/2 antagonist SX-682 (Syntrix Biosystems). For details, please refer to the corresponding session in Methods. In (b)(e)(f), data represent mean ± s.d.
Extended Data Figure 8
Extended Data Figure 8. Detailed cell population annotation in SPADE tree
(a) SPADE tree colored by the median intensity of individual markers (indicated above color bar) to facilitate the assignment of tree branches to individual cell populations (shown on the top of each plot) (n=12, biological replicates). (b) Surface markers of different immune subpopulations representing small branches of the SPADE tree.
Extended Data Figure 9
Extended Data Figure 9. Model depicting the combination therapy strategy in treating mCRPC
As demonstrated in the CPPSML chimera model, targeted therapy with agents that inhibit MDSC infiltration frequency and immunosuppressive activity can synergize with ICB to invigorate T cell immunity in the prostate tumor microenvironment thus impair CRPC progression.
Figure 1
Figure 1. Strong combination synergy by immune checkpoint blockade with cabozantinib or BEZ235 in mCRPC
(a) Spontaneous prostate tumor development in the CPPSML model with tumors detected by fluorescence, bioluminescence and MRI. Scale bar 5mm. (b-c) Procedures and representative MRI images for testing prostate tumor response to castration and enzalutamide diet in PB-Cre+ PtenL/L mice and CPPSML mice (n=5, biological replicates). (d-f) Preclinical trial results of prostate tumor weight, lymph node (LN) metastasis score and lung micrometastasis number (n=11, 6, 7, 4, 4, 9, 6, and 7 respectively, biological replicates). Red bar indicates the mean. *P<0.05, **P<0.01, ***P<0.001, ****P<0.0001, #P>0.05, Mann-Whitney test.
Figure 2
Figure 2. Cabozantinib and BEZ235 attenuate MDSC frequency and immunosuppressive activity in the tumor microenvironment
(a–b) CyTOF quantification of intratumoral Gr-MDSC frequency and CD8+ T/Treg ratio by indicated treatments (n=17, 8, 4, 6, 8 and 4, respectively). Red bar indicates the mean. *P<0.05, **P<0.01, ***P<0.001, Mann-Whitney test. (c-d) In vitro sensitivity to Cabo (c) and BEZ (d) by MDSCs, CD8+ T cells, and GFP+ cancer cells isolated from CRPC in CPPSML mice with IC50 indicated (n=3, biological replicates). (e) T cell proliferation assay when co-cultured 1:1 with MDSCs isolated from control- or drug-treated CRPC. High and Low Proliferation was defined as T cell division ≥3 and ≤2, respectively (n ≥4, biological replicates). (f-g) Drug effect on CD8+ (f) and CD4+ (g) T cell proliferation assay. High, Moderate and No Proliferation was defined as T cell division ≥3, ≤2 and =0, respectively (n=3, biological replicates). (h-i) Drug effect on IFN-γ secretion (by CD8+ T cells) and IL-2 secretion (by CD4+ T cells) in the assay in (f-g), measured by ELISA (n=3, biological replicates). In (c-d)(h-i), data represent mean ± s.d.
Figure 3
Figure 3. Cabozantinib and BEZ235 inhibit PI3K signaling and modulate MDSC-regulating cytokines
(a) Relative phospho-RTK intensity measured with phospho-RTK array for treated CRPC (n=2, biological replicates). (b) Level of phospho-proteins in RTK and PI3K/Akt/mTOR pathways in treated tumors, detected with western blot. (c) Phospho-Erk and phospho-S6 intensity in MDSCs when co-transfected with ERK2 and p70S6K, detected with western blot. (d-e) Effect of ERK2 and p70S6K on the resistance of MDSCs to Cabo (1.5μM) or BEZ (0.15μM), measured with WST-1 assay (n=3, biological replicates). (f) Quantification of tumor cytokine levels in treated CRPC using cytokine array (n=2, biological replicates). (g) Transwell MDSC migration assay (n=3, biological replicates). (h) RNA expression levels of indicated genes by intratumoral MDSCs when cultured in conditioned medium by CPPSML PCa cell lines, measured with qRT-PCR (n=3, biological replicates). (i) Effect on gene expression by pretreating CPPSML PCa cells with Cabo and BEZ before conditioned medium was collected to culture MDSCs (n=3, biological replicates). (j) Quantification of cytokine levels in conditioned medium from CPPSML PCa cell lines pretreated with vehicle, Cabo (1μM) or BEZ (1μM), measured with cytokine array (n=2, biological replicates). In (a)(d-j), data represent mean ± s.d. **P<0.01, ***P<0.001, Student’s t-test. For gel source data, see Supplementary Figure 1.
Figure 4
Figure 4. Gr-MDSCs inversely correlate with CD8+ infiltrating T cells in human prostate cancer
(a–b) Efficacy of isoform-selective p110 inhibitors or Cxcr1/2 inhibitor as single agents or in combination with ICB to treat mCRPC in CPPSML model (n=15, 8, 3, 6, 4, 5, 5, and 10 respectively, biological replicates). Red bar indicates the mean. *P<0.05, **P<0.01, ***P<0.001, ****P<0.0001, #P>0.05, Mann-Whitney test. Scale bars: 3mm for organ images, 200μm for H&E images. (c) SPADE tree derived from CyTOF analysis of human samples. All live infiltrating immune cells (CD45+) were used to construct the tree. (d) Frequency of infiltrating immune cell populations from patient samples. (e) Linear regression analysis of Gr-MDSC frequency with CD8+ T cell frequency. In (c–e), n=12 (biological replicates).

Comment in

References

    1. Watson PA, Arora VK, Sawyers CL. Emerging mechanisms of resistance to androgen receptor inhibitors in prostate cancer. Nat Rev Cancer. 2015;15:701–711. - PMC - PubMed
    1. Sharma P, Allison JP. The future of immune checkpoint therapy. Science. 2015;348:56–61. - PubMed
    1. Kwon ED, et al. Ipilimumab versus placebo after radiotherapy in patients with metastatic castration-resistant prostate cancer that had progressed after docetaxel chemotherapy (CA184-043): a multicentre, randomised, double-blind, phase 3 trial. The Lancet Oncology. 2014;15:700–712. - PMC - PubMed
    1. Beer TM, et al. Randomized, Double-Blind, Phase III Trial of Ipilimumab Versus Placebo in Asymptomatic or Minimally Symptomatic Patients With Metastatic Chemotherapy-Naive Castration-Resistant Prostate Cancer. Journal of Clinical Oncology. 2016 - PubMed
    1. Topalian SL. Safety, activity, and immune correlates of anti-PD-1 antibody in cancer. N Engl J Med. 2012;366:2443–2454. - PMC - PubMed

Publication types

MeSH terms