. 2017 Mar 21:8:14902.
doi: 10.1038/ncomms14902.

Real-time reliable determination of binding kinetics of DNA hybridization using a multi-channel graphene biosensor

Affiliations

Real-time reliable determination of binding kinetics of DNA hybridization using a multi-channel graphene biosensor

Shicai Xu et al. Nat Commun. .

Abstract

Reliable determination of binding kinetics and affinity of DNA hybridization and single-base mismatches plays an essential role in systems biology, personalized and precision medicine. The standard tools are optical-based sensors that are difficult to operate in low cost and to miniaturize for high-throughput measurement. Biosensors based on nanowire field-effect transistors have been developed, but reliable and cost-effective fabrication remains a challenge. Here, we demonstrate that a graphene single-crystal domain patterned into multiple channels can measure time- and concentration-dependent DNA hybridization kinetics and affinity reliably and sensitively, with a detection limit of 10 pM for DNA. It can distinguish single-base mutations quantitatively in real time. An analytical model is developed to estimate probe density, efficiency of hybridization and the maximum sensor response. The results suggest a promising future for cost-effective, high-throughput screening of drug candidates, genetic variations and disease biomarkers by using an integrated, miniaturized, all-electrical multiplexed, graphene-based DNA array.


Conflict of interest statement

The authors declare no competing financial interests.

Figures

Figure 1
Figure 1. Photos and layout of the sensor chip.
(a) Scanning electron microscope (SEM) images of graphene single-crystal domain. (b) Photograph of the sensor composed of multi-G-FETs with a microfluidic channel along with solution inlet and outlet as labelled. (c) Cross-sectional view of an individual G-FET device. (d) Optical micrograph of the sensor with multi-G-FET detecting channels.
Figure 2
Figure 2. Functionalization and properties of G-FETs.
(a) Molecular geometry of PBASE and its link to the probe DNA. (b) Functionalization of graphene surface by PBASE, immobilization of a probe DNA (in orange) by reacting with the PBASE and hybridization of the probe DNA with target (in blue) and unrelated, control DNAs (in green). (c) Source drain current at a constant source drain voltage (0.1 V) with varying gate voltage for the bare graphene (in black) and after each addition of the following reagents in sequence, 10 mM PBASE (in red), 100 nM probe DNA P20 (in blue), 5 nM complementary DNA T20 (in green) and 5 nM unrelated, control DNA U20 (in cyan, essentially indistinguishable from the blue curve). (d) A schematic diagram of the sensing model of a G-FET together with the equivalent circuit with four parallel plate capacitors (CG1, CG2, CG3 and CQ) and a resistance (RL) connected in series. CG1, CG2 and CG3 denote the capacitance between graphene and solution, the capacitance of the DNA to solution and the capacitance between Pt gate and solution, respectively. CQ denotes the quantum capacitance of graphene associated with the finite density of states due to Pauli principle. RL is the electrical resistance of the ionic solution. When target DNAs dock on the graphene surface, a transfer curve shift (ΔVcnp) occurs due to changes of charges near the graphene sensor chip surface that is continuously monitored.
Figure 3
Figure 3. DNA–DNA binding using the G-FET in 0.01 × PBS buffer.
(a) Real-time sensor responses of G-FET to DNA hybridization and dissociation. Each curve represents the measurement of a different T20 DNA concentration from channel 1. The kinetic data for a DNA sequence unrelated to the probe DNA P20 at 5 nM is shown as a control (blue open circles). (b) Multiple hybridization cycles upon exposure to the target DNA sequences of T20 at different concentrations. The arrows indicate the timing for the injection of 10 mM NaOH and subsequent rinse by the pure 0.01 × PBS buffer. The initial baseline current of the functionalized G-FET is marked by a red dotted line. (c) Kinetic curves of the DNA hybridization at 0.05 and 0.01 nM of T20. (d) The maximal sensor response ΔVcnp as a function of DNA concentration in channel 1 along with the curve fitting by equation (10).
Figure 4
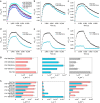
Figure 4. Kinetics of DNA hybridization with a single mismatched base pair.
(a) Kinetic curves of hybridization of immobilized probe P20 with the complementary T20 and the sequences with one mismatched base pair at different locations. (bf) Kinetic curves of hybridization between the designed probes in different lengths from 26 (b), 23 (c), 19 (d), 15 (e) to 11 (f) and the complementary T26 or between the probe and its mutant T26 (TC13) as labelled. (g) Kinetic rates and association constants from (a). (h) Kinetic rates and association constants from (bf). In all cases, the concentration of the target DNAs is 5 nM. Error bars are s.d.s from measurements of six channels.

References

    1. Ahmed M. U., Saaem I., Wu P. C. & Brown A. S. Personalized diagnostics and biosensors: a review of the biology and technology needed for personalized medicine. Crit. Rev. Biotechnol. 34, 180–196 (2014). - PubMed
    1. Ziegler A., Koch A., Krockenberger K. & Grosshennig A. Personalized medicine using DNA biomarkers: a review. Hum. Genet. 131, 1627–1638 (2012). - PMC - PubMed
    1. Guo F. et al.. The Transcriptome and DNA methylome landscapes of human primordial germ cells. Cell 161, 1437–1452 (2015). - PubMed
    1. Ramsay G. et al.. DNA chips: state-of-the-art. Nat. Biotechnol. 16, 40–44 (1998). - PubMed
    1. Cooper M. A. et al.. Optical biosensors in drug discovery. Nat. Rev. Drug. Discov. 1, 515–528 (2002). - PubMed

Publication types