. 2017 Mar 21:8:14742.
doi: 10.1038/ncomms14742.

Genomic innovations linked to infection strategies across emerging pathogenic chytrid fungi

Affiliations

Genomic innovations linked to infection strategies across emerging pathogenic chytrid fungi

Rhys A Farrer et al. Nat Commun. .

Abstract

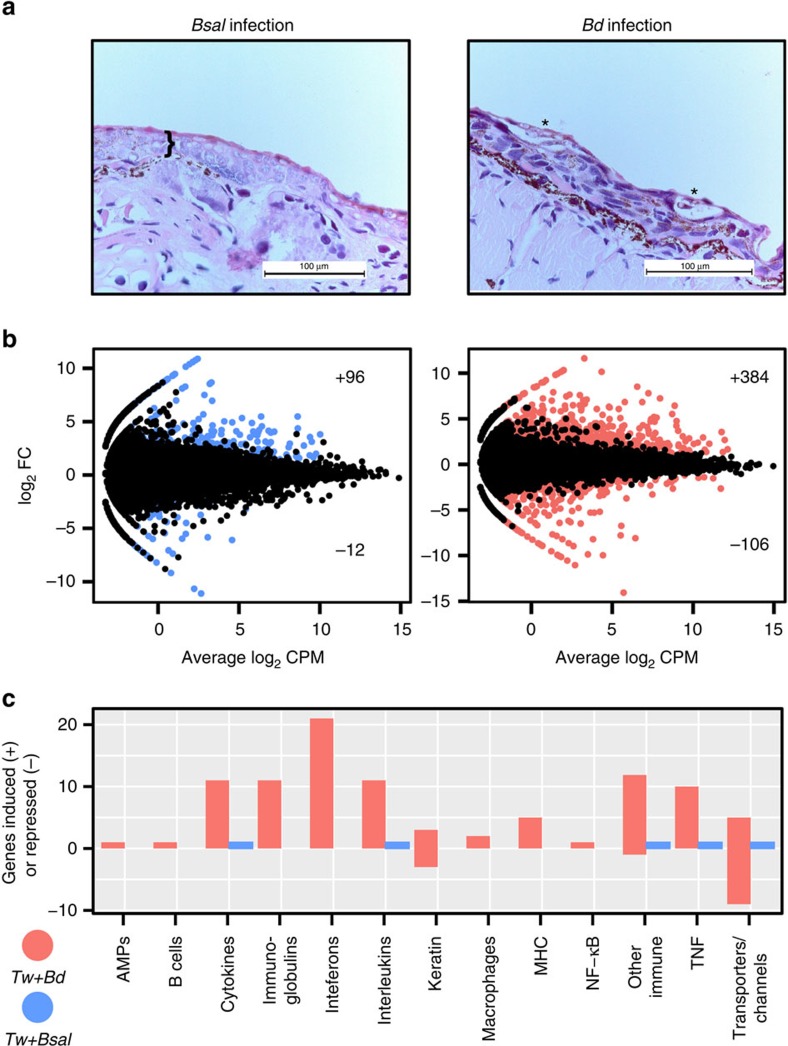
To understand the evolutionary pathways that lead to emerging infections of vertebrates, here we explore the genomic innovations that allow free-living chytrid fungi to adapt to and colonize amphibian hosts. Sequencing and comparing the genomes of two pathogenic species of Batrachochytrium to those of close saprophytic relatives reveals that pathogenicity is associated with remarkable expansions of protease and cell wall gene families, while divergent infection strategies are linked to radiations of lineage-specific gene families. By comparing the host-pathogen response to infection for both pathogens, we illuminate the traits that underpin a strikingly different immune response within a shared host species. Our results show that, despite commonalities that promote infection, specific gene-family radiations contribute to distinct infection strategies. The breadth and evolutionary novelty of candidate virulence factors that we discover underscores the urgent need to halt the advance of pathogenic chytrids and prevent incipient loss of biodiversity.


Conflict of interest statement

The authors declare no competing financial interests.

Figures

Figure 1
Figure 1. Relationship and genomic organization of four chytrid species.
A phylogenetic tree inferred using RAxML indicates the relationships of the four chytrids (branch lengths indicate the mean number of nucleotide substitutions per site). To the right is a synteny plot, visualizing regions that span two or more orthologs between any two species as a connected grey line. Scaffold numbers are shown above each genome axis if longer than 100 kb, and the location of Batra. Group 1 M36s (G1M36), Bsal Group 2 M36s (G2M36), Crinklers (CRN) and the secreted upregulated Tribes 1 & 4 are depicted with coloured bars.
Figure 2
Figure 2. M36 gene-family relationship and expression at differing life stages.
(a) A phylogenetic tree inferred using RAxML from protein alignments of all identified M36 proteins in the four chytrids (branch lengths indicate the mean number of nucleotide substitutions per site). Bd genes are shown in green, Bsal genes in red, Sp genes in blue and Hp genes in black. (b) M36 expression was calculated (TMM normalized fragments per kilobase mapped; FPKM) across three in vitro replicates and three in vivo replicates (shown as 1, 2 and 3). Only M36 transcripts that are significantly differentially expressed in Tw are shown. A greater number are significantly differentially expressed in Bsal compared with Bd, which also include eight Bsal G1M36s that are downregulated. Trees indicate hierarchical clustering between data sets (above) and genes (left of heatmap). (c) Protease activity in Bd and Bsal. The protease concentration was determined in mature cultures (above) and spores (below) that were incubated with unsupplemented distilled water (control) or distilled water supplemented with different protease inhibitors. The results are presented as means+s.e.m. using a non-parametric Mann–Whitney U-analysis. Significant changes compared to the control group are signed with an asterisk (of P<0.05). (d) G1M36 and G2M36 mean fold changes in mRNA expression profiles in Bd (above) and Bsal (below). The data shows the normalized target gene quantities in spores that were incubated with skin tissue of Tw for 2 h, 3-day-old sporangia grown in TGhL and skin tissue from chytrid-infected Tw animals relative to freshly collected spores. The results are presented as means+s.d. Significant differences in expression between each experimental group are shown in Supplementary Table 6.
Figure 3
Figure 3. CBM18 sequence similarity and expression at different life stages.
(a) A phylogenetic tree of all chytrid CBM18 proteins inferred using RAxML with the per cent of 1,000 bootstrap replicates indicated for each node (branch lengths indicate the mean number of nucleotide substitutions per site). To the right of gene names are a diagram of the domain structure (black boxes indicate CBM18 domain, colours indicate larger domains shown in legend). (b) CBM18 mean fold changes in mRNA expression profile in Bd (above) and Bsal (below). The data represent the normalized target gene amount in spores that were incubated with skin tissue of Tylototriton wenxianensis (Tw) for 2 h, 3-day-old sporangia grown in TGhL, 3-day-old sporangia treated with TGhL broth supplemented with chitinase for 2 h and skin tissue from chytrid-infected Tw animals relative to freshly collected spores which is considered 1. The results are presented as means+s.d. Significant differences in expression between each experimental group are shown in Supplementary Table 6. DRDE, down-regulated deacetylase-like; UPDE, up-regulated deacetylase-like.
Figure 4
Figure 4. Crinkler gene-family relationship and expression patterns.
(a) A phylogenetic tree inferred using RAxML from the N-terminal region (first 50 amino acids) of all identified CRNs, showing Bd genes in green, Bsal genes in red, Sp genes in blue and Hp genes in black (branch lengths indicate the mean number of nucleotide substitutions per site). Two motifs were identified from these sequences. (b) Most CRNs were downregulated in Tw, and all those that were significantly differentially expressed (shown) were downregulated, including three Bsal genes (indicated by asterisk). Trees indicate hierarchical clustering between data sets (above) and genes (left of heatmap). (c) CRN mean fold changes in mRNA expression profile in Bd (above) and Bsal (below). The data show the normalized target gene amount in spores that were incubated with skin tissue of Tw for 2 h, 3-day-old sporangia grown in TGhL and skin tissue from chytrid-infected Tw animals relative to freshly collected spores which is considered 1. Significant differences in expression between each experimental group are shown in Supplementary Table 6.
Figure 5
Figure 5. Transcriptomes and skin histology for Tw post infection from Bsal or Bd.
(a) Skin of Tw at 10 days after exposure to Bsal (left) or Bd (right). Bsal thalli are abundantly present across the entire thickness of the epidermis (}) resulting in extensive loss of keratinocytes, whereas Bd thalli are associated with the superficial epidermal layers and hyperkeratotic foci (*). For both infections, histological evidence of an inflammatory response is lacking (Hematoxylin and eosin stain, × 400). (b) MA plots (showing Log2 fold change in the trimmed mean of M-values (TMM) normalized Fragments Per Kilobase of transcript per Million mapped reads (FPKM) vs average Log2 counts per million) of Tw transcripts during Bsal infection (left) and Bd infection (right) compared with non-infected. Significant differential expression is highlighted in blue (Bsal) and red (Bd), where FDR P value<0.001 and >fourfold change of TMM normalized FPKM. (c) Multiple classes of immune genes (x-axis) were found differentially expressed during Bd infection, while few were found during Bsal infection. The y-axis shows the number of genes either upregulated (positive count) or downregulated during infection (negative count).

References

    1. Fisher M. C. et al.. Emerging fungal threats to animal, plant and ecosystem health. Nature 484, 186–194 (2012). - PMC - PubMed
    1. Wake D. B. & Vredenburg V. T. Colloquium paper: are we in the midst of the sixth mass extinction? A view from the world of amphibians. Proc. Natl Acad. Sci. USA 105, 11466–11473 (2008). - PMC - PubMed
    1. Berger L. et al.. Chytridiomycosis causes amphibian mortality associated with population declines in the rain forests of Australia and Central America. Proc. Natl Acad. Sci. USA 95, 9031–9036 (1998). - PMC - PubMed
    1. Martel A. et al.. Batrachochytrium salamandrivorans sp. nov. causes lethal chytridiomycosis in amphibians. Proc. Natl Acad. Sci. USA 110, 15325–15329 (2013). - PMC - PubMed
    1. Fisher M. C., Garner T. W. J. & Walker S. F. Global emergence of Batrachochytrium dendrobatidis and amphibian chytridiomycosis in space, time, and host. Annu. Rev. Microbiol. 63, 291–310 (2009). - PubMed

Publication types