. 2017 Oct 15;430(2):385-396.
doi: 10.1016/j.ydbio.2017.03.010. Epub 2017 Mar 18.

Imaging early embryonic calcium activity with GCaMP6s transgenic zebrafish

Affiliations

Imaging early embryonic calcium activity with GCaMP6s transgenic zebrafish

Jiakun Chen et al. Dev Biol. .

Abstract

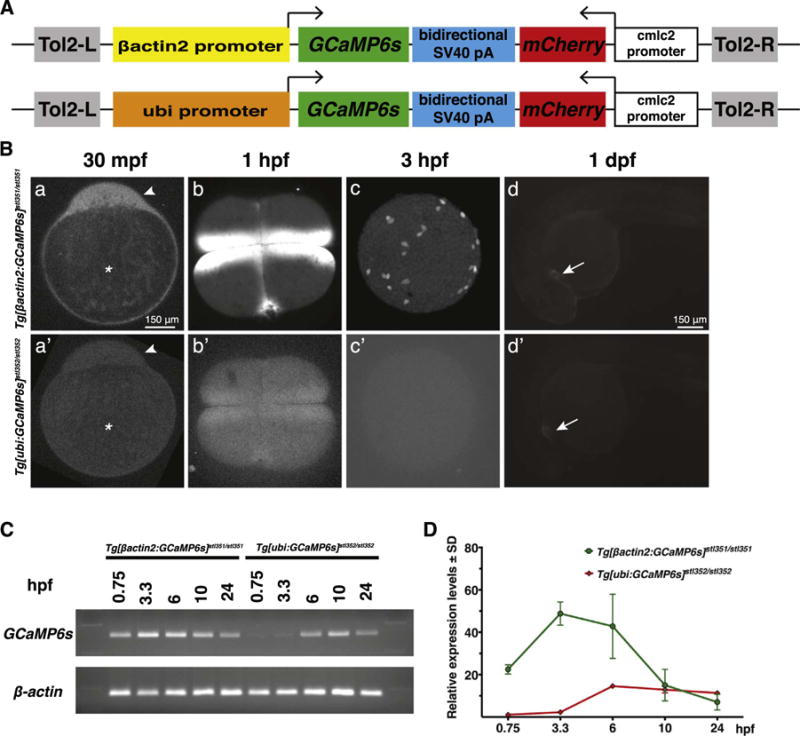
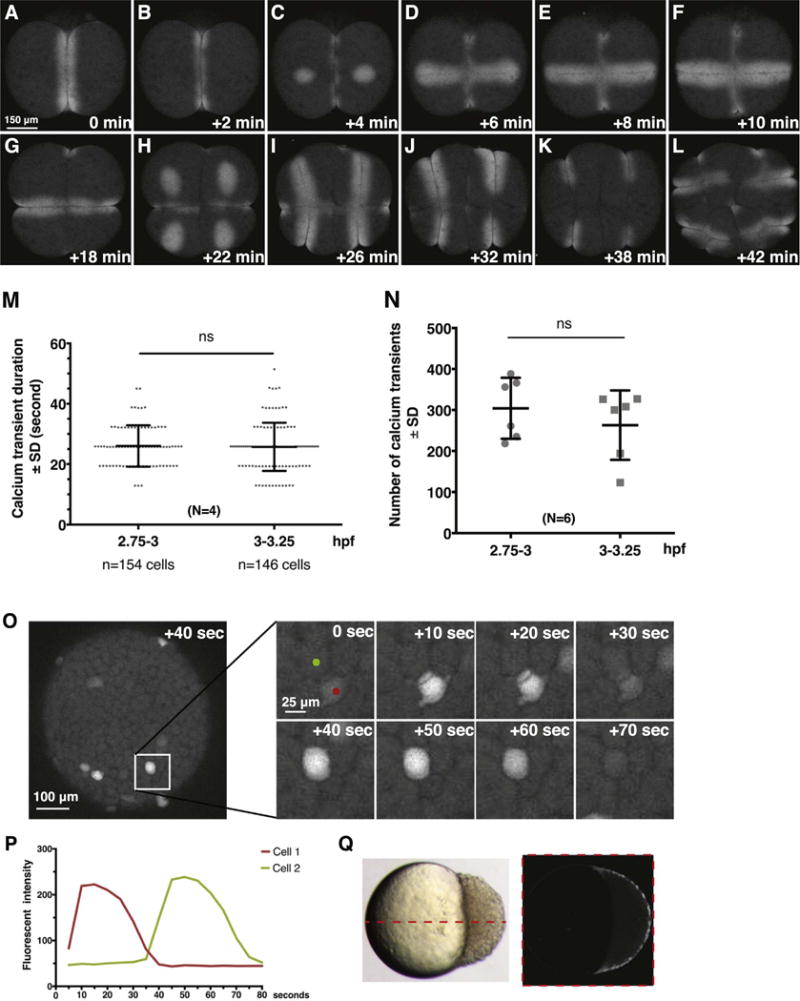
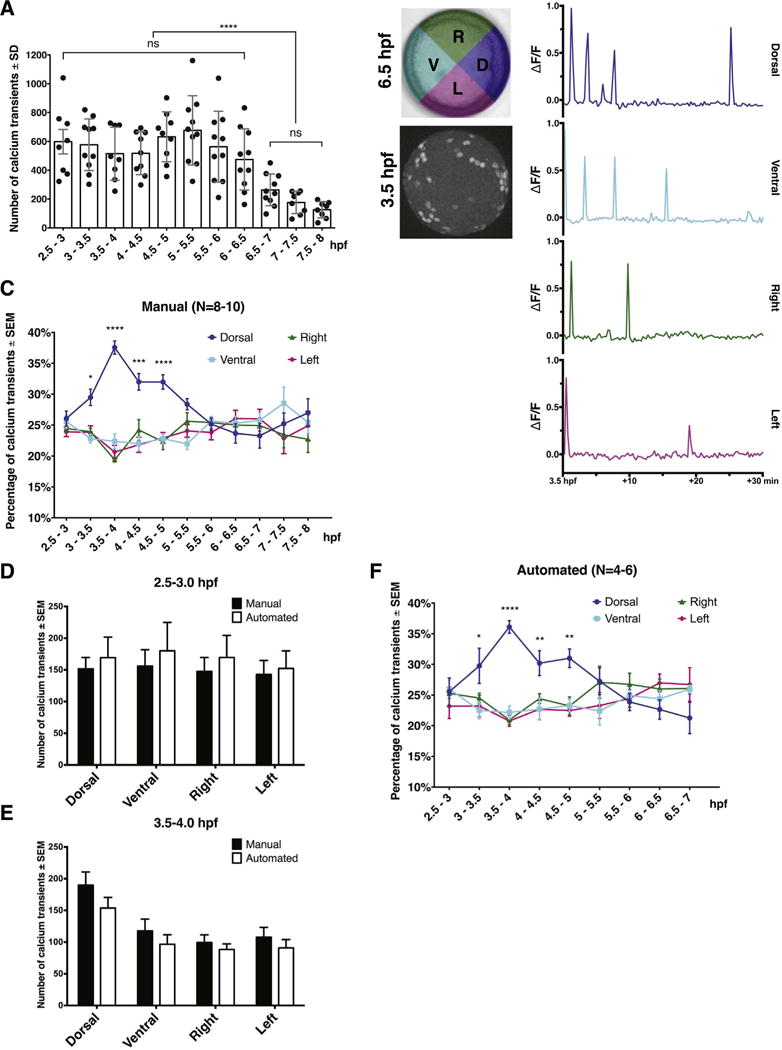
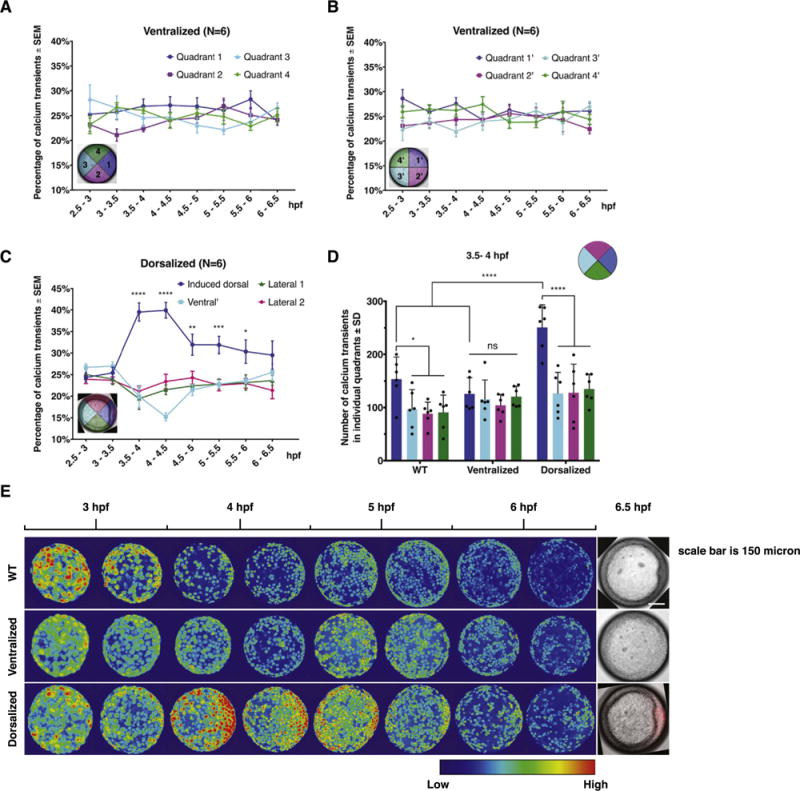
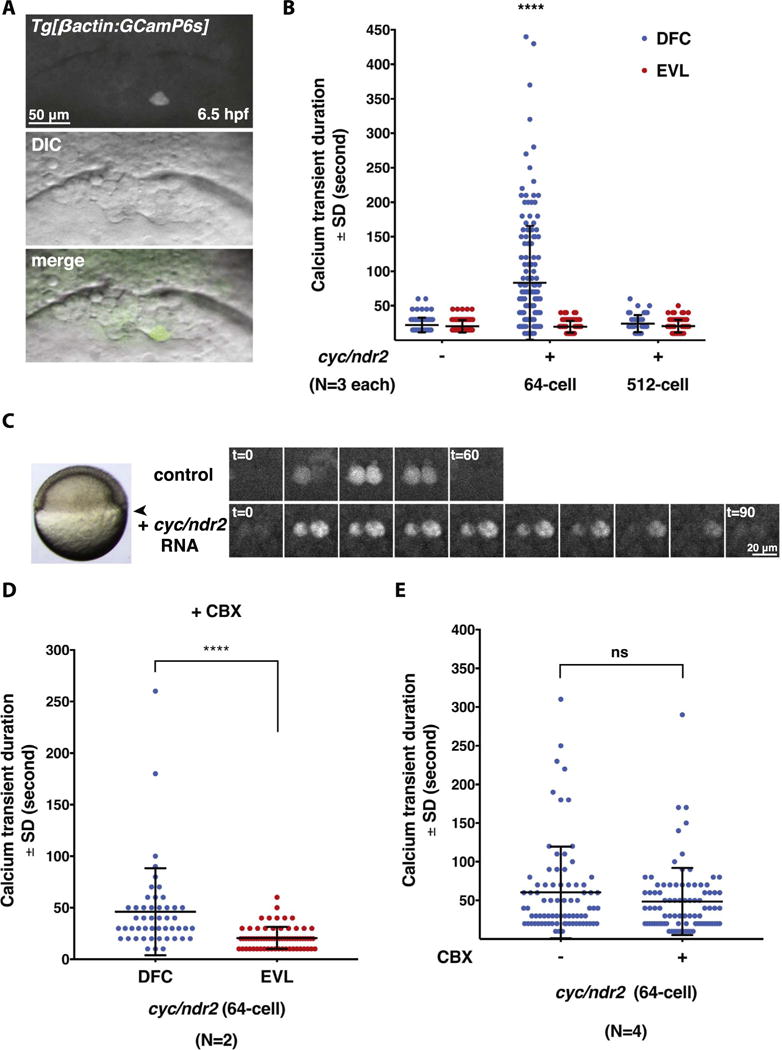
Intracellular Ca2+ signaling regulates cellular activities during embryogenesis and in adult organisms. We generated stable Tg[βactin2:GCaMP6s]stl351 and Tg[ubi:GCaMP6s]stl352 transgenic lines that combine the ubiquitously-expressed Ca2+ indicator GCaMP6s with the transparent characteristics of zebrafish embryos to achieve superior in vivo Ca2+ imaging. Using the Tg[βactin2:GCaMP6s]stl351 line featuring strong GCaMP6s expression from cleavage through gastrula stages, we detected higher frequency of Ca2+ transients in the superficial blastomeres during the blastula stages preceding the midblastula transition. Additionally, GCaMP6s also revealed that dorsal-biased Ca2+ signaling that follows the midblastula transition persisted longer during gastrulation, compared with earlier studies. We observed that dorsal-biased Ca2+ signaling is diminished in ventralized ichabod/β-catenin2 mutant embryos and ectopically induced in embryos dorsalized by excess β-catenin. During gastrulation, we directly visualized Ca2+ signaling in the dorsal forerunner cells, which form in a Nodal signaling dependent manner and later give rise to the laterality organ. We found that excess Nodal increases the number and the duration of Ca2+ transients specifically in the dorsal forerunner cells. The GCaMP6s transgenic lines described here enable unprecedented visualization of dynamic Ca2+ events from embryogenesis through adulthood, augmenting the zebrafish toolbox.

Keywords: Calcium transients; Dorsal forerunner cells; Embryonic cleavages; Gastrulation; Nodal; β-catenin.


Figures

Fig. 1
Fig. 1
GCaMP6s expression and fluorescence in Tg[βactin2:GCaMP6s]stl351/stl351 and Tg[ubi:GCaMP6s]stl352/stl352 transgenic zebrafish during early embryogenesis. (A) Schematics of the Tol2[βactin2:GCaMP6s] or Tol2[ubi:GCaMP6s] constructs. (B) GCaMP6s fluorescent confocal microscope images in Tg[βactin2:GCaMP6s]stl351/stl351 and Tg[ubi:GCaMP6s]stl352/stl352 embryos at several developmental stages. a, a′, d, d′, lateral view; b, b′, c, c′, animal pole view. Asterisks indicate the yolk, and arrowheads point to the blastodisc in a, a′. Arrows point to the heart in d, d′. (C-D) RT-PCR and qRT-PCR analyses of GCaMP6s RNA expression levels in Tg[βactin2:GCaMP6s]stl351/stl351 and Tg[ubi:GCaMP6s]stl352/stl352 embryos in the course of embryogenesis. The qRT-PCR results were normalized to β-actin. Error bars represent standard deviation; N=3.
Fig. 2
Fig. 2
Dynamics of Ca2+ signaling in Tg[βactin2:GCaMP6s]stl351/stl351 embryos at cleavage and blastula stages. (A–L) Still images of GCaMP6s signals during cleavage furrow progression from 2-cell stage to 16-cell stage. (M) Quantification of Ca2+ transient duration before and after MBT. Error bars represent standard deviation; N=4 embryos. ns, not significant. (N) Comparison of Ca2+ transient numbers before and after MBT; N=6 embryos. (O–P) Still images and traces of Ca2+ transients in a time-lapse series at blastula stages. (Q) Time-lapse overlay of GCaMP6s signal from 3.7 hpf to 4 hpf from a single z-section in lateral view.
Fig. 3
Fig. 3
Dorsal bias of the EVL Ca2+ transients from midblastula to late blastula stage. (A) Quantification of total Ca2+ transient numbers at 30-min intervals from 2.5 hpf to 8 hpf. Error bars represent standard deviation; ns, not significant. ****; P≤0.0001; N=8–10 embryos. (B) Representative Ca2+ transient traces from a single spot in each quadrant between 3.5 hpf and 4 hpf. (C) Manual quantification of Ca2+ transient frequency in four blastoderm quadrants from 2.5 hpf to 8 hpf; N=8–10 embryos. (D). Comparisons of Ca2+ transient numbers in individual quadrant between manual and automated quantifications at 2.5–3 hpf and 3.5–4 hpf. (E) Automated quantification of Ca2+ transient frequency from 2.5 hpf to 7 hpf. Error bars represent S.E.M. *, P≤0.05. ***, P≤0.001. ****, P≤0.0001; N=4–6 embryos.
Fig. 4
Fig. 4
EVL Ca2+ signaling pattern in ventralized and dorsalized embryos. (A-B) Automated quantification of EVL Ca2+ transient frequency in ichabod/β-catenin2 ventralized embryos between 2.5 hpf and 6.5 hpf. Error bars represent S.E.M.; N=6 embryos. (C) Automated quantification of EVL Ca2+ transient frequency in β-catenin1-injected dorsalized embryos. Induced dorsal organizer is oriented to the right. Error bars represent S.E.M. *, P≤0.05. **, P≤0.01***, P≤0.001. ****, P≤0.0001; N=6 embryos. (D) Comparison of Ca2+ transient number in individual quadrants among WT, ventralized, and dorsalized embryos at 3.5–4 hpf. Error bars represent standard deviation. ns, not significant. *, P≤0.05. ****, P≤0.0001; (E) Representative 30-min time-lapse overlay of GCaMP6s signals in WT, ventralized, and dorsalized embryos from 2.5 hpf to 6.5 hpf.
Fig. 5
Fig. 5
Excess Nodal signaling prolongs Ca2+ transient duration specifically in the DFCs. (A) Representative images of a single Ca2+ transient in a DFC at 6.5 hpf. (B) Quantification of Ca2+ transient duration in WT and Cyc/Ndr2-misexpressing embryos. Error bars represent standard deviation. ****, P≤0.0001. N=3 embryos in control and Cyc/Ndr2-misexpressing embryos, respectively. (C) Still images of Ca2+ transients in the DFCs of uninjected control and Cyc/Ndr2-misexpressing embryo in a time-lapse series. Arrowhead points to the DFC region that was imaged. (D) Quantification of DFC Ca2+ transient duration between DFCs and EVL cells in cyc/ndr2 RNA-injected embryos after CBX treatment. ****, P≤0.0001. N=2 embryos. (E) Quantification of DFC Ca2+ transient duration in Cyc/Ndr2-misexpressing embryos before and after CBX treatment. ns, not significant; N=4 embryos.

References

    1. Aanes H, Winata CL, Lin CH, Chen JP, Srinivasan KG, Lee SG, Lim AY, Hajan HS, Collas P, Bourque G, et al. Zebrafish mRNA sequencing deciphers novelties in transcriptome dynamics during maternal to zygotic transition. Genome Res. 2011;21:1328–1338. - PMC - PubMed
    1. Amack JD, Yost HJ. The T box transcription factor no tail in ciliated cells controls zebrafish left-right asymmetry. Curr Biol: CB. 2004;14:685–690. - PubMed
    1. Berridge MJ. Inositol trisphosphate and calcium signalling. Nature. 1993;361:315–325. - PubMed
    1. Berridge MJ, Bootman MD, Roderick HL. Calcium signalling: dynamics, homeostasis and remodelling. Nat Rev Mol Cell Biol. 2003;4:517–529. - PubMed
    1. Blaser H, Reichman-Fried M, Castanon I, Dumstrei K, Marlow FL, Kawakami K, Solnica-Krezel L, Heisenberg CP, Raz E. Migration of zebrafish primordial germ cells: a role for myosin contraction and cytoplasmic flow. Dev Cell. 2006;11:613–627. - PubMed

Publication types

MeSH terms

LinkOut - more resources