. 2017 Jun;112(6):913-923.
doi: 10.1038/ajg.2017.48. Epub 2017 Mar 21.

Constipation-Predominant Irritable Bowel Syndrome Females Have Normal Colonic Barrier and Secretory Function

Affiliations

Constipation-Predominant Irritable Bowel Syndrome Females Have Normal Colonic Barrier and Secretory Function

Stephanie A Peters et al. Am J Gastroenterol. 2017 Jun.

Abstract

Objectives: The objective of this study was to determine whether constipation-predominant irritable bowel syndrome (IBS-C) is associated with changes in intestinal barrier and secretory function.

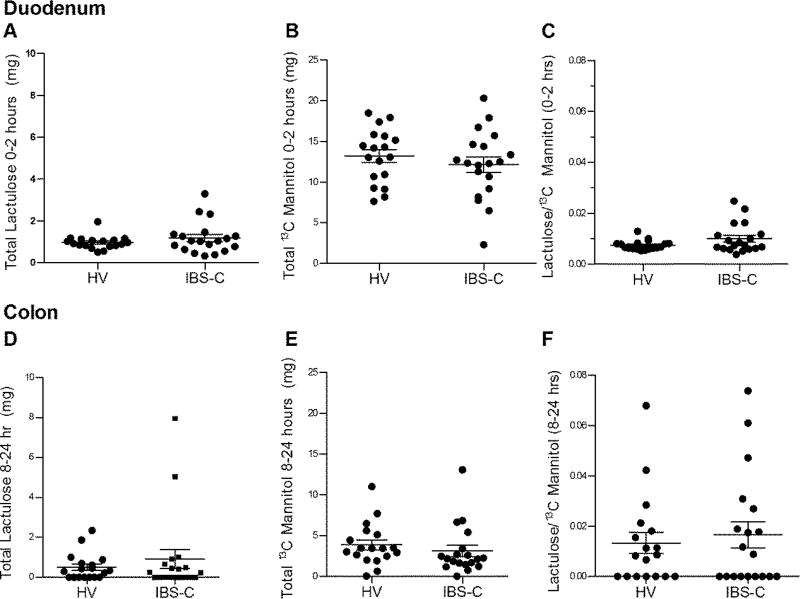
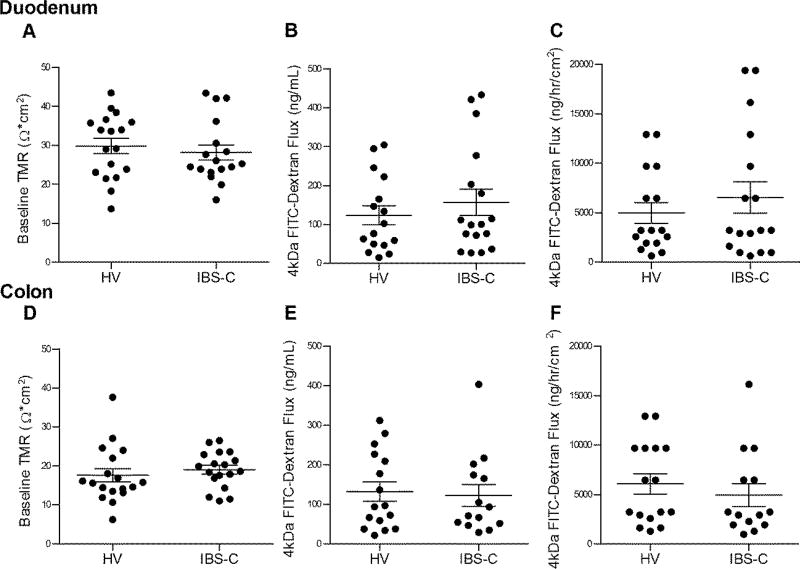
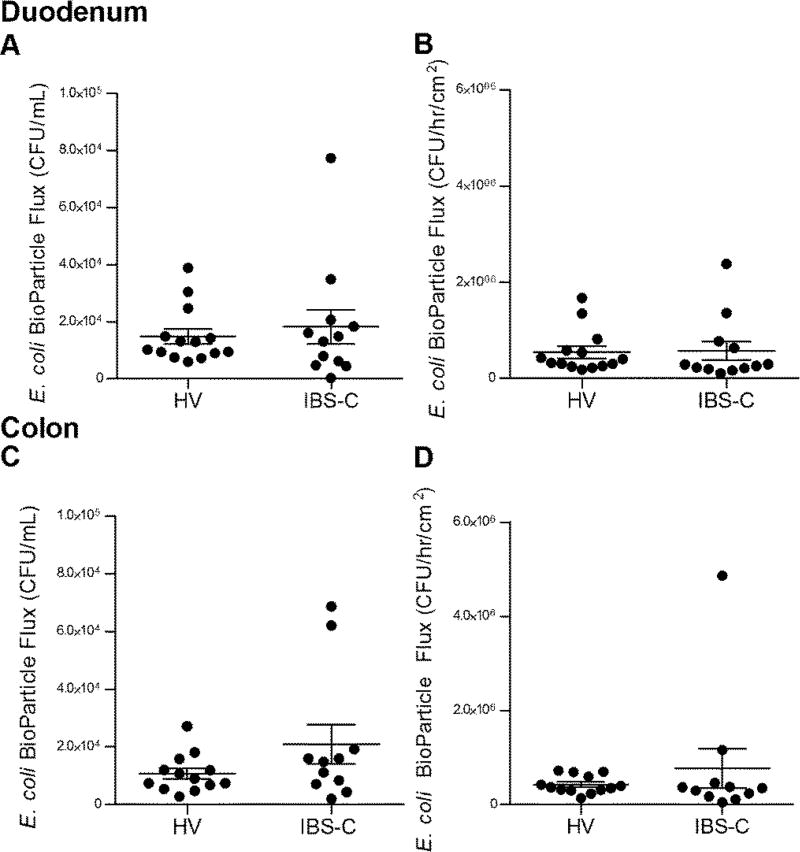
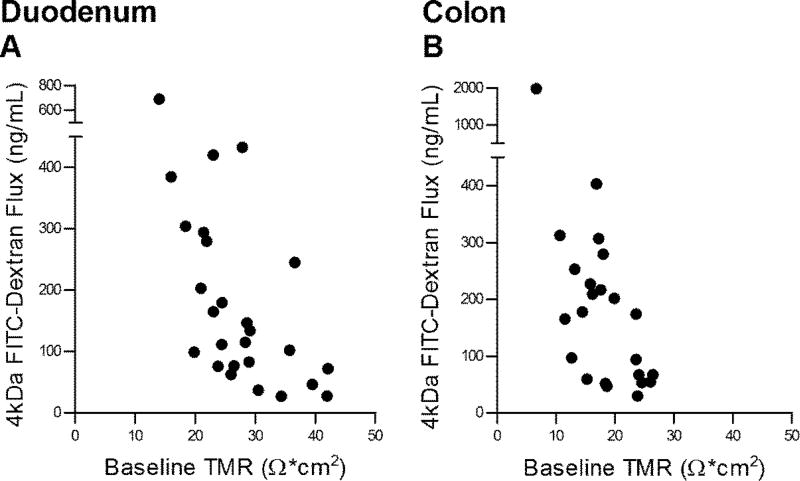
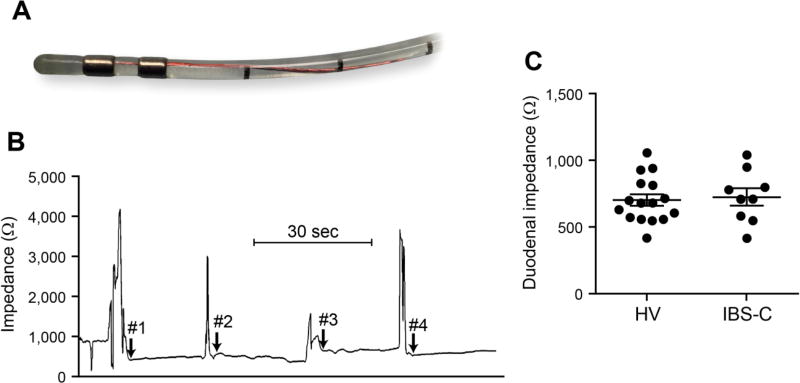
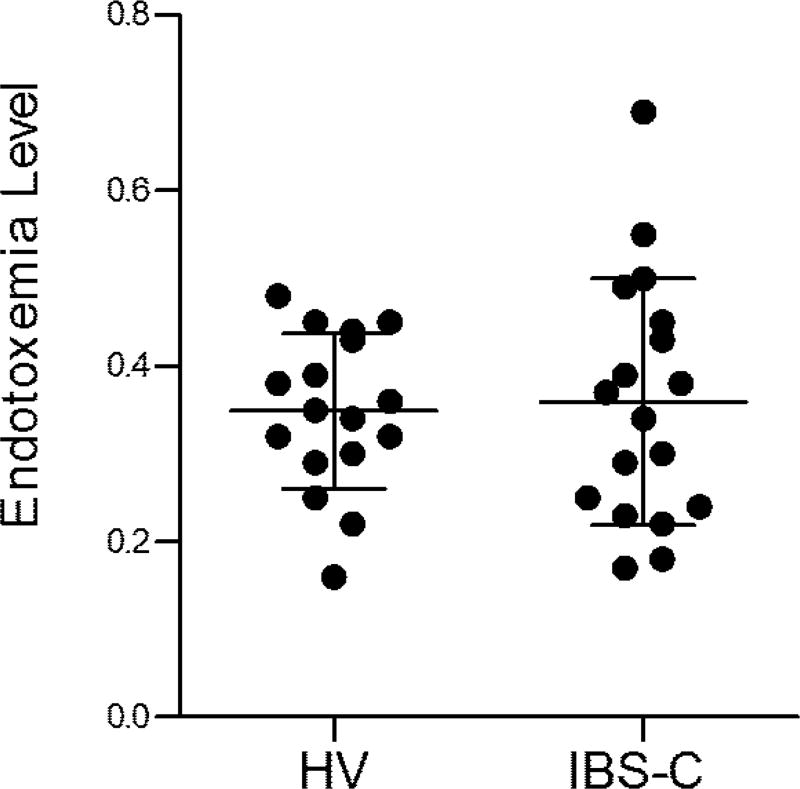
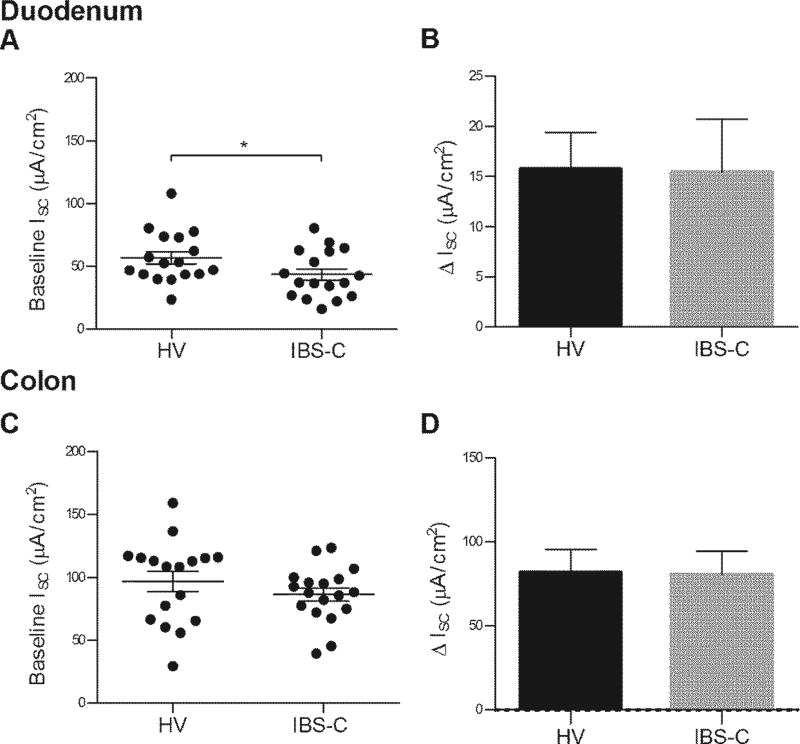
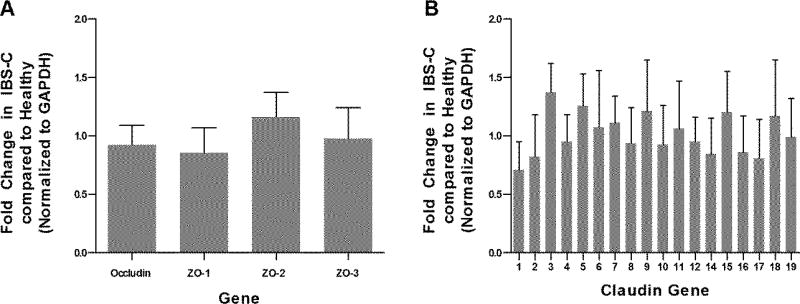
Methods: A total of 19 IBS-C patients and 18 healthy volunteers (all females) underwent saccharide excretion assay (0.1 g 13C mannitol and 1 g lactulose), measurements of duodenal and colonic mucosal barrier (transmucosal resistance (TMR), macromolecular and Escherichia coli Bio-Particle translocation), mucosal secretion (basal and acetylcholine (Ach)-evoked short-circuit current (Isc)), in vivo duodenal mucosal impedance, circulating endotoxins, and colonic tight junction gene expression.

Results: There were no differences in the in vivo measurements of barrier function between IBS-C patients and healthy controls: cumulative excretion of 13C mannitol (0-2 h mean (s.e.m.); IBS-C: 12.1 (0.9) mg vs. healthy: 13.2 (0.8) mg) and lactulose (8-24 h; IBS-C: 0.9 (0.5) mg vs. healthy: 0.5 (0.2) mg); duodenal impedance IBS-C: 729 (65) Ω vs. healthy: 706 (43) Ω; plasma mean endotoxin activity level IBS-C: 0.36 (0.03) vs. healthy: 0.35 (0.02); and in colonic mRNA expression of occludin, zonula occludens (ZO) 1-3, and claudins 1-12 and 14-19. The ex vivo findings were consistent, with no group differences: duodenal TMR (IBS-C: 28.2 (1.9) Ω cm2 vs. healthy: 29.8 (1.9) Ω cm2) and colonic TMR (IBS-C: 19.1 (1.1) Ω cm2 vs. healthy: 17.6 (1.7) Ω cm2); fluorescein isothiocyanate (FITC)-dextran (4 kDa) and E. coli Bio-Particle flux. Colonic basal Isc was similar, but duodenal basal Isc was lower in IBS-C (43.5 (4.5) μA cm-2) vs. healthy (56.9 (4.9) μA cm-2), P=0.05. Ach-evoked ΔIsc was similar.

Conclusions: Females with IBS-C have normal colonic barrier and secretory function. Basal duodenal secretion is decreased in IBS-C.


Conflict of interest statement

Competing Interests: None to declare

Figures

Figure 1
Figure 1
In vivo permeability assessment using saccharide excretion assay. Panels (A–C) reflect small intestine (0–2 hours post-test saccharide administration) and (D–F) reflect colon (8–24 hours post-test saccharide administration). (A) Cumulative lactulose excretion. (B) Cumulative 13C mannitol excretion. (C) Lactulose/13C mannitol ratio expressed as percentage of administered dose for each volunteer. Panels D–F are corresponding cumulative excretion values and Lactulose/13C mannitol ratio for colon. Data are presented as mean ± SEM. HV n=18, IBS-C n =19.
Figure 2
Figure 2
Ex vivo permeability assessment. (A) Baseline transmucosal resistance (TMR) of duodenal mucosa. (B) Cumulative FITC-Dextran (4kDa) concentration across duodenal mucosa measured after 180 min. (C) Rate of FITC-Dextran (4kDa) flux across duodenal mucosa, per exposed biopsy area, over time. Panels D–F are corresponding values for colonic mucosa. Data are presented as mean ± SEM. Duodenum HV n=18, IBS-C n=17 (A); HV n=16, IBS-C n=17 (B, C). Colon HV and IBS-C n=18 (D); HV n=16, IBS-C n =14 (E, F).
Figure 3
Figure 3
Ex vivo bacterial translocation. (A) Cumulative fluorescein conjugated E. coli Bio- Particle concentration in CFUs across duodenal mucosa, measured after 180 minutes. HV n =14, IBS-C n=12. (B) Rate of E. coli Bio-Particle Flux in CFUs across duodenal biopsies, per exposed area, per time. Panels C and D are corresponding values for colonic mucosa. HV n= 16, IBS-C n=14.
Figure 4
Figure 4
Correlations between baseline transmucosal resistance (TMR) and FITC-Dextran Flux (4kDa) across the same biopsies. (A) Correlation between baseline duodenal TMR and 3 hr cumulative submucosal FITC-Dextran (4kDa) concentration. Pearson’s correlation coefficient = −0.57, p<0.0006. Number of XY pairs=32. (B) Correlation between baseline colonic TMR and 3 hr cumulative submucosal FITC-Dextran (4kDa) concentration. Pearson’s correlation coefficient = −0.58, p<0.0012. Number of XY pairs=28. HV and IBS-C biopsy data were combined. A p-value of <0.05 was considered significant.
Figure 5
Figure 5
Duodenal impedance. (A) Mucosal impedance catheter tip; (B) Representative tracing with arrows representing start of impedance recordings on medial, superior, lateral and inferior duodenal walls with direct mucosal contact under endoscopic visualization; (C) Four measurements obtained for each subject and plotted values represent averages of the four recordings. Data are presented as mean ± SEM. HV n=16, IBS-C n=9.
Figure 6
Figure 6
Endotoxemia levels. Bacterial lipopolysaccharide levels in anti-coagulated whole blood. Data are presented as mean ± SEM. HV n=17, IBS-C n=18.
Figure 7
Figure 7
Mucosal secretory responses. (A) Baseline duodenal short circuit current (Isc) of healthy and IBS-C participants. HV n=17, IBS-C n=17 (B) Duodenal ΔIsc in response to 0.0003M submucosal ACh. HV n=17, IBS-C n=18. Panels C (HV n=14, IBS-C n=12) and D (HV n=18, IBS-C n=17) are corresponding values for colonic mucosa.
Figure 8
Figure 8
Abundance of colonic mucosal expression of (A) Occludin, ZO-1, 2, 3; (B) Claudin 1–12, and 14–19 in IBS-C in comparison to healthy. HV n=10, IBS-C n=18. Genes were normalized by arithmetic mean to the control gene, GAPDH. Error bars represent 95% CI.

References

    1. Enck P, Aziz Q, Barbara G, et al. Irritable bowel syndrome. Nat Rev Dis Primers. 2016;2:16014. - PMC - PubMed
    1. Piche T. Tight junctions and IBS--the link between epithelial permeability, low-grade inflammation, and symptom generation? Neurogastroenterol Motil. 2014;26:296–302. - PubMed
    1. Piche T, Barbara G, Aubert P, et al. Impaired intestinal barrier integrity in the colon of patients with irritable bowel syndrome: involvement of soluble mediators. Gut. 2009;58:196–201. - PubMed
    1. Vivinus-Nebot M, Dainese R, Anty R, et al. Combination of allergic factors can worsen diarrheic irritable bowel syndrome: role of barrier defects and mast cells. Am J Gastroenterol. 2012;107:75–81. - PubMed
    1. Annahazi A, Ferrier L, Bezirard V, et al. Luminal cysteine-proteases degrade colonic tight junction structure and are responsible for abdominal pain in constipation-predominant IBS. Am J Gastroenterol. 2013;108:1322–31. - PubMed

MeSH terms