

Histology and Gadolinium Distribution in the Rodent Brain After the Administration of Cumulative High Doses of Linear and Macrocyclic Gadolinium-Based Contrast Agents
- PMID: 28323657
- PMCID: PMC5417580
- DOI: 10.1097/RLI.0000000000000344
Histology and Gadolinium Distribution in the Rodent Brain After the Administration of Cumulative High Doses of Linear and Macrocyclic Gadolinium-Based Contrast Agents
Abstract
Objectives: Retrospective studies in patients with primary brain tumors or other central nervous system pathologies as well as postmortem studies have suggested that gadolinium (Gd) deposition occurs in the dentate nucleus (DN) and globus pallidus (GP) after multiple administrations of primarily linear Gd-based contrast agents (GBCAs). However, this deposition has not been associated with any adverse effects or histopathological alterations. The aim of this preclinical study was to systematically examine differences between linear and macrocyclic GBCAs in their potential to induce changes in brain and skin histology including Gd distribution in high spatial resolution.
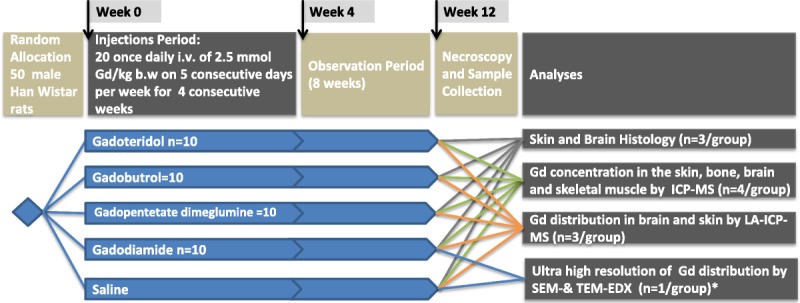
Materials and methods: Fifty male Wistar-Han rats were randomly allocated into control (saline, n = 10 rats) and 4 GBCA groups (linear GBCAs: gadodiamide and gadopentetate dimeglumine, macrocyclic GBCAs: gadobutrol and gadoteridol; n = 10 rats per group). The animals received 20 daily intravenous injections at a dose of 2.5 mmol Gd/kg body weight. Eight weeks after the last GBCA administration, the animals were killed, and the brain and skin samples were histopathologically assessed (hematoxylin and eosin; cresyl violet [Nissl]) and by immunohistochemistry. The Gd concentration in the skin, bone, brain, and skeletal muscle samples were analyzed using inductively coupled plasma mass spectroscopy (ICP-MS, n = 4). The spatial Gd distribution in the brain and skin samples was analyzed in cryosections using laser ablation coupled with ICP-MS (LA-ICP-MS, n = 3). For the ultra-high resolution of Gd distribution, brain sections of rats injected with gadodiamide or saline (n = 1) were assessed by scanning electron microscopy coupled to energy dispersive x-ray spectroscopy and transmission electron microscopy, respectively.
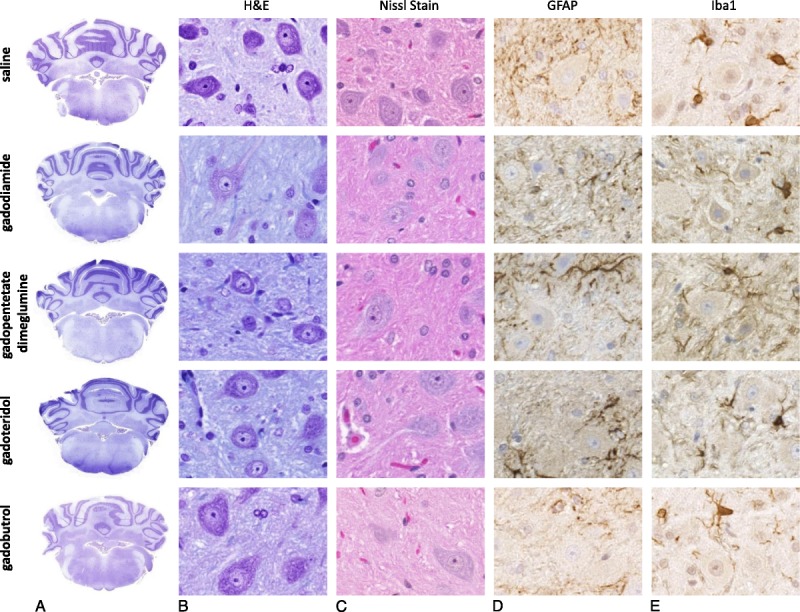
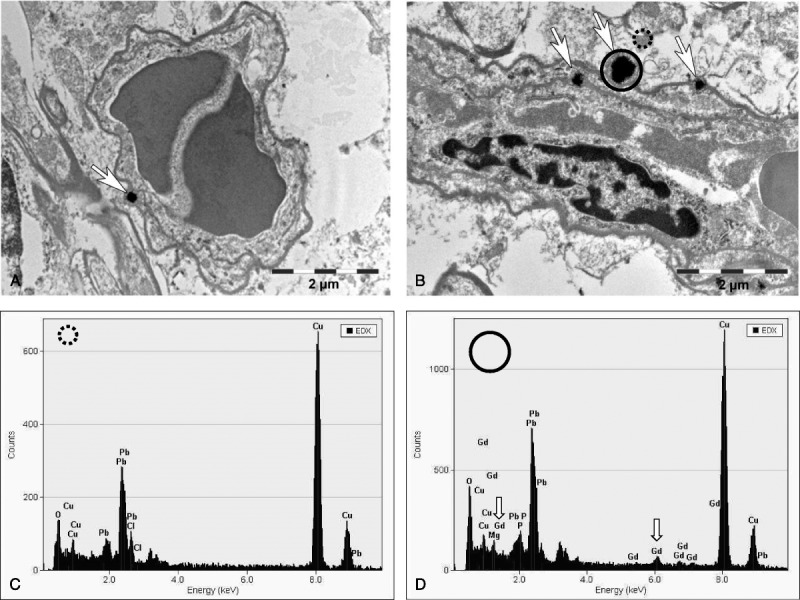
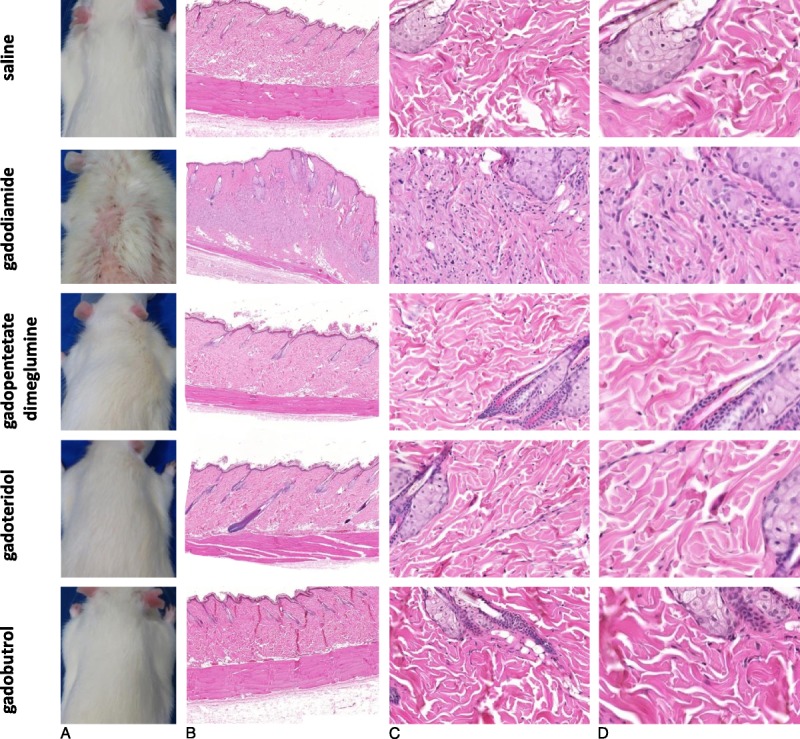
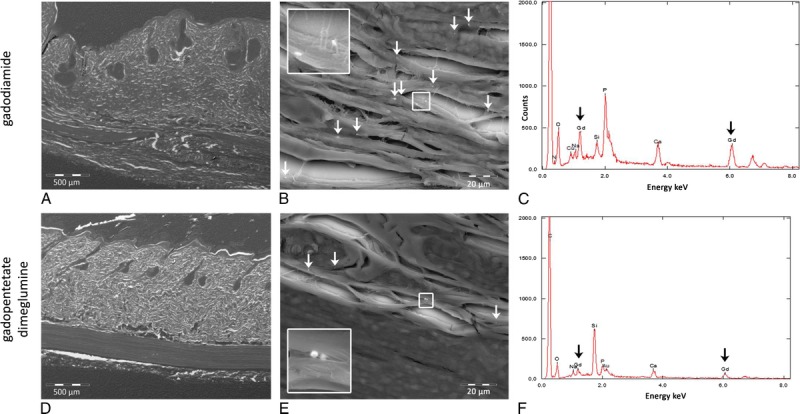
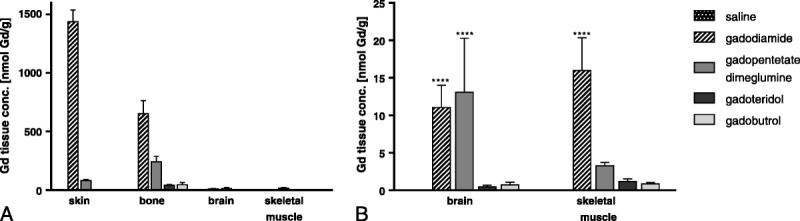
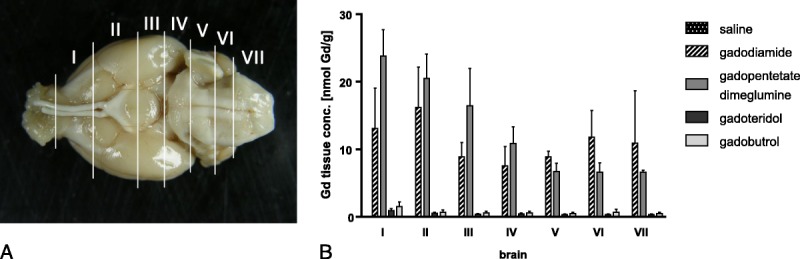
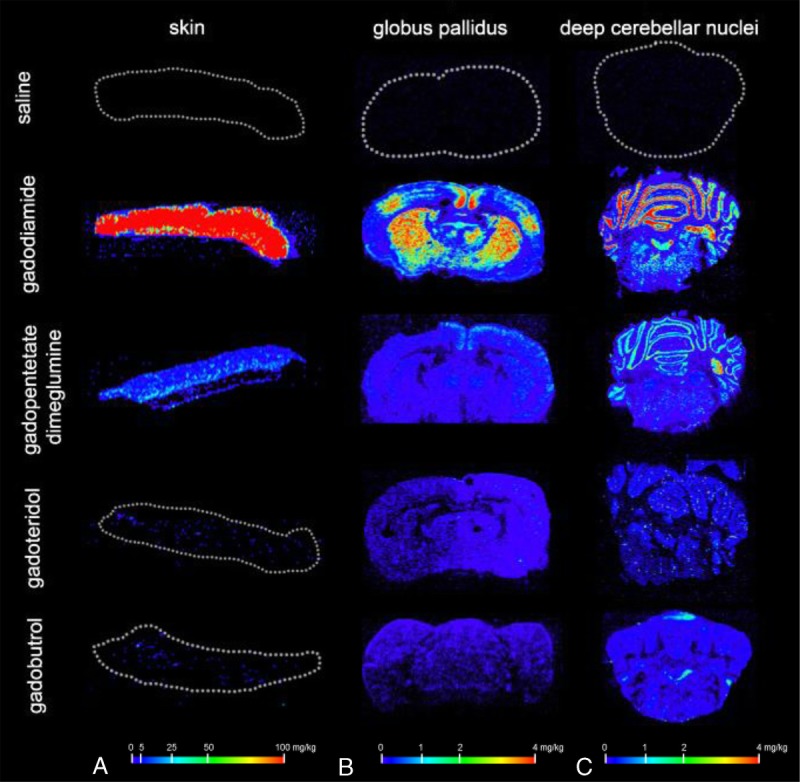
Results: No histological changes were observed in the brain. In contrast, 4 of 10 animals in the gadodiamide group but none of the animals in other groups showed macroscopic and histological nephrogenic systemic fibrosis-like skin lesions. The Gd concentrations observed in the skin/brain samples (in nanomole Gd per gram of tissue) for each agent were as follows: gadodiamide: 1472 ± 115/11.1 ± 5.1, gadopentetate dimeglumine: 80.8 ± 6.2/13.1 ± 7.3, gadobutrol: 1.1 ± 0.5/0.7 ± 0.4, and gadoteridol: 1.7 ± 0.8/0.5 ± 0.2. The average detected residual Gd concentration in the brain was approximately 15-fold higher for linear than for macrocyclic GBCAs. The highest amounts of Gd found in brain corresponded to less than 0.0002% of the injected dose per gram of tissue. Using LA-ICP-MS, high Gd concentrations in the deep cerebellar nuclei and in the granular layer of the cerebellar cortex were detected only for linear gadodiamide and gadopentetate dimeglumine but not for gadoteridol or gadobutrol. The energy dispersive x-ray spectroscopy analysis revealed Gd-containing spots in the skin of animals administered gadodiamide and gadopentetate dimeglumine. Transmission electron microscopy revealed several Gd-containing spots in the region of the dentate nuclei in the brain of 1 animal injected with gadodiamide.
Conclusions: After repeated high dosing, nephrogenic systemic fibrosis-like macroscopic and histopathological lesions of the skin were observed only in some of the gadodiamide-treated animals. No histopathological findings were detected in the rodent brain. The administration of linear GBCAs was associated with significantly higher Gd concentrations in the brain and skin compared with macrocyclic GBCA administration. The results of LA-ICP-MS demonstrated local accumulation of Gd within the deep cerebellar nuclei and the granular layer only after the administration of linear agents. In summary, the detected low Gd concentrations in the skin and brain were well correlated with the higher kinetic stability of macrocyclic GBCA.
Conflict of interest statement
Conflicts of interest and sources of funding: J.L., A.L.F., T.F., L.S., G.J., M.R., and M.A.S. are employees of Bayer AG. D.C.L. received a research grant from Bayer AG. Forschungsinstitut Juelich GmbH received a grant for Laser ablation-ICP-MS measurements contractually settled in a laboratory service agreement.
Figures
References
-
- Frenzel T, Lengsfeld P, Schirmer H, et al. Stability of gadolinium-based magnetic resonance imaging contrast agents in human serum at 37 degrees C. Invest Radiol. 2008;43:817–828. - PubMed
-
- Sieber MA, Lengsfeld P, Frenzel T, et al. Preclinical investigation to compare different gadolinium-based contrast agents regarding their propensity to release gadolinium in vivo and to trigger nephrogenic systemic fibrosis-like lesions. Eur Radiol. 2008;18:2164–2173. - PubMed
-
- Morcos SK. Nephrogenic systemic fibrosis following the administration of extracellular gadolinium based contrast agents: is the stability of the contrast agent molecule an important factor in the pathogenesis of this condition? Br J Radiol. 2007;80:73–76. - PubMed
-
- Khurana A, Runge VM, Narayanan M, et al. Nephrogenic systemic fibrosis: a review of 6 cases temporally related to gadodiamide injection (Omniscan). Invest Radiol. 2007;42:139–145. - PubMed
MeSH terms
Substances
LinkOut - more resources
Full Text Sources
Other Literature Sources
