. 2017 Mar 21;15(3):e2001882.
doi: 10.1371/journal.pbio.2001882. eCollection 2017 Mar.

Selective stalling of human translation through small-molecule engagement of the ribosome nascent chain

Affiliations

Selective stalling of human translation through small-molecule engagement of the ribosome nascent chain

Nathanael G Lintner et al. PLoS Biol. .

Erratum in

Abstract

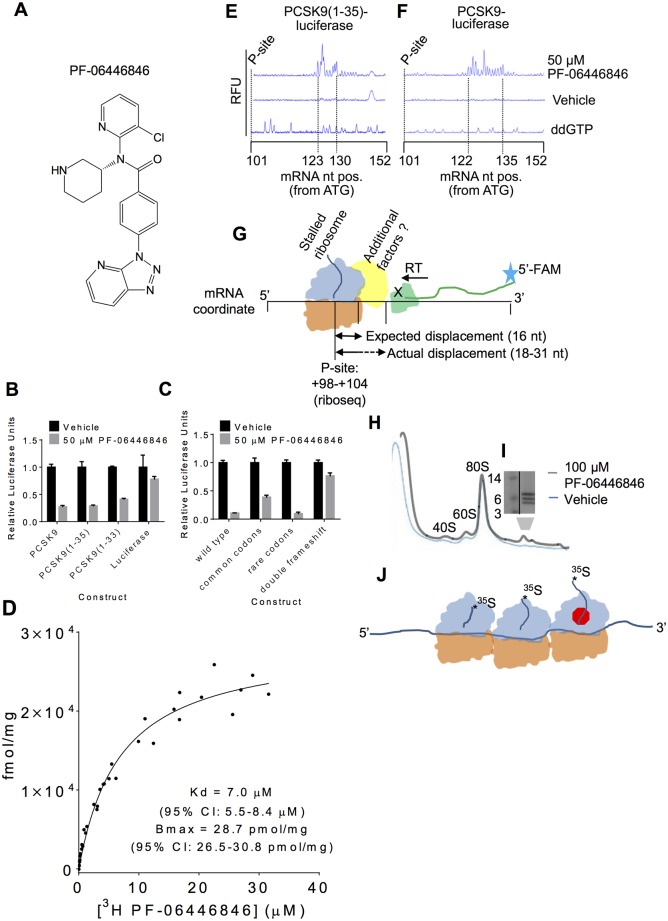
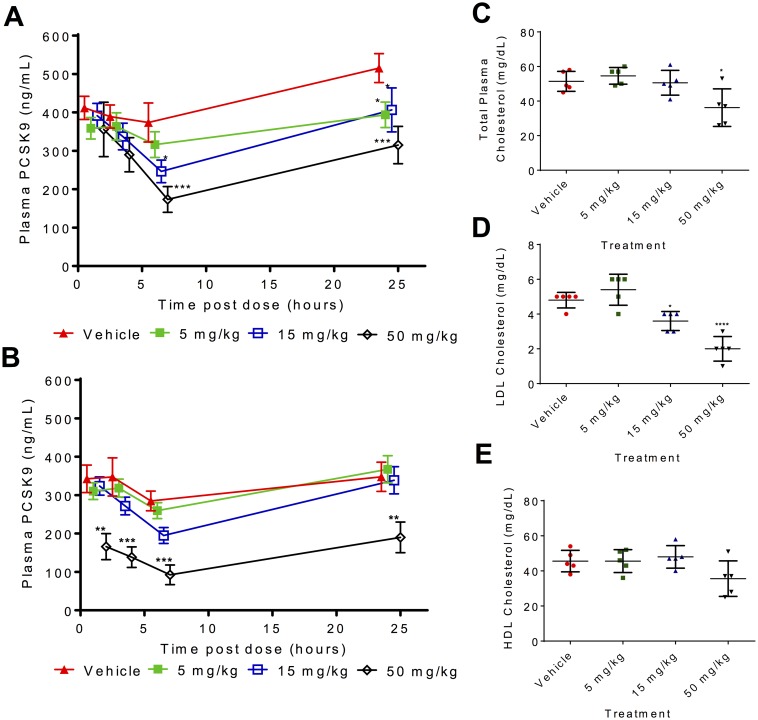
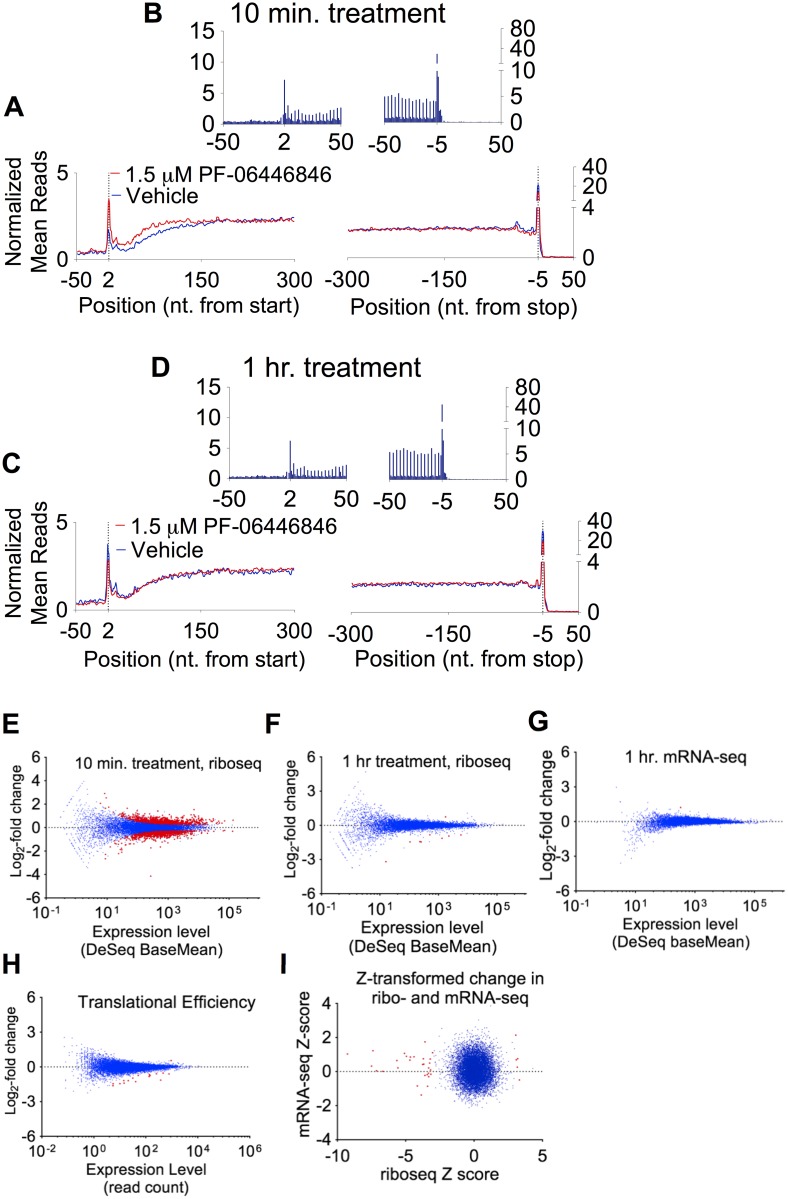
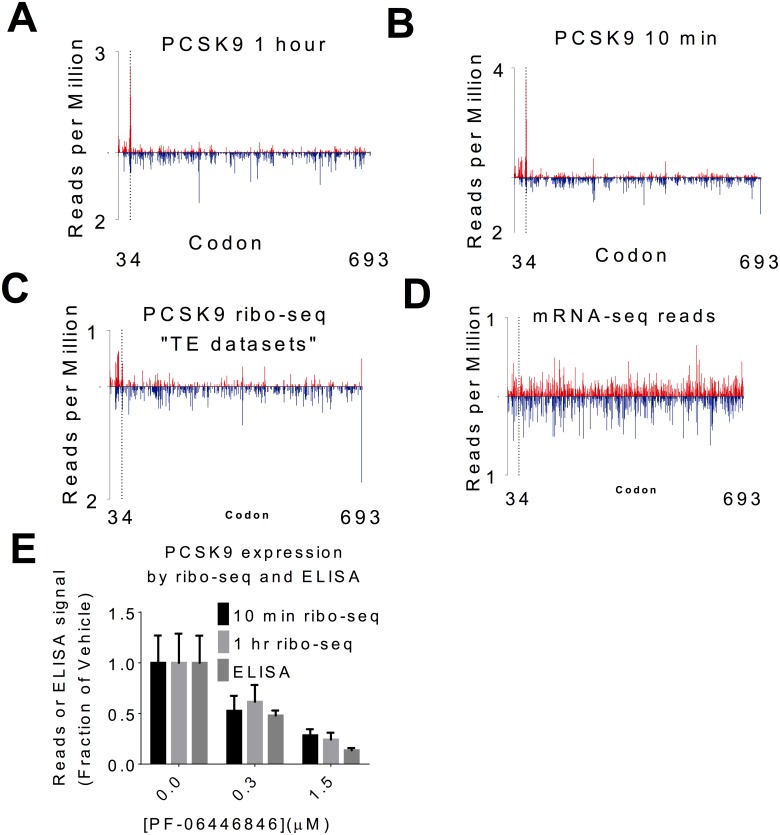
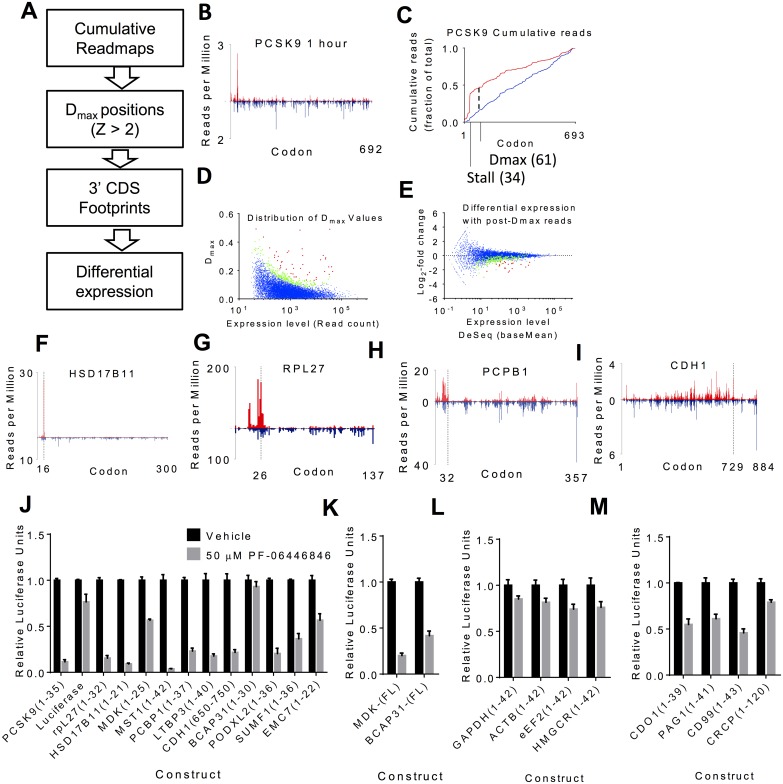
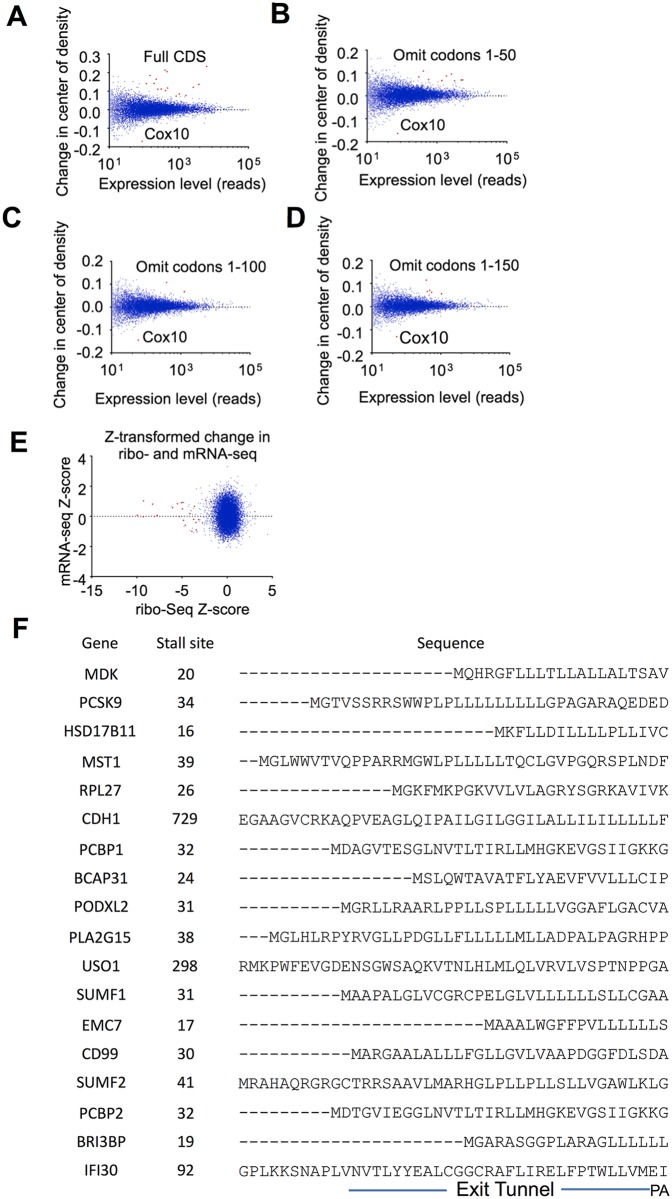
Proprotein convertase subtilisin/kexin type 9 (PCSK9) plays a key role in regulating the levels of plasma low-density lipoprotein cholesterol (LDL-C). Here, we demonstrate that the compound PF-06446846 inhibits translation of PCSK9 by inducing the ribosome to stall around codon 34, mediated by the sequence of the nascent chain within the exit tunnel. We further show that PF-06446846 reduces plasma PCSK9 and total cholesterol levels in rats following oral dosing. Using ribosome profiling, we demonstrate that PF-06446846 is highly selective for the inhibition of PCSK9 translation. The mechanism of action employed by PF-06446846 reveals a previously unexpected tunability of the human ribosome that allows small molecules to specifically block translation of individual transcripts.


Conflict of interest statement

NGL, DP, AL, DWP, LW, JX, MB, PML, BM, KFG, AH, KFM, RGD, and SL are employees of Pfizer, Inc.

Figures

Fig 1
Fig 1. PF-06446846 targets the human ribosome, inducing stalling during proprotein convertase subtilisin/kexin type 9 (PCSK9) translation.
(A) Structure of PF-06446846. (B) Luciferase activity of HeLa-based cell-free translation reactions programmed with mRNAs encoding PCSK9-luciferase, PCSK9(1–35)-luciferase, and PCSK9(1–33)-luciferase fusions and luciferase alone in the absence (black bars) or presence (grey bars) of 50 μM PF-06446846. All error bars represent one standard deviation of three replicates. (C) PF-06446846 sensitivity dependence on the amino acid sequence of PCSK9(1–33). PCSK9-luciferase fusions encode the native PCSK9 amino acid sequence with common codons or rare codons or a native, double-frameshifted mRNA sequence that results in a changed amino acid sequence (See S1E Fig for sequences). All error bars represent one standard deviation of three replicates. (D) 3H-PF-06446846 binding to purified human ribosomes, Kd: 7.0 μM (95% CI: 5.5–8.4) Bmax: 28.7 pmol/mg (95% CI: 26.5–30.8). The symbols within the graph represent the individual measurements obtained from three independent experiments. Bmax and Kd values were calculated using GraphPad PRISM, in which the complete (n = 3) dataset was fit to the one site-specific binding equation. (E–F) Electrophoreograms of toeprints of stalled ribosomes on the (E) PCSK9(1–35)-luciferase fusion construct and (F) full-length PCSK9-luciferase fusion. The nucleotide (nt) positions from the “A” of the ATG initiation codon of the first and last of the group of toeprinting peaks are indicated. The expected position of the P-site of the stalled ribosome from ribosome profiling is also indicated. (G) Schematic of ribosomal toeprinting assays. 5ʹ 6-FAM labeled primers are extended by reverse transcriptase, which terminates when blocked by a ribosome. In this case, we also hypothesize that additional factors may be bound to the stalled ribosome, obstructing the reverse transcriptase at more 3ʹ positions and over a broader range of positions then what is normally observed [13]. (H) Sucrose density gradient profiles of cell-free translation reactions programmed with an mRNA encoding an N-terminally extended PCSK9 in the presence of 100 μM PF-06446846 (grey) and vehicle (blue). (I) Tris-Tricine SDS-PAGE gels showing 35S-Met-labelled peptides that sediment in the polysome region of the gradient. (J) Model of the species isolated by density gradient centrifugation containing one stalled ribosome and two queued ribosomes. The individual quantitative observations that underlie Fig 1B–D are in S14 Table.
Fig 2
Fig 2. Oral administration of PF-06446846 reduces plasma proprotein convertase subtilisin/kexin type 9 (PCSK9) and total cholesterol levels in rats.
(A–B) Plasma PCSK9 levels following (A) a single and (B) 12 daily oral doses of PF-06446848. Rats were administered the indicated dose of PF-06446846, and plasma concentrations of PCSK9 were measured by commercial ELISA at 1, 3, 6, and 24 h after dosing (A) or the 12th daily dose (B). Symbols represent mean concentration ± standard error and were jittered to provide a clearer graphical representation. Data were analyzed using a mixed model repeated measure (MMRM) with treatment, day, and hour as fixed factors; treatment by day and hour as an interaction term; and animal as a random factor. The significance level was set at a level of 5%. No adjustment for multiple comparisons was used. *p ≤ 0.05, **p ≤ 0.01, ***p ≤ 0.001. (C–E) Total plasma (C), low-density lipoprotein (LDL) (D), and high-density lipoprotein (HDL) (E) cholesterol levels in rats measured 24 h following 14 daily oral doses of PF-06446846. Symbols represent individual animal values. The middle horizontal bar represents the group mean ± standard deviation. Difference between group means relative to vehicle was performed by a one-way ANOVA followed by a Dunnett’s multiple comparisons test; * p ≤ 0.05, **** p ≤ 0.0001. The individual quantitative observations that underlie Fig 2 are in S14 Table.
Fig 3
Fig 3. PF-06446846 does not cause widespread ribosomal stalling.
(A–D) Metagene plots showing the normalized mean read counts at the nucleotide (nt) positions relative to the start and stop sites for cells treated with 1.5 μM PF-06446846 (red trace) and vehicle (blue trace) for (A–B) 10-min treatment and (C–D) 1-h treatment. In panels A–D, reads positions are displayed according to the inferred ribosomal P-site [19]. In panels A and C, the values are averaged over three nucleotides for clarity. Panels B and D represent zoomed views of the treatment datasets only to show three-nucleotide periodicity and preferential mapping to coding DNA sequence (CDS) regions, the hallmark features of ribosome profiling data. The normalized mean reads (NMR) were calculated as in [20]. The normalized read count at a given position on a particular mRNA is the number of reads aligning to that position divided by the average read density along the CDS. These values are then averaged across all transcripts of sufficient length. (E–G) Log2-fold change in the number of reads mapping to a given gene plotted against overall expression level of that gene as calculated by DeSeq. (E) 10-min treatments, (F) 1-h treatments, (G) mRNA-seq datasets for the translational efficiency (TE) data. Genes with a significant (false discovery rate [FDR] < 10%) change in expression are highlighted in red. (H–I) Changes in expression level are primarily due to changes in translation, not transcript levels. (H) Changes in TE plotted against expression level (read count). Red points indicate outliers (expression-level Z-score > 3.0) [22]. All changes in TE with Z-score > 3 are decreases. (I) Z-score–transformed change in ribo-seq read counts upon PF-06446846 treatment, plotted against the Z-score–transformed change in mRNA-seq read counts. The outliers (red) are spread solely along the x-axis, consistent with PF-06446846 expression level changes occurring primarily at the level of translation. For a further description of the Z-score transformation, see the Materials and methods and [22].
Fig 4
Fig 4. The PF-06446846–induced stall site is revealed by ribosome profiling.
(A–D) Ribosome footprint density plots displaying the number of reads aligning to a given codon per million total reads for the proprotein convertase subtilisin/kexin type 9 (PCSK9) coding region from Huh7 cells treated for (A) 1 h and (B) 10 min. (C) Ribo-seq datasets from the second study and (D) mRNA-seq datasets from the second study. The upward red bars indicate readmaps from cells treated with 1.5 μM PF-06446846 and the blue downward bars represent vehicle. In panels A–D, read positions are mapped according to inferred location of the ribosome P-site [19]. (E) The footprint density downstream from the stall in the 10-min treatment (black) and 1-h treatment (light grey) compared with PCSK9 expression as measured by ELISA (middle grey). Error bars represent one standard deviation of three replicates. The individual quantitative observations that underlie Fig 4E are in S14 Table.
Fig 5
Fig 5. Identification and validation of PF-06446846–sensitive nascent chains.
(A) Outline of the approach to identify PF-06446846–targeted mRNAs. (B) Example readplot and (C) example cumulative fractional read (CFR) plot for proprotein convertase subtilisin/kexin type 9 (PCSK9). A CFR plot depicts at each codon the percentage of reads aligning at or 5ʹ to that codon. In all plots, data from 1.5 μM PF-06446846 treatments are shown in red and vehicle treatments are shown in blue. The major stall and the position of Dmax is marked. (D) Scatterplot showing the distribution of Dmax values as a function of read counts; red indicates Dmax Z-score > 3 (see Materials and methods for Z-score calculations) and green indicates 2 < Z-score < 3. (E) Scatterplot of fold change versus expression level when reads mapping 3ʹ to Dmax position (for Z-score > 2) or codon 50 (for Z-score < 2) are used. Genes for which Dmax Z-score > 2 and DeSeq fasle discovery rate (FDR) < 10% are highlighted in red, in green for Dmax Z-score > 2 but FDR > 10%, and in purple for Dmax Z-score < 2 with FDR < 10%. (F–I) Example readplots for PF-06446846–sensitive proteins (F) HSD17B11, (G) RPL27, (H) PCBP1, and (I) cadherin-1 (CDH1). Bars representing the treatment dataset are red and go upwards and bars representing the vehicle datasets are blue and go downwards. All graphs are derived from the 1-h treatment time in the first study. (J) Cell-free translation assays showing inhibition of translation by 50 μM PF-06446846 when the stall sites identified by ribosome profiling are fused to the N-terminus of luciferase. (K) Inhibition of in vitro translation of full-length Midikine- and BCAP31-luciferase fusions in the cell-free translation system. (L) In vitro translation of control constructs not predicted to be inhibited by PF-06446846 from cell-based experiments. (M) In vitro translation of constructs with PF-06446846–induced stalls identified only at the 10-min treatment time. The individual quantitative observations that underlie Fig 5J–M are in S14 Table.
Fig 6
Fig 6. Features of PF-06446846–sensitive transcripts.
(A) Changes in the mean read position or center of density [22] plotted against expression levels. Genes with a local Z-score greater than 3 are highlighted in red. (B–D) Center-of-density analysis with first (B) 50, (C) 100, and (D) 150 codons omitted, showing that stalling preferentially occurs before codon 50. (E) Expression changes for PF-06446846–sensitive transcripts occur at the step of translation. Plot of Z-score–transformed [22] read counts for mRNA-seq and ribo-seq. PF-06446846–sensitive nascent chains are highlighted in red. (F) Alignment of PF-06446846–sensitive sequences. The sequences are aligned according to the stall position, and the residues predicted to reside in the ribosome exit tunnel, P-site, and A-site are indicated.

Comment in

References

    1. Anderson KM, Castelli WP, Levy D. Cholesterol and mortality. 30 years of follow-up from the Framingham study. JAMA. 1987;257(16):2176–80. - PubMed
    1. Pearson TA, Blair SN, Daniels SR, Eckel RH, Fair JM, Fortmann SP, et al. AHA Guidelines for Primary Prevention of Cardiovascular Disease and Stroke: 2002 Update: Consensus Panel Guide to Comprehensive Risk Reduction for Adult Patients Without Coronary or Other Atherosclerotic Vascular Diseases. American Heart Association Science Advisory and Coordinating Committee. Circulation. 2002;106(3):388–91. - PubMed
    1. Lagace TA, Curtis DE, Garuti R, McNutt MC, Park SW, Prather HB, et al. Secreted PCSK9 decreases the number of LDL receptors in hepatocytes and in livers of parabiotic mice. J Clin Invest. 2006;116(11):2995–3005. 10.1172/JCI29383 - DOI - PMC - PubMed
    1. Urban D, Poss J, Bohm M, Laufs U. Targeting the proprotein convertase subtilisin/kexin type 9 for the treatment of dyslipidemia and atherosclerosis. J Am Coll Cardiol. 2013;62(16):1401–8. 10.1016/j.jacc.2013.07.056 - DOI - PubMed
    1. Cohen J, Pertsemlidis A, Kotowski IK, Graham R, Garcia CK, Hobbs HH. Low LDL cholesterol in individuals of African descent resulting from frequent nonsense mutations in PCSK9. Nat Genet. 2005;37(2):161–5. 10.1038/ng1509 - DOI - PubMed

Publication types

MeSH terms