. 2017 May 1;158(5):1406-1418.
doi: 10.1210/en.2017-00084.

Insulin, IGF-1, and GH Receptors Are Altered in an Adipose Tissue Depot-Specific Manner in Male Mice With Modified GH Action

Affiliations

Insulin, IGF-1, and GH Receptors Are Altered in an Adipose Tissue Depot-Specific Manner in Male Mice With Modified GH Action

Rikke Hjortebjerg et al. Endocrinology. .

Abstract

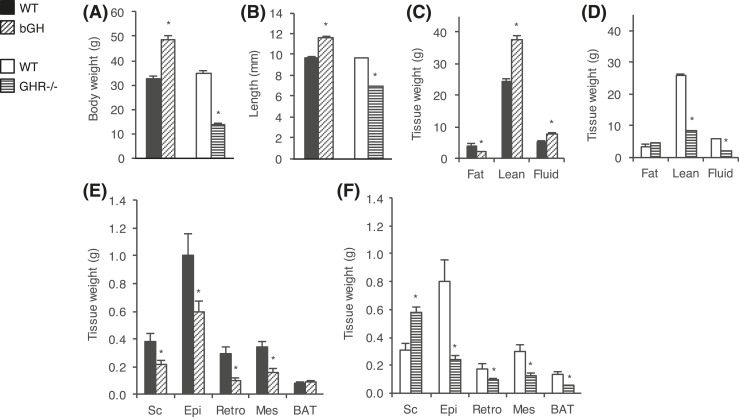
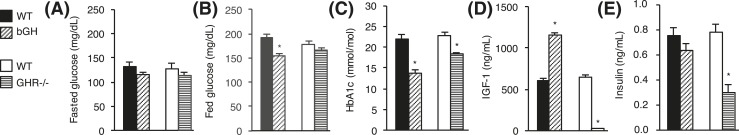
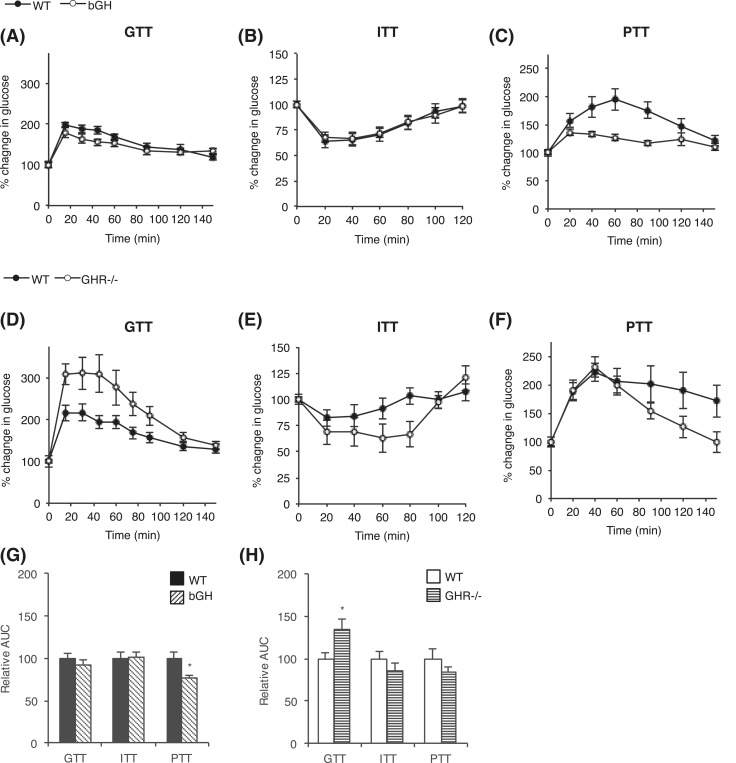
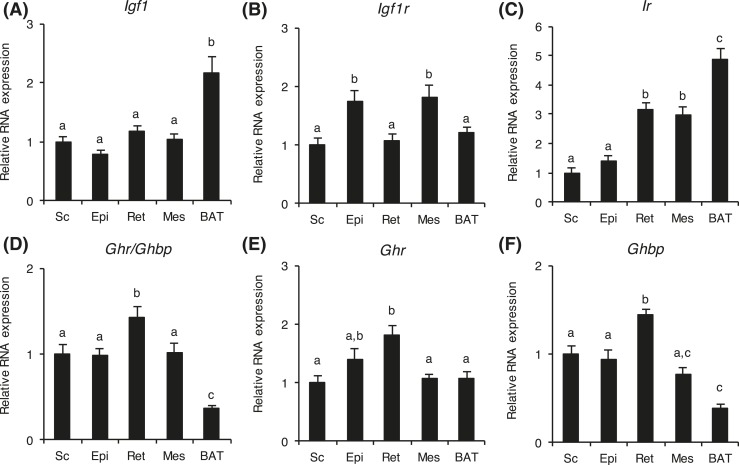
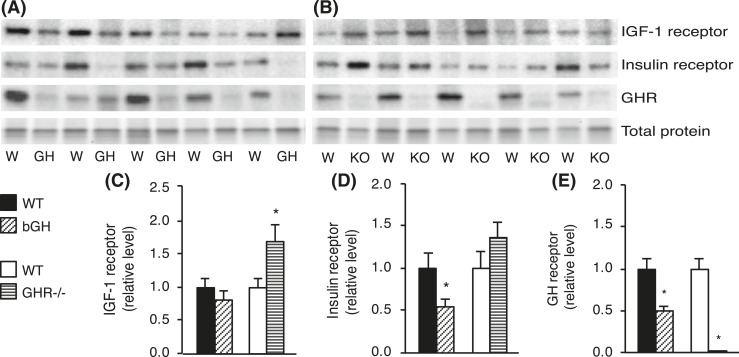
Growth hormone (GH) is a determinant of glucose homeostasis and adipose tissue (AT) function. Using 7-month-old transgenic mice expressing the bovine growth hormone (bGH) gene and growth hormone receptor knockout (GHR-/-) mice, we examined whether changes in GH action affect glucose, insulin, and pyruvate tolerance and AT expression of proteins involved in the interrelated signaling pathways of GH, insulinlike growth factor 1 (IGF-1), and insulin. Furthermore, we searched for AT depot-specific differences in control mice. Glycated hemoglobin levels were reduced in bGH and GHR-/- mice, and bGH mice displayed impaired gluconeogenesis as judged by pyruvate tolerance testing. Serum IGF-1 was elevated by 90% in bGH mice, whereas IGF-1 and insulin were reduced by 97% and 61% in GHR-/- mice, respectively. Igf1 RNA was increased in subcutaneous, epididymal, retroperitoneal, and brown adipose tissue (BAT) depots in bGH mice (mean increase ± standard error of the mean in all five depots, 153% ± 27%) and decreased in all depots in GHR-/- mice (mean decrease, 62% ± 4%). IGF-1 receptor expression was decreased in all AT depots of bGH mice (mean decrease, 49% ± 6%) and increased in all AT depots of GHR-/- mice (mean increase, 94% ± 8%). Insulin receptor expression was reduced in retroperitoneal, mesenteric, and BAT depots in bGH mice (mean decrease in all depots, 56% ± 4%) and augmented in subcutaneous, retroperitoneal, mesenteric, and BAT depots in GHR-/- mice (mean increase: 51% ± 1%). Collectively, our findings indicate a role for GH in influencing hormone signaling in AT in a depot-dependent manner.


Figures

Figure 1.
Figure 1.
Body weight and composition of bGH and GHR−/− mice. Body and tissue weights were determined in bGH mice (diagonal-hatched bars) and WT control mice (black bars) (n = 10 per group) and in GHR−/− mice (horizontal-hatched bars) and WT control mice (white bars) (n = 8 per group). (A) Total body weight was determined 1 week prior to dissection and (B) body length was measured at dissection. Body composition (fat, lean, and fluid mass) is shown for (C) bGH and WT control mice and (D) GHR−/− and WT control mice. Sc, Epi, Ret, and Mes white adipose depots as well as BAT were weighed in (E) bGH and WT mice and (F) GHR−/− and WT mice. Values are expressed as mean ± standard error of the mean; *P < 0.05.
Figure 2.
Figure 2.
Blood parameters in bGH and GHR−/− mice. (A) Fasting blood glucose, (B) fed blood glucose, (C), HbA1c, (D) IGF-1, and (E) insulin levels are shown for bGH mice (diagonal-hatched bars) and WT control mice (black bars) (n = 10 per group) and for GHR−/− mice (horizontal-hatched bars) and WT control mice (white bars) (n = 8 per group). Values are expressed as mean ± standard error of the mean; *P < 0.05.
Figure 3.
Figure 3.
Glucose homeostasis in bGH and GHR−/− mice. (A) GTTs, (B) ITTs, and (C) PTTs were performed in bGH mice (white circles) and WT control mice (black circles) (n = 10 per group). Similarly, (D) GTTs, (E) ITTs, and (F) PTTs were performed in GHR−/− mice (white circles) and WT control mice (black circles) (n = 8 per group). Mice received an IP injection of glucose at 1 g/kg body weight, insulin at 0.75 U/kg body weight, or pyruvate at 1.5 g/kg body weight, respectively. Blood glucose levels are reported as percentage change in glucose from baseline (100%). Relative AUC was calculated for each test in (G) bGH and (H) GHR−/− mice. Values are expressed as mean ± standard error of the mean.
Figure 4.
Figure 4.
Adipose depot–specific differences in RNA expressions in WT mice. Relative RNA levels of (A) Igf1, (B) Igf1r, (C) Ir, (D) Ghr/Ghbp, (E) Ghr, and (F) Ghbp were determined in Sc, Epi, Ret, Mes, and BAT depots from WT mice (n = 18). For each gene, RNA levels are relative to the level in the subcutaneous depot. Values are expressed as mean ± standard error of the mean. Means with differing lowercase letters a, b, or c in the same gene are significantly different (P < 0.05).
Figure 5.
Figure 5.
RNA expression levels in adipose tissue depots from bGH and GHR−/− mice. Sc, Epi, Ret, and Mes white adipose depots as well as BAT were collected from bGH mice (diagonal-hatched bars) and WT control mice (black bars) (n = 10 per group) and from GHR−/− mice (horizontal-hatched bars) and WT control mice (white bars) (n = 8 per group). Relative RNA levels of (A) Igf1, (B) Igf1r, (C) Ir, (D) Ghr/Ghbp, (E) Ghr, and (F) Ghbp were determined. Ghr and Ghbp RNA levels were only determined in mice from the bGH litter. For each gene, all RNA levels are relative to the level in the Sc depot in the WT control group from the bGH litter. Values are expressed as mean ± standard error of the mean; *P < 0.05.
Figure 6.
Figure 6.
Protein levels in Sc adipose tissue from bGH and GHR−/− mice. Protein was isolated from Sc white adipose depots collected from bGH mice (diagonal-hatched bars) and WT control mice (black bars) (n = 10 per group) and from GHR−/− mice (horizontal-hatched bars) and WT control mice (white bars) (n = 8 per group). Representative Western blots of IGF-1R, IR, and GHR are shown for (A) bGH (GH) and WT (W) mice and for (B) GHR−/− (KO) and WT (W) mice. Protein levels of (C) IGF-1R, (D) IR, and (E) GHR were quantified and reported as mean ± standard error of the mean; *P < 0.05.

Similar articles

Cited by

References

    1. Mozaffarian D, Benjamin EJ, Go AS, Arnett DK, Blaha MJ, Cushman M, Das SR, de Ferranti S, Després J-P, Fullerton HJ, Howard VJ, Huffman MD, Isasi CR, Jiménez MC, Judd SE, Kissela BM, Lichtman JH, Lisabeth LD, Liu S, Mackey RH, Magid DJ, McGuire DK, Mohler ER, Moy CS, Muntner P, Mussolino ME, Nasir K, Neumar RW, Nichol G, Palaniappan L, Pandey DK, Reeves MJ, Rodriguez CJ, Rosamond W, Sorlie PD, Stein J, Towfighi A, Turan TN, Virani SS, Woo D, Yeh RW, Turner MB Heart disease and stroke statistics—2016 update. A report from the American Heart Association. Circulation. 2016;133 (4):e38–e360. - PubMed
    1. American Diabetes Association 6. Obesity management for the treatment of type 2 diabetes. Diabetes Care. 2016;39(Suppl 1):S47–S51. - PubMed
    1. Lee M-J, Wu Y, Fried SK. Adipose tissue heterogeneity: implication of depot differences in adipose tissue for obesity complications. Mol Aspects Med. 2013;34(1):1–11. - PMC - PubMed
    1. Berryman DE, List EO, Sackmann-Sala L, Lubbers E, Munn R, Kopchick JJ. Growth hormone and adipose tissue: beyond the adipocyte. Growth Horm IGF Res. 2011;21(3):113–123. - PMC - PubMed
    1. Hjortebjerg R, Flyvbjerg A, Frystyk J. Insulin growth factor binding proteins as therapeutic targets in type 2 diabetes. Expert Opin Ther Targets. 2014;18(2):209–224. - PubMed

Publication types

MeSH terms