. 2017 Jul:81:13-23.
doi: 10.1016/j.jaut.2017.03.001. Epub 2017 Mar 18.

DNase-active TREX1 frame-shift mutants induce serologic autoimmunity in mice

Affiliations

DNase-active TREX1 frame-shift mutants induce serologic autoimmunity in mice

Tomomi Sakai et al. J Autoimmun. 2017 Jul.

Abstract

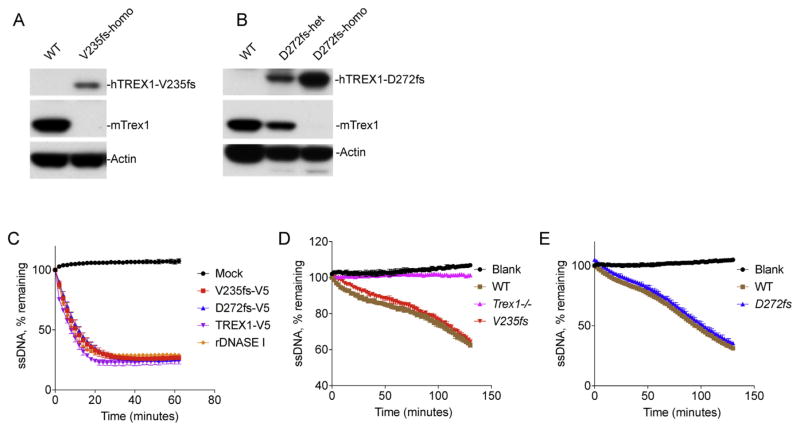
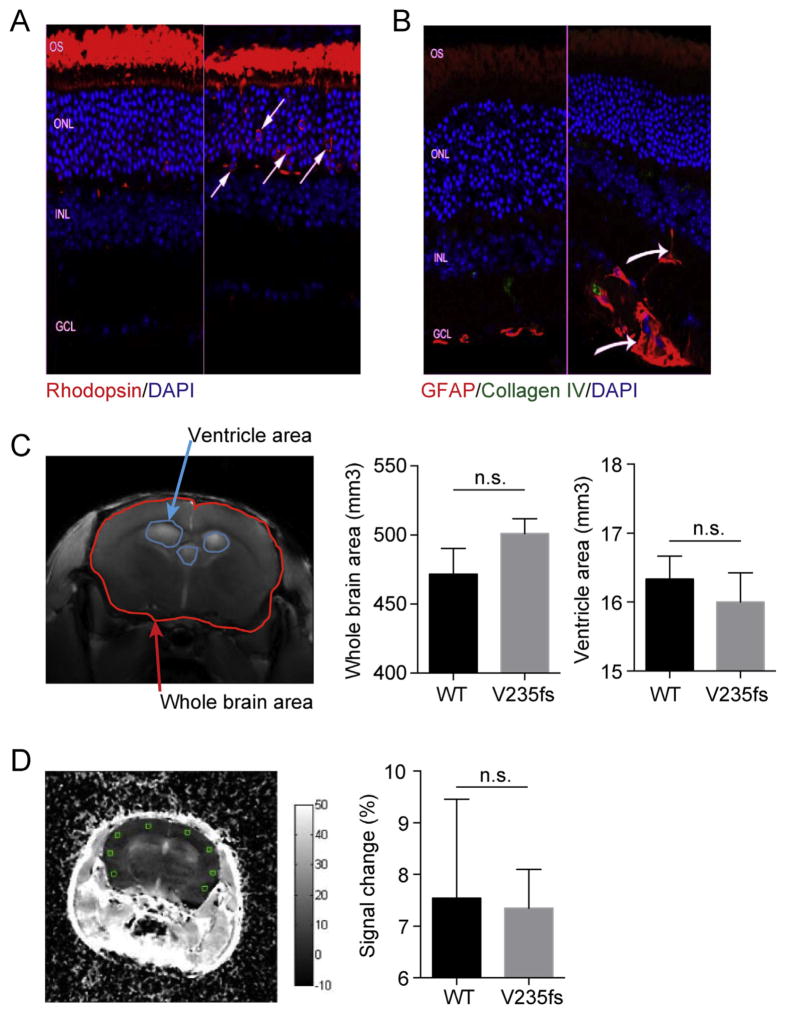
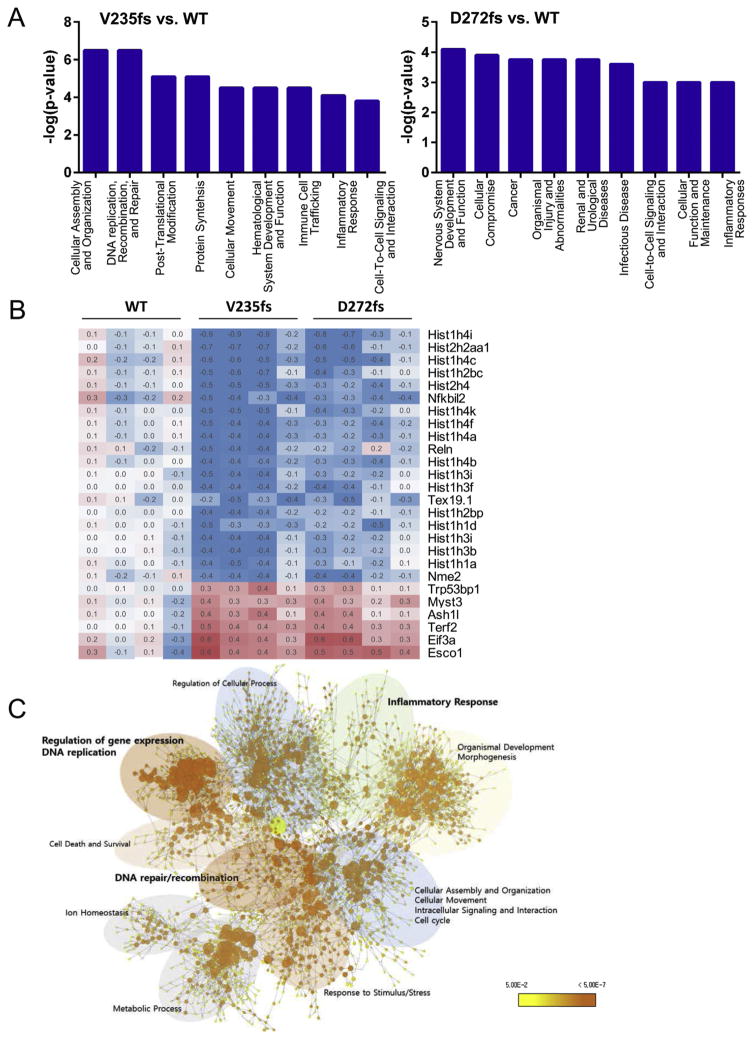
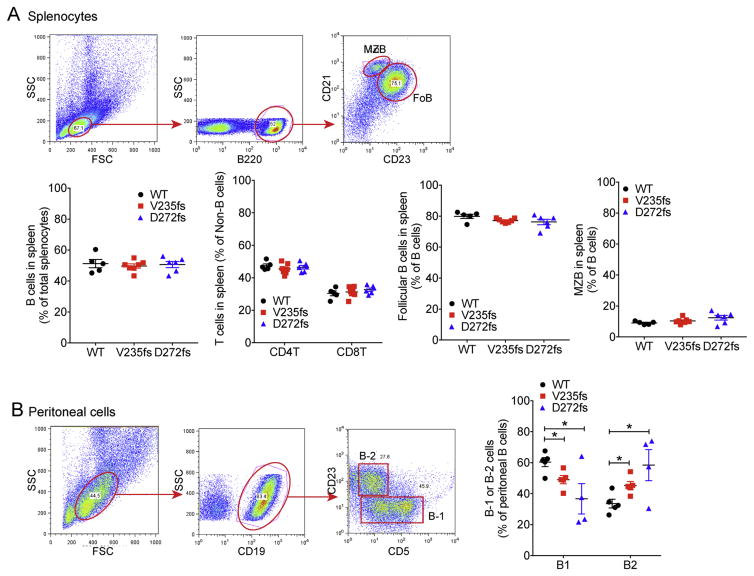
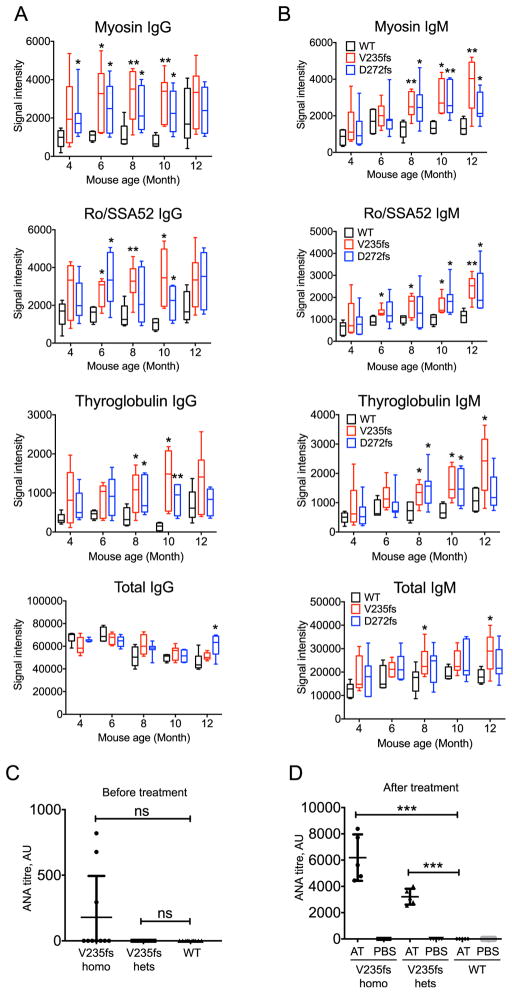
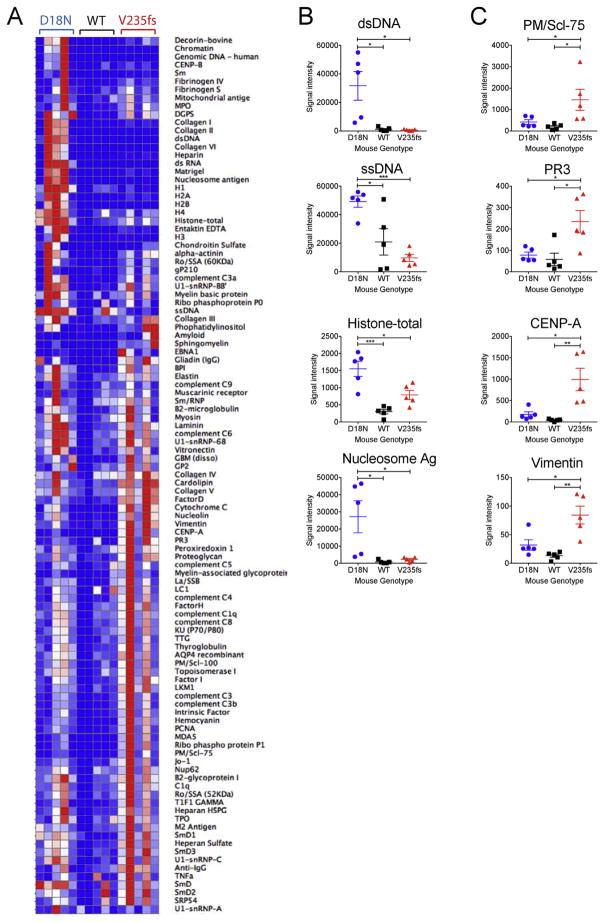
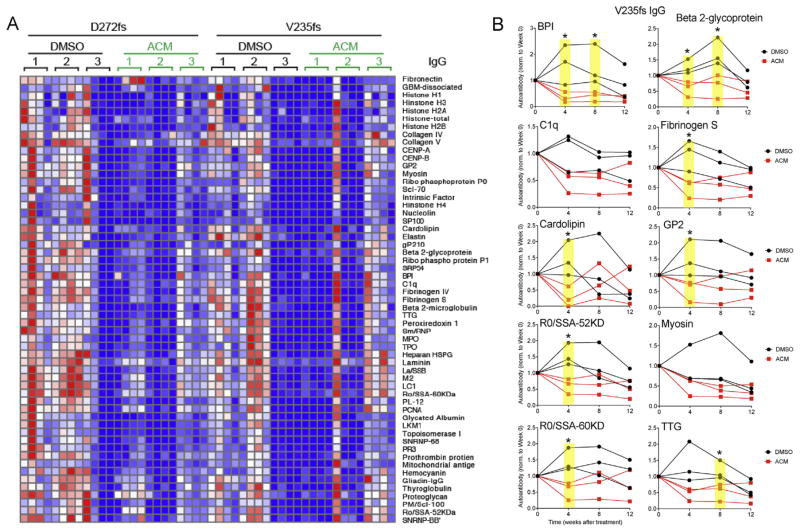
TREX1/DNASE III, the most abundant 3'-5' DNA exonuclease in mammalian cells, is tail-anchored on the endoplasmic reticulum (ER). Mutations at the N-terminus affecting TREX1 DNase activity are associated with autoimmune and inflammatory conditions such as Aicardi-Goutières syndrome (AGS). Mutations in the C-terminus of TREX1 cause loss of localization to the ER and dysregulation of oligosaccharyltransferase (OST) activity, and are associated with retinal vasculopathy with cerebral leukodystrophy (RVCL) and in some cases with systemic lupus erythematosus (SLE). Here we investigate mice with conditional expression of the most common RVCL mutation, V235fs, and another mouse expressing a conditional C-terminal mutation, D272fs, associated with a case of human SLE. Mice homozygous for either mutant allele express the encoded human TREX1 truncations without endogenous mouse TREX1, and both remain DNase active in tissues. The two mouse strains are similar phenotypically without major signs of retinal, cerebral or renal disease but exhibit striking elevations of autoantibodies in the serum. The broad range of autoantibodies is primarily against non-nuclear antigens, in sharp contrast to the predominantly DNA-related autoantibodies produced by a TREX1-D18N mouse that specifically lacks DNase activity. We also found that treatment with an OST inhibitor, aclacinomycin, rapidly suppressed autoantibody production in the TREX1 frame-shift mutant mice. Together, our study presents two new mouse models based on TREX1 frame-shift mutations with a unique set of serologic autoimmune-like phenotypes.


Figures

Fig. 1
Fig. 1
V235fs and D272fs mutants are DNase active in mice. (A, B) Immunoblots showing expression of transgenic human TREX1 truncations and endogenous mouse Trex1. Actin serves as a loading control. Mice spleen of indicated genotype (top) were used for immunoblots. V235fs in A and D272fs in B. (C–E) DNase activity assay. Hela cells were transfected with plasmids expressing indicated V5-tagged TREX1 wild type or mutants (C). Spleen was isolated from V235fs mice (D) or D272fs mice (E). DNase activity of cell lysate was measured 24 h after transfection (C) or directly with spleen extract (D, E). Mock, mock transfected cells. rDNASE I, recombinant DNASE I (a positive control, NEB). Data are representative of at least three independent experiments.
Fig. 2
Fig. 2
V235fs and D272fs mice do not develop major retinal or neurological pathology. (A, B) Confocal microscopic images of retinas of two different V235fs mice, with areas of normal retina for each mouse shown on the left side of each panel and areas of suggestive of focal pathology on the right side. A, immunolabeling with antibody to Rhodopsin (red). Arrows denote the location of individual rods with elevated opsin immunolabeling. B, immunolabeling with antibodies to glial fibrillary acidic protein (GFAP, red) and collagen IV (green). (C) Magnetic Resonance Imaging (MRI) of the in vivo mouse brain. Image on the left shows a representative transverse image depicting the selection of Regions Of Interests (ROI) in the entire brain and the ventricles. Plots on the right show the total brain volume and ventricular areas, calculated over all MRI transverse slices, for WT (n = 3 [11, 13, 15 months old]) and V235fs homozygous mice (n = 8 [7–21 months old]). (D) A transverse image slice that illustrate the ROIs selected in the cortical region (total of 53 in the entire brain) in order to quantitatively evaluate possible breaching of the blood brain barrier (BBB). Relative signal intensity (calculated as {[pre contrast intensity – post contrast intensity]/pre contrast intensity}x100) upon administering an MR contrast agent, Gd DTPA, in WT and V235fs mice. ns, not significant. Student's t-test. Error bars, SEM.
Fig. 3
Fig. 3
V235fs and D272fs mice show similar transcriptome alterations. (A) Top 9 significant biological categories modulated by V235fs (left panel) and D272fs (right panel). Total mRNA was isolated from mouse spleen and subjected to transcriptome analysis. Data analyzed by Ingenuity Pathway Analysis (IPA). (B) Differentially expressed genes in the category of DNA Replication, Recombination and Repair. (C) Functional network of gene sets of differentially expressed genes in V235fs mice. Each node represents a GO term, and its color and size indicate the p-value and the number of genes in the cluster, respectively. Microarray analyses were performed on spleens of 4 individual wild type mice or mice with either mutation.
Fig. 4
Fig. 4
V235fs and D272fs mice exhibit altered peritoneal B-1 and B-2 population. (A) FACS analysis of major B and T cell populations in the spleen. Top, gating strategy for follicle (FoB) and marginal zone (MZB) B cells. Gating strategy for CD4 and CD8 T cells is not shown. Bottom, quantitation of each cell population (as indicated) from WT, V235fs and D272fs mice. (B) FACS analysis of peritoneal B-1 and B-2 cells. Gating strategy on the left and quantitation on the right. *, p<0.05. Error bar, SEM. Data are representative of at least two independent experiments.
Fig. 5
Fig. 5
V235fs and D272fs mice produce increased levels of broad range of autoantibodies. (A, B) Mouse serum autoantibody analysis. Representative autoantibodies from autoantibody array analysis are shown. IgG in A and IgM in B. n = 5. Statistical analysis was performed using multiple t-test comparing WT vs V235fs or WT vs D272 fs at each time point. (C, D) Mouse serum antinuclear antibody (ANA) titer before (C) and after (D) injection of apoptotic thymocytes (AT). n = 5. Statistical analysis was performed using t-test comparing WT vs V235fs or WT vs D272fs before treatment (C) and only AT-treated samples in D. *, p < 0.05. **, p < 0.01. ***, p < 0.001. ns, not significant. Error bar, SEM. Data are representative of at least two independent experiments.
Fig. 6
Fig. 6
D18N and V235fs mice exhibit distinct profiles of autoantibodies. (A) A heatmap of IgG autoantibody array. Mouse sera (n = 5, 6–8 month old) were analyzed by autoantibody array. Mouse genotypes are indicated on top. (B) Representative DNA-related autoantibody measurement from A. (C) Representative non-DNA-related autoantibody measurement from A. Statistical analysis was performed using t-test comparing V235fs vs D18N or V235fs vs WT. *, p < 0.05. **, p < 0.01. ***, p < 0.001. Error bar, SEM. Data are representative of at least two independent experiments.
Fig. 7
Fig. 7
Aclacinomyin treatment suppresses autoantibody production in V235fs and D272fs mice. (A) A heatmap of IgG autoantibody array. Mouse genotypes and treatment are indicated on top. Numbers indicate individual mouse (n = 3). Each mouse was analyzed at 0, 4, 8 and 12 wks after treatment (4 columns from left to right). (B) Ten representative IgG autoantibodies measured from A. Each line represents one mouse. Autoantibody values are normalized to week 0 value for each mouse to show fold-changes after treatment. Statistical analysis was performed using t-test comparing DMSO vs ACM for each time point. *, p < 0.05 (highlighted in yellow). Data are representative of at least two independent experiments.

References

    1. Crow YJ, Manel N. Aicardi-Goutières syndrome and the type I interferonopathies. Nat Rev Immunol. 2015;15:429–440. http://dx.doi.org/10.1038/nri3850. - DOI - PubMed
    1. Richards A, van den Maagdenberg AMJM, Jen JC, Kavanagh D, Bertram P, Spitzer D, et al. C-terminal truncations in human 3′-5′ DNA exonuclease TREX1 cause autosomal dominant retinal vasculopathy with cerebral leukodystrophy. Nat Genet. 2007;39:1068–1070. http://dx.doi.org/10.1038/ng2082. - DOI - PubMed
    1. Stam AH, Kothari PH, Shaikh A, Gschwendter A, Jen JC, Hodgkinson S, et al. Retinal vasculopathy with cerebral leukoencephalopathy and systemic manifestations. Brain. 2016:aww217. http://dx.doi.org/10.1093/brain/aww217. - DOI - PMC - PubMed
    1. Morita M, Stamp G, Robins P, Dulic A, Rosewell I, Hrivnak G, et al. Gene-targeted mice lacking the Trex1 (DNase III) 3′-5′ DNA exonuclease develop inflammatory myocarditis. Mol Cell Biol. 2004;24:6719–6727. - PMC - PubMed
    1. Stetson DB, Ko JS, Heidmann T, Medzhitov R. Trex1 prevents cell-intrinsic initiation of autoimmunity. Cell. 2008;134:587–598. http://dx.doi.org/10.1016/j.cell.2008.06.032. - DOI - PMC - PubMed

MeSH terms

LinkOut - more resources