

Estimating prevalence trends in adult gonorrhoea and syphilis in low- and middle-income countries with the Spectrum-STI model: results for Zimbabwe and Morocco from 1995 to 2016
- PMID: 28325771
- PMCID: PMC5739862
- DOI: 10.1136/sextrans-2016-052953
Estimating prevalence trends in adult gonorrhoea and syphilis in low- and middle-income countries with the Spectrum-STI model: results for Zimbabwe and Morocco from 1995 to 2016
Abstract
Objective: To develop a tool for estimating national trends in adult prevalence of sexually transmitted infections by low- and middle-income countries, using standardised, routinely collected programme indicator data.
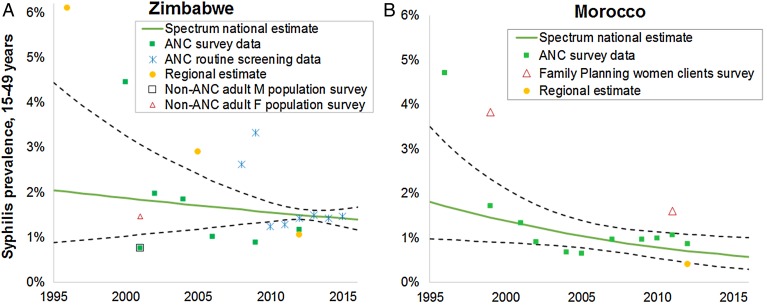
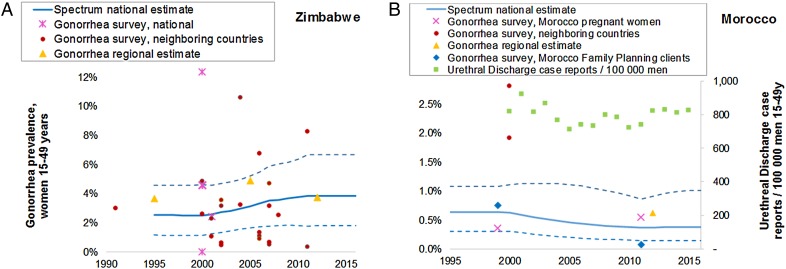
Methods: The Spectrum-STI model fits time trends in the prevalence of active syphilis through logistic regression on prevalence data from antenatal clinic-based surveys, routine antenatal screening and general population surveys where available, weighting data by their national coverage and representativeness. Gonorrhoea prevalence was fitted as a moving average on population surveys (from the country, neighbouring countries and historic regional estimates), with trends informed additionally by urethral discharge case reports, where these were considered to have reasonably stable completeness. Prevalence data were adjusted for diagnostic test performance, high-risk populations not sampled, urban/rural and male/female prevalence ratios, using WHO's assumptions from latest global and regional-level estimations. Uncertainty intervals were obtained by bootstrap resampling.
Results: Estimated syphilis prevalence (in men and women) declined from 1.9% (95% CI 1.1% to 3.4%) in 2000 to 1.5% (1.3% to 1.8%) in 2016 in Zimbabwe, and from 1.5% (0.76% to 1.9%) to 0.55% (0.30% to 0.93%) in Morocco. At these time points, gonorrhoea estimates for women aged 15-49 years were 2.5% (95% CI 1.1% to 4.6%) and 3.8% (1.8% to 6.7%) in Zimbabwe; and 0.6% (0.3% to 1.1%) and 0.36% (0.1% to 1.0%) in Morocco, with male gonorrhoea prevalences 14% lower than female prevalence.
Conclusions: This epidemiological framework facilitates data review, validation and strategic analysis, prioritisation of data collection needs and surveillance strengthening by national experts. We estimated ongoing syphilis declines in both Zimbabwe and Morocco. For gonorrhoea, time trends were less certain, lacking recent population-based surveys.
Keywords: AFRICA; GONORRHOEA; MATHEMATICAL MODEL; SURVEILLANCE; SYPHILIS.
Published by the BMJ Publishing Group Limited. For permission to use (where not already granted under a licence) please go to http://www.bmj.com/company/products-services/rights-and-licensing/.
Conflict of interest statement
Competing interests: None declared.
Figures
References
-
- Holmes K. Sexually transmitted diseases. 4th edn. New York City: McGraw-Hill Medical, 2008.
-
- Global Burden of Disease Study 2013 Collaborators. Global, regional, and national incidence, prevalence, and years lived with disability for 301 acute and chronic diseases and injuries in 188 countries, 1990–2013: a systematic analysis for the Global Burden of Disease Study 2013. Lancet 2015;386:743–800. 10.1016/S0140-6736(15)60692-4 - DOI - PMC - PubMed
-
- Gerbase AC, Rowley JT, Heymann DH, et al. Global prevalence and incidence estimates of selected curable STDs. Sex Transm Infect 1998;74(Suppl 1):S12–16. - PubMed
-
- World Health Organization. Global incidence and prevalence of selected curable sexually transmitted infections—2008. Geneva, 2012.
Publication types
MeSH terms
Grants and funding
LinkOut - more resources
Full Text Sources
Other Literature Sources
Medical