. 2017 Apr 4;114(14):E2965-E2974.
doi: 10.1073/pnas.1618834114. Epub 2017 Mar 21.

Small RNA-mediated repair of UV-induced DNA lesions by the DNA DAMAGE-BINDING PROTEIN 2 and ARGONAUTE 1

Affiliations

Small RNA-mediated repair of UV-induced DNA lesions by the DNA DAMAGE-BINDING PROTEIN 2 and ARGONAUTE 1

Catherine Schalk et al. Proc Natl Acad Sci U S A. .

Abstract

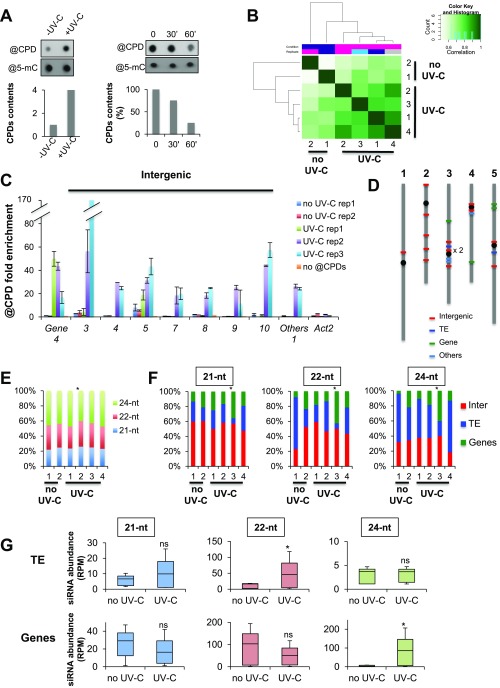
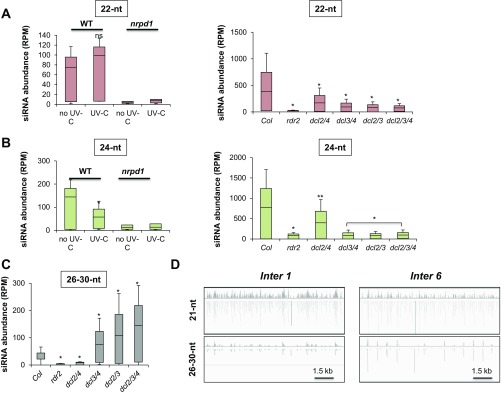
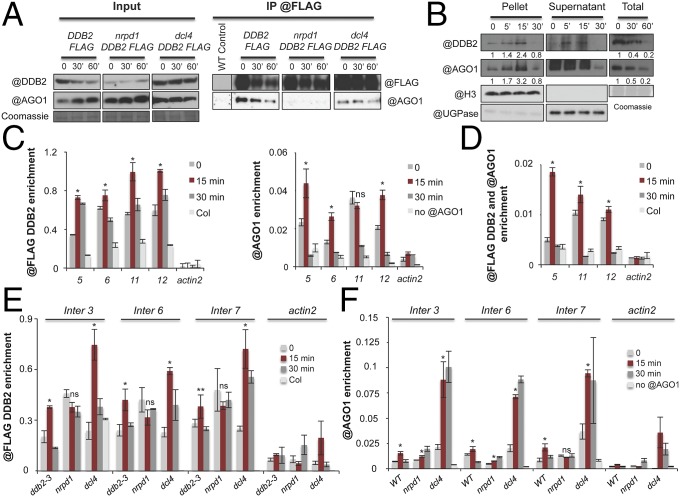
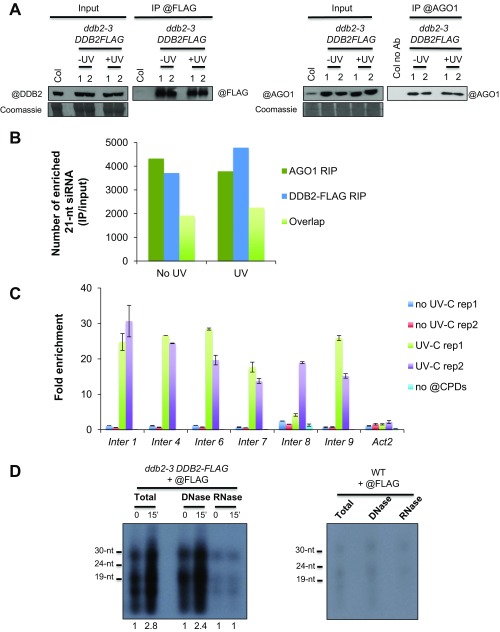
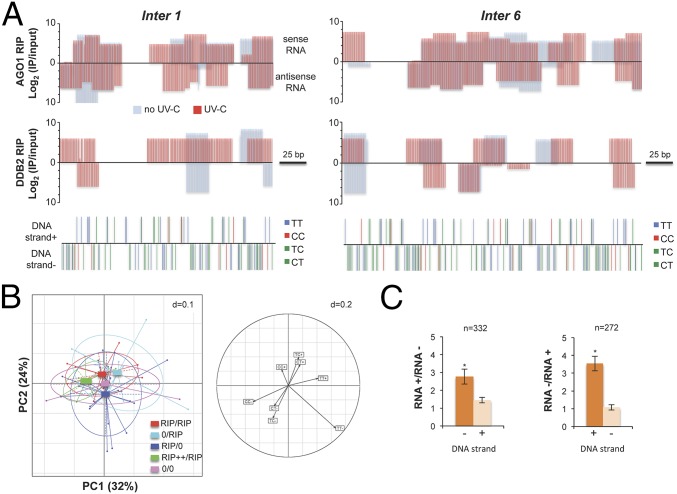
As photosynthetic organisms, plants need to prevent irreversible UV-induced DNA lesions. Through an unbiased, genome-wide approach, we have uncovered a previously unrecognized interplay between Global Genome Repair and small interfering RNAs (siRNAs) in the recognition of DNA photoproducts, prevalently in intergenic regions. Genetic and biochemical approaches indicate that, upon UV irradiation, the DNA DAMAGE-BINDING PROTEIN 2 (DDB2) and ARGONAUTE 1 (AGO1) of Arabidopsis thaliana form a chromatin-bound complex together with 21-nt siRNAs, which likely facilitates recognition of DNA damages in an RNA/DNA complementary strand-specific manner. The biogenesis of photoproduct-associated siRNAs involves the noncanonical, concerted action of RNA POLYMERASE IV, RNA-DEPENDENT RNA POLYMERASE-2, and DICER-LIKE-4. Furthermore, the chromatin association/dissociation of the DDB2-AGO1 complex is under the control of siRNA abundance and DNA damage signaling. These findings reveal unexpected nuclear functions for DCL4 and AGO1, and shed light on the interplay between small RNAs and DNA repair recognition factors at damaged sites.

Keywords: Arabidopsis; DNA photolesions; DNA repair; small RNA.


Conflict of interest statement

The authors declare no conflict of interest.

Figures

Fig. 1.
Fig. 1.
UV sensitivity of RdDM and PTGS loss of function Arabidopsis plants. (A) (Top) Root growth assay. Seven-day-old WT, RdDM mutant plants (nrpd1, rdr2, dcl3, and ago4) were exposed to UV-C. Root growth was calculated relative to the corresponding untreated plants (±SD). Eight plants per replicate were used, and three independent biological replicates were performed; ddb2-3 was used as control as DNA repair deficient plants. (Bottom) CPDs removal assay. Histogram represents the amounts of CPDs 1 h after UV-C treatment (± SD). Intensity of each dot was quantified and normalized to that of CPDs at time 0 to calculate the remaining CPDs content after 1 h. Twenty plants per replicate were used, and experiments were duplicated; ddb2-3 was used as control as DNA repair deficient plants; t test *P < 0.01; **P < 0.05; ns, nonsignificant. (B) Same as A for PTGS-deficient plants (rdr6, dcl4, ago1, and ago2). (C) Genetic interactions between ddb2 and ago1. Seven-day-old single (ago1 and ddb2) and double (ddb2-ago1) mutant plants were exposed to UV-C and grown for 24 h either under light or in the dark. Because ddb2-2 is in the No ecotype, the control for double mutant plants is No/Col. Eight plants per replicate were used, and three independent biological replicates were performed; t test *P < 0.01; ns, nonsignificant compared with the corresponding single mutants for double mutant. (D) Genetic interactions between GGR and RdDM (nrpd1, rdr2, dcl3, ago4, and ddb2) and double mutant plants (ddb2-nrpd1, ddb2-rdr2, ddb2-dcl3, and ddb2-ago4). Because ddb2-2 is in the No ecotype, the control for double mutant plants is No/Col; t test *P < 0.01; **P < 0.05 compared with the corresponding WT plants. Eight plants per replicate were used, and three independent biological replicates were performed; ns, nonsignificant compared with the corresponding single mutants for double mutant. (E) Same as D for GGR and PTGS. Seven-day-old single WT (rdr6, dcl4, ago1, ago2, and ddb2) and double mutant plants (ddb2-rdr6, ddb2-dcl4, ddb2-ago1, and ddb2-ago2) were exposed to UV-C. Eight plants per replicate were used, and three independent biological replicates were performed; t test *P < 0.01; ns, nonsignificant compared with the corresponding single mutants for double mutants.
Fig. S1.
Fig. S1.
Genetic interactions of RdDM and PTGS with DR and TCR. (A) Genetic interactions between phrI, ago1, and ago4. Ten-day-old WT, single (ago1, ago4, and phrI) and double mutant plants (phrI-ago1 and phrI-ago4) were irradiated with UV-C (1,500 J/m2, 3,000 J/m2) three times in a row every 2 d. (Left) Histogram representing the percentage of bleached plants. At least 20 plants were used per replicate, and this experiment was duplicated; t test *P < 0.01 compared with single mutant plants; ns, nonsignificant. (Right) Histogram representing the average number of leaves (±SD); t test *P < 0.01 compared with untreated plants; ns, nonsignificant. (B) Pictures showing the phenotype of Col, phrI, ago1, ago4, phrI-ago1, and phrI-ago4 plants 1 wk after the last UV-C exposure (3,000 J/m2; scale bar,  2 cm). (C) Genetic interactions between csa, nrpd1, rdr2, ago1, and ago4. Seven-day-old WT, single (csa, nrpd1, rdr2, ago1, and ago4) and double mutant plants (csa-nrpd1, csa-rdr2, csa-ago1, and csa-ago4) were exposed to 600 J/m2 of UV-C and grown for 24 h either under light or in the dark. Eight plants per replicate were used, and three independent biological replicates were performed; t test *P < 0.01; ns, nonsignificant.
Fig. 2.
Fig. 2.
CPD mapping and overlap with canonical, 21-, 22-, and 24-nt siRNAs. (A) Design of the experiment. Three-week-old plants (n = 12/replicate), grown in soil, were used in two independent biological replicates for untreated plants and four independent biological replicates for UV-C-treated plants. The sRNA and DNA were prepared from the pool of tissue for each replicate and subsequently used for sRNA sequencing and IPOUD + DNA sequencing. CPDs are displayed in yellow triangles. (B) Visualization of genome-wide CPDs distribution (black bar) on Arabidopsis chromosomes using Circos representation. The outermost circle displays the five Arabidopsis chromosomes. The inner circles represent the genome-wide CPDs distribution for each replicate of untreated and UV-C-treated samples (rainbow colors). The inner circle represents the siRNAs (21, 22, and 24 nt) overlapping CPD-damaged loci. The height of the histogram bins indicates siRNA abundance. (C) Histogram representing the origins (intergenic, TE, and protein-coding genes) of CPD-containing loci for each replicate of untreated (no UV-C) and UV-C-treated samples. The Arabidopsis thaliana genome (At) was used as a reference. Chi2 test: *P < 0.05. (D) Independent confirmation of hot spots using IPOUD-qPCR. Histogram (±SD) representing the enrichment of CPDs (IP/input) at hot spots overlapping with intergenic regions, protein-coding genes, and other types of regions excluding TEs (Others). Two biological replicates of untreated and three biological replicates of UV-C-treated in vitro-grown plants were used. Numbers indicate the hot spot sequence name. Actin 2 was used as negative control. (E) Pie chart representing the origins of hot spots of CPDs containing loci. (F) Histogram representing the origins of CPD containing loci mapping with 21-, 22-, and 24-nt siRNAs for each replicate of untreated (no UV-C) and UV-C-treated samples. Chi2 test: *P < 0.05 compared with untreated samples. (G) Box plots representing the abundance of 21-, 22-, and 24-nt siRNAs mapping to intergenic regions enriched in CPDs. Mann−Whitney U test *P < 0.05, ns, nonsignificant.
Fig. S2.
Fig. S2.
CPDs mapping and siRNAs. (A) (Left) Dot blot detecting CPDs content in untreated (−UV-C) and UV-C-treated (+UV-C) plants grown in soil (see experimental procedures for details); @5-mC were used as loading control. Histogram represents the amounts of CPDs (±SD). (Right) Dot blot detecting CPD content in a time course upon UV-C treatment; @5-mC were used as loading control. Histogram represents the amounts of CPDs (±SD) immediately after UV-C treatment (time point 0), and at 30 and 60 min upon irradiation. (B) Heat maps of CPDs enrichment all over the genome. Biological replicates are clustered. (C) Histogram representing the enrichment (IP/input ± SD) of CPDs at hot spots overlapping with intergenic regions, protein-coding genes, and other types of regions (others) using IPOUD-qPCR. Two biological replicates of untreated and three biological replicates of UV-C-treated in vitro-grown plants were used. Numbers indicate the hot spot sequence name. Actin 2 was used as negative control. (D) Schematic representation of hot spot locations on the five Arabidopsis chromosomes. (E) Repartition of 21-, 22-, and 24-nt siRNA at CPD-damaged sites. Chi2 test *P < 0.01. (F) Repartition of intergenic, TE, and genic regions enriched in CPDs overlapping with 21-, 22-, and 24-nt siRNA. Chi2 test: *P < 0.01 compared with untreated plants. (G) Box plots representing the abundance of 21-, 22-, and 24-nt siRNAs mapping to TE and genic regions enriched in CPDs. Mann−Whitney U test *P < 0.05; ns, nonsignificant.
Fig. 3.
Fig. 3.
Di-pyrimidines, CPDs, and siRNAs strand specificity. (A) Box plots representing the di-pyrimidines frequencies (CC, TT, TC, and CT) for each DNA strand (+ and – strand) in Arabidopsis intergenic regions (At) and in CPD-damaged intergenic regions (Inter) identified in IPOUD experiments. Mann−Whitney U test *P < 0.05; ns, nonsignificant. (B) Box plots representing the abundance of sense and antisense 21-nt uviRNAs at CPD-damaged intergenic regions. *P < 0.05 calculated according to Wilcoxon matched-pairs signed rank test; ns, nonsignificant. (C) Graphical representation of consensus ribonucleotide sequences of sense (RNA+) and antisense (RNA-) 21-nt uviRNAs mapping at intergenic CPD-damaged regions.
Fig. S3.
Fig. S3.
Di-pyrimidines frequencies and uviRNAs. (A) Heat map representing the coefficient of correlation between each di-pyrimidines (CC, TT, TC, and CT) at CPD-damaged intergenic regions in a DNA strand-specific manner (+ and – strand). (B) (Left) Box plots representing the abundance of sense (RNA+) and antisense (RNA−) 22-nt siRNAs at CPD-damaged intergenic regions; t test: nonsignificant (ns). (Right) Graphical representation (seq logo) of consensus ribonucleotide sequences of sense (RNA+) and antisense (RNA−) 22-nt siRNAs mapping at intergenic CPD-damaged regions. (C) Same as B for 24-nt siRNAs; t test, ns, nonsignificant.
Fig. 4.
Fig. 4.
Intergenic 21-nt uviRNAs biogenesis. (A) Box plots representing the abundance of 21-nt uviRNAs at intergenic CPD-damaged regions in WT plants and in RNA POL IV-deficient plants (nrpd1) ± UV-C. *P < 0.01 calculated according to Wilcoxon matched-pairs signed rank test. (B) Box plots representing the abundance of 21-nt uviRNAs at intergenic CPD-damaged regions in WT plants (Col) and in rdr2, dcl2/4, dcl3/4, dcl2/3, and dcl2/3/4 plants. *P < 0.01 calculated according to Wilcoxon matched-pairs signed rank test; ns, nonsignificant. (C) Genetic interactions between RdDM and PTGS loss of function. Seven-day-old WT, single (ndpr1, rdr2, rdr6, dcl3, and dcl4) and double mutant plants (ndpr1-rdr6, ndpr1-dcl4, rdr2-dcl4, and rdr6-dcl3) were exposed to UV-C; t test *P < 0.01; **P < 0.05; ns, nonsignificant. (D) Genetic interactions between DCLs loss of function. Seven-day-old WT, single (dcl2, dcl3, and dcl4), double (dcl2/3, dcl2/4, and dcl3/4), and triple mutant plants (dcl2/3/4) were exposed to UV-C; t test *P < 0.01; ns, nonsignificant. (E) Box plots representing the abundance of 26- to 30-nt RNAs at intergenic CPD-damaged regions in WT plants and in RNA POL IV-deficient plants (nrpd1) ± UV-C. *P < 0.01 calculated according to Wilcoxon matched-pairs signed rank test. (F) Same as E for 26-nt RNAs. Shown is graphical representation of consensus ribonucleotide sequences of 26-nt RNAs mapping at intergenic CPD-damaged regions. *P = 0.0164 calculated according to Wilcoxon matched-pairs signed rank test. (G) Same as F for 27-nt RNAs **P < 0.01.
Fig. S4.
Fig. S4.
The siRNA biogenesis. (A) Box plots representing the abundance of 22-nt siRNA at intergenic CPD-damaged regions in WT plants and in RNA POL IV-deficient plants (nrpd1) ± UV-C and in WT plants (Col), rdr2, dcl2/4, dcl3/4, dcl2/3, and dcl2/3/4 plants. *P < 0.01 calculated according to Wilcoxon matched-pairs signed rank test. (B) Same as A for 24-nt siRNA. (C) Box plots representing the abundance of 26- to 30-nt siRNAs at intergenic CPD-damaged regions in WT plants (Col) and in rdr2, dcl2/4, dcl3/4, dcl2/3, and dcl2/3/4 plants. *P < 0.01 calculated according to Wilcoxon matched-pairs signed rank test. (D) Browser view of (Top) 21-nt siRNA and (Bottom) 26- to 30-nt RNA abundances at two intergenic hot spots loci.
Fig. 5.
Fig. 5.
DDB2 AGO1 homeostasis and DDB2−AGO1 complex. (A) In vivo pull-down of AGO1 with DDB2-FLAG protein upon UV-C exposure; ddb2-2/DDB2-FLAG, nrpd1 ddb2-2/DDB2-FLAG, and dcl4 ddb2-2/DDB2-FLAG expressing plants were used for IP assays using anti-FLAG antibody. WT (No) plants were used as negative control. Coomassie blue staining of the blot is shown. (B) Immunoblot analysis of DDB2 and AGO1 protein contents upon UV-C exposure in chromatin (pellet), supernatant, and total extracts from WT plants. Anti-histone H3 and anti-UGPase antibodies were used as controls for insoluble (Pellet; chromatin) and soluble fractions (Supernatant), respectively. Signal intensity relative to H3 or Coomassie is indicated below each lane. Coomassie blue staining of the blot is shown. (C) ChIP of (Left) DDB2-FLAG and (Right) AGO1, upon UV-C exposure, at four hot spots in ddb2-3/DDB2-FLAG expressing plants using anti-FLAG and anti-AGO1 antibodies, respectively. As negative control for DDB2 ChIP, WT (Col) plants were used with anti-FLAG antibody as well as actin2 region. As negative control for AGO1 ChIP, WT (Col) plants were used with protein A magnetic beads as well as actin2 region. Data are presented as enrichment (±SD) of the IP signal and are representative of three independent biological replicates; t test *P < 0.01; ns, nonsignificant compared with time point 0. (D) Tandem ChIP (Tandem-ChIP) of DDB2-FLAG and AGO1, upon UV-C exposure, at three hot spots in ddb2-3/DDB2-FLAG expressing plants using anti-FLAG antibody followed by anti-AGO1 antibody. As negative control for ChIP, WT (Col) plants were used as well as actin2 region. Data are presented as enrichment (±SD) of the IP signal and are representative of two independent biological replicates; t test *P < 0.01 compared with time point 0. (E) ChIP of DDB2-FLAG upon UV-C exposure, at three hot spots in ddb2-3 DDB2-FLAG, nrdp1 DDB2-FLAG, and dcl4 DDB2-FLAG expressing plants using anti-FLAG antibody. As negative control for DDB2 ChIP, WT (Col) plants were used with anti-FLAG antibody as well as actin2 region. Data are presented as enrichment (±SD) of the IP signal and are representative of three independent biological replicates; t test *P < 0.01; **P < 0.05; ns, nonsignificant compared with time point 0. (F) ChIP of AGO1, upon UV-C exposure, at three hot spots in WT, dcl4, and nrpd1 plants using anti-AGO1 antibody. As negative control for AGO1 ChIP, WT (Col) plants were used with protein A magnetic beads as well as actin2 region. Data are presented as enrichment (±SD) of the IP signal and are representative of three independent biological replicates; t test *P < 0.01; ns, nonsignificant compared with time point 0.
Fig. S5.
Fig. S5.
DDB2−AGO1 complex. (A) Root growth assay. Seven-day-old WT (Col), ddb2-3, ddb2-3/DDB2-FLAG, and ddb2-3/DDB2K314E-FLAG expressing plants were exposed to 900 J/m2 of UV-C; t test *P < 0.01; **P < 0.05. (B) In vivo pull-down of AGO1 with DDB2-FLAG protein upon UV-C exposure; ddb2-3/DDB2-FLAG and ddb2-3/DDB2K314E-FLAG expressing plants were used for IP assays using anti-FLAG antibody. WT (Col) plants were used as negative control. Coomassie blue staining of the blot is shown. (C) In vivo pull-down of AGO1 with DDB2-FLAG protein upon UV-C exposure; ddb2-2/DDB2-FLAG and atr ddb2-2/DDB2-FLAG expressing plants were used for IP assays using anti-FLAG antibody. WT (No) plants were used as negative control. Coomassie blue staining of the blot is shown. (D) Immunoblot analysis of DDB2 and AGO1 protein contents upon UV-C exposure in chromatin extracts from WT and atr plants. Anti-histone H3 and anti-UGPase antibodies were used as controls for insoluble (P, chromatin) and soluble (S) fractions, respectively. Signal intensity relative to H3 is indicated below each lane. (E) Same as D for AGO1 protein in ddb2 plants. (F) In vivo pull-down of AGO1 with DDB2 protein upon UV-C exposure in chromatin fraction; ddb2-2/DDB2-FLAG plants were used for IP assays using anti-FLAG antibody. WT plants were used as negative control. Anti-histone H3 and anti-UGPase antibodies were used as controls for insoluble (P, chromatin) and soluble (S) fractions, respectively. Coomassie blue staining of the blot is shown. (G) Tandem ChIP (Tandem-ChIP) of AGO1 and DDB2-FLAG, upon UV-C exposure, at two hot spots in ddb2-3/DDB2-FLAG expressing plants using anti-AGO1 followed by anti-FLAG antibody. As negative control for ChIP, WT plants were used as well as actin2 region. Data are presented as enrichment (±SD) of the IP signal and are representative of two independent biological replicates; t test *P < 0.01 compared with time point 0.
Fig. S6.
Fig. S6.
DDB2 and AGO1 RIP. (A) In vivo pull-down of AGO1 and DDB2-FLAG protein upon UV-C exposure during the RIP experiments; ddb2-3/DDB2-FLAG expressing plants were used with (Top) anti-FLAG or (Bottom) anti-AGO1 antibodies. WT plants were used as negative control. Coomassie blue staining of the blot is shown. The two independent biological replicates are shown. (B) Histograms representing the number of intergenic sequences exhibiting enrichment (IP/input) of 21-nt siRNAs in DDB2 RIP and AGO1 RIP ± UV-C. The number of overlapping sequences between DDB2 and AGO1 RIP are also shown. (C) Histograms (±SD) representing the enrichment (IP/input) of CPDs at six hot spots during the RIP experiments. (D) DDB2-FLAG coprecipitated nucleic acids from UV-C untreated and treated plants. (Left) The ddb2-3/DDB2-FLAG expressing plants were used with anti-FLAG antibody. Nucleic acids were isolated, 32P-radioactively labeled and treated with either A or DNase I (5 h incubation). Samples were fractionated onto a 15% urea PAGE. (Right) Untreated WT plants were used as control for IP with anti-FLAG antibody. Signal intensity relative to each time point 0 is indicated below each lane.
Fig. 6.
Fig. 6.
DDB2 associated 21-nt uviRNAs at damaged sites. (A) Schematic representation of AGO1 and DDB2-FLAG RIP data, showing examples of two hot spots. Log2 (IP/Input) of 21-nt ± UV-C are plotted in a RNA strand-specific manner (top bars: sense RNA; bottom bars: antisense RNA), and di-pyrimidines are plotted in a DNA strand-specific manner for each locus (top bars: DNA strand +; bottom bars: DNA strand −). (B) PCA of DDB2 RIP 21-nt uviRNAs and di-pyrimidines at six confirmed damaged loci; + and – indicate the DNA or RNA strands. (Left) Representation of DDB2 RIP data with center of gravity and lines connected to each coordinate enriched in 21-nt uviRNAs in a RNA strand-specific manner. RIP/RIP, equal enrichment of 21-nt uviRNAs mapping with each DNA strand; 0/RIP, enrichment of 21-nt uviRNAs mapping only with + DNA strand; RIP/0, enrichment of 21-nt uviRNAs mapping only with − DNA strand; RIP++/RIP, stronger enrichment of 21-nt uviRNAs mapping with − DNA strand than with the + DNA strand; 0/0, no 21-nt uviRNAs. PC1 explains 32% of the variation, and PC2 explains 24%. (Right) Circles of correlations of the PC1 and PC2 of the PCA built using di-pyrimidines (CC, TT, CT, and TC) in + and − DNA strands. (C) Fold change abundance (±SD) of sense and antisense 21-nt siRNA in CT-TC-rich DNA strands (+ and −) of Arabidopsis intergenic regions; t test *P < 0.01.
Fig. 7.
Fig. 7.
Model for siRNA-mediated GGR of UV-induced DNA damage. (Left) In the absence of UV-induced DNA damage, some intergenic genomic regions are transcribed by the RNA POL IV to form precursors that are further processed by RDR2. The produced dsRNAs are diced by DCL4 into 21-nt siRNAs and subsequently loaded into an AGO1 nuclear pool that can form a complex with DDB2. (Right) Upon UV-C exposure, CPDs are formed on DNA (yellow triangle). The 21-nt uviRNAs abundance is increased either by enhanced stabilization of 21-nt uviRNAs or of their dsRNA precursors or by increased DCL4 activity. The DDB2-AGO1-uviRNAs complex is loaded on chromatin at damaged sites. DDB2 would allow recognition of CPDs, and AGO1-uviRNAs would allow stabilization of the complex in an RNA−DNA complementary sequence manner. Upon this recognition step, the DDB2−AGO1−uviRNAs complex is released in an ATR-dependent manner from the damaged sites, allowing the next steps of the GGR to efficiently occur.

Similar articles

Cited by

References

    1. Schreier WJ, Gilch P, Zinth W. Early events of DNA photodamage. Annu Rev Phys Chem. 2015;66:497–519. - PubMed
    1. Sancar A. Photolyase and cryptochrome blue-light photoreceptors. Adv Protein Chem. 2004;69:73–100. - PubMed
    1. Schärer OD. Nucleotide excision repair in eukaryotes. Cold Spring Harb Perspect Biol. 2013;5:a012609. - PMC - PubMed
    1. Chu G, Chang E. Xeroderma pigmentosum group E cells lack a nuclear factor that binds to damaged DNA. Science. 1988;242:564–567. - PubMed
    1. Nichols AF, et al. Human damage-specific DNA-binding protein p48. Characterization of XPE mutations and regulation following UV irradiation. J Biol Chem. 2000;275:21422–21428. - PubMed

Publication types

MeSH terms