. 2017 Apr 4;114(14):E2846-E2851.
doi: 10.1073/pnas.1620316114. Epub 2017 Mar 21.

Ion and inhibitor binding of the double-ring ion selectivity filter of the mitochondrial calcium uniporter

Affiliations

Ion and inhibitor binding of the double-ring ion selectivity filter of the mitochondrial calcium uniporter

Chan Cao et al. Proc Natl Acad Sci U S A. .

Abstract

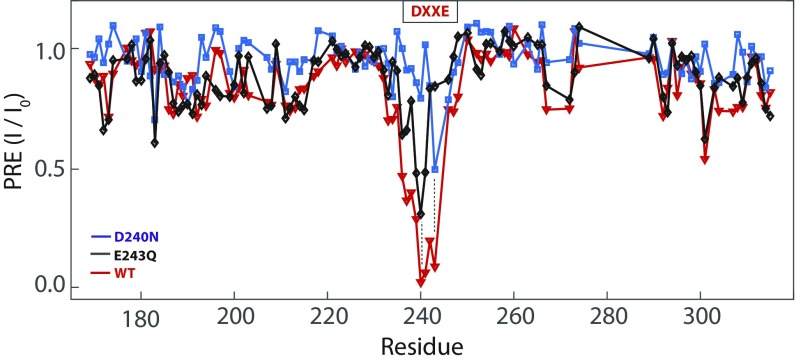
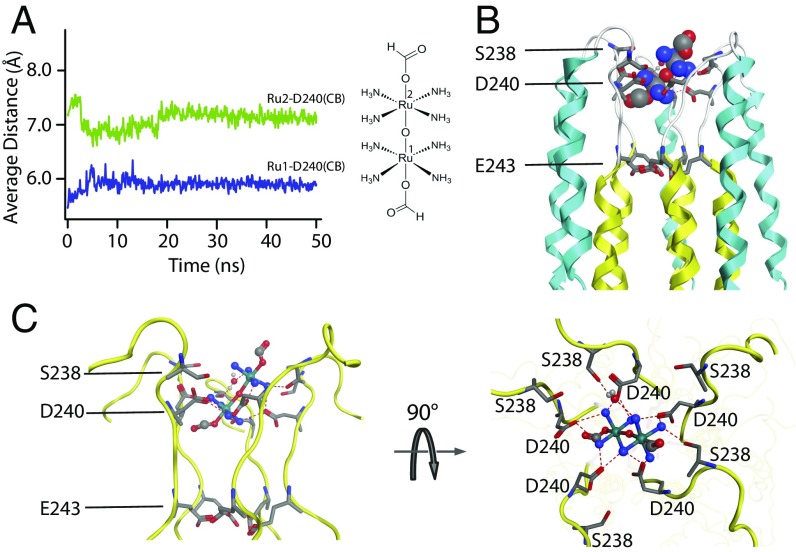
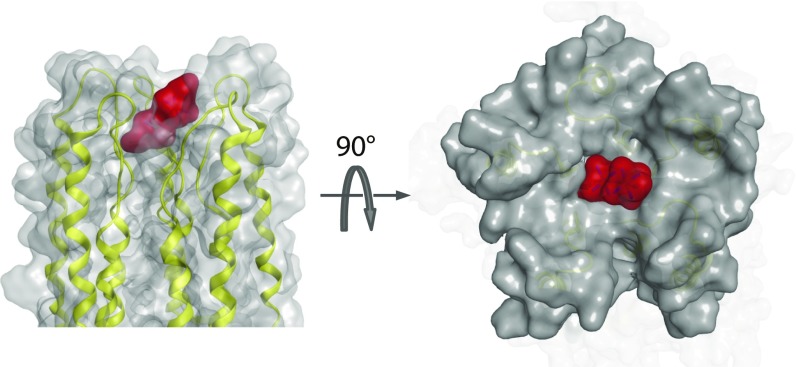
The calcium (Ca2+) uniporter of mitochondria is a holocomplex consisting of the Ca2+-conducting channel, known as mitochondrial calcium uniporter (MCU), and several accessory and regulatory components. A previous electrophysiology study found that the uniporter has high Ca2+ selectivity and conductance and this depends critically on the conserved amino acid sequence motif, DXXE (Asp-X-X-Glu) of MCU. A recent NMR structure of the MCU channel from Caenorhabditis elegans revealed that the DXXE forms two parallel carboxylate rings at the channel entrance that seem to serve as the ion selectivity filter, although direct ion interaction of this structural motif has not been addressed. Here, we use a paramagnetic probe, manganese (Mn2+), to investigate ion and inhibitor binding of this putative selectivity filter. Our paramagnetic NMR data show that mutants with a single carboxylate ring, NXXE (Asn-X-X-Glu) and DXXQ (Asp-X-X-Gln), each can bind Mn2+ specifically, whereas in the WT the two rings bind Mn2+ cooperatively, resulting in ∼1,000-fold higher apparent affinity. Ca2+ can specifically displace the bound Mn2+ at the DXXE site in the channel. Furthermore, titrating the sample with the known channel inhibitor ruthenium 360 (Ru360) can displace Mn2+ binding from the solvent-accessible Asp site but not the inner Glu site. The NMR titration data, together with structural analysis of the DXXE motif and molecular dynamics simulation, indicate that the double carboxylate rings at the apex of the MCU pore constitute the ion selectivity filter and that Ru360 directly blocks ion entry into the filter by binding to the outer carboxylate ring.

Keywords: MCU; NMR; Ru360 binding; calcium channel; selectivity filter.


Conflict of interest statement

The authors declare no conflict of interest.

Figures

Fig. 1.
Fig. 1.
Specific PRE of the WT DXXE motif induced by Mn2+. (A) Superimposition of 2D 1H-15N TROSY-HSQC spectra of 20 µM (pentamer) U-[15N, 13C, 2H] cMCU-∆NTD without (red) and with (cyan) 40 µM Mn2+ shows that PRE effects of Mn2+ are localized in the DXXE motif. (B) Comparison of 3D TROSY-HNCO spectra of 20 µM (pentamer) U-[15N, 13C, 2H] cMCU-∆NTD before (Top) and after (Bottom) addition of 40 µM Mn2+, showing the specific PREs of the DXXE motif in more resolved spectra. (C) Mapping the strong PREs (I/I0 ≤0.5) in A onto the cMCU-∆NTD structure (red: I/I0 ≤ 0.2; cyan: 0.2 < I/I0 ≤ 0.5). (D) Backbone amide PRE is plotted against residue number for the TM domain. The residues with overlap or without assignment are labeled with an asterisk. (E) The D240 and E243 peak intensities decrease with Mn2+ titration. The data were obtained from 2D 1H-15N TROSY-HSQC spectra with Mn2+ titrated into 20 µM (pentamer) cMCU-∆NTD. (F) Plots of I/I0 vs. [Mn2+] for D240 (black) and E243 (red) of the WT cMCU-∆NTD and recovery of I/I0 upon addition of 10, 20, and 30 mM Ca2+.
Fig. S1.
Fig. S1.
NMR sample preparation of cMCU-ΔNTD. (A) Size-exclusion elution profile of cMCU-ΔNTD from the Superdex 200 10/300 GL column in 20 mM MES (pH 6.4), 75 mM NaCl, 0.48 mM Foscholine-14, and 0.3 mM NaN3. (B) SDS/PAGE analysis of the elution peak in A showing sample purity >95%. The lane numbers correspond to the elution fraction numbers in A. (C) The 2D 1H-15N TROSY-HSQC spectrum of (15N, 13C, 2H)-labeled cMCU-ΔNTD from A, recorded at 750 MHz 1H frequency and 306 K.
Fig. S2.
Fig. S2.
Comparison of 3D TROSY-HNCO spectra of 20 µM (pentamer) U-[15N, 13C, 2H] cMCU-∆NTD without Mn2+ or Ca2+ (Top), with 20 µM Mn2+ (Middle) addition, and with 20 µM Mn2+ and 30 mM Ca2+ (Bottom), showing specific PREs of the DXXE motif due to Mn2+ and specific displacement of Mn2+ by Ca2+.
Fig. S3.
Fig. S3.
NMR sample preparation of the single-ring cMCU-ΔNTD mutants DXXQ and NXXE. (A) Overlay of size-exclusion elution profiles of cMCU-ΔNTD variants DXXE, DXXQ, and NXXE from the Superdex 200 10/300 GL column in 20 mM MES (pH 6.4), 75 mM NaCl, 0.48 mM Foscholine-14, and 0.3 mM NaN3. (B) Superposition of 2D 1H-15N TROSY-HSQC spectrum of DXXE (red) with that of DXXQ (cyan) on the left and NXXE (cyan) on the right, showing that the mutations did not cause significant changes in the protein structure.
Fig. 2.
Fig. 2.
PRE of the mutant DXXQ and NXXE motifs induced by Mn2+. (A) PRE (I/I0) vs. [Mn2+] plots for D240 in the WT DXXE (black) and the DXXQ mutant (blue). The channel concentration is 20 µM. (B) PRE vs. [Mn2+] plots for E243 in the WT DXXE (red) and the NXXE mutant (green). The channel concentration is 20 µM. (C) PRE vs. [Mn2+] plots for D240 (blue) and Q243 (gray) in the DXXQ mutant. (D) PRE vs. [Mn2+] plots for E243 (green) and N240 (gray) in the NXXE mutant. (E) At 40 μM Mn2+, which caused PRE saturation of D and E in the WT DXXE, the D and E of the single-ring mutants showed 70% and 50% signal reduction, respectively. (F) Comparison between the PRE-derived [Mn2+]bound/[channel] and simulated binding curves for the one-site (Eq. 1) and two-site (Eq. 2) systems (Materials and Methods). For the one-site mutants, [Mn2+]Bound/[channel] (calculated as 1− I/I0) and simulated curves are shown for DXXQ (yellow) and NXXE (red). For the two-site WT, the [Mn2+]Bound/[channel] points were calculated using Eq. 3 (shown in purple). The two-site binding curves with n = 1 (no cooperativity), n = 100, and n = 1,000 are shown in black, blue, and purple, respectively.
Fig. S4.
Fig. S4.
The complete PRE (I/I0) vs. residue number plots for three cMCU-∆NTD variants: DXXE (red), DXXQ (black), and NXXE (blue). The two dashed lines mark residue positions 240 and 243.
Fig. S5.
Fig. S5.
Comparison of (1 – PRE) of D (yellow) or E (red) of the single-ring mutants with simulated binding curves for the one-site model. For the PRE data, 20 µM mutant channels were titrated with 0, 4, 6, 10, 15, 20, 25, 30, and 40 µM Mn2+ under our NMR titration condition. The binding curve was plotted using Eq. 1 for a fixed channel concentration (20 µM) at Kd values of 1, 10, 30, 100, and 300 μM.
Fig. S6.
Fig. S6.
Sum of (1 – PRE) for the D site and (1 – PRE) for the E site at various Mn2+ concentrations for the WT DXXE. This is the raw PRE data before correction to subtract the cross-site PRE.
Fig. 3.
Fig. 3.
The Ru360/Mn2+ replacement titration for the single-ring mutants. (A) The crystal structure of Ru360 showing a linear dimer containing two octahedral rutheniums linked by an oxygen bridge with the ends of the molecule capped with formates. (B) The cMCU-∆NTD NMR structure showing that S238 is located at the apex of the pore adjacent to D240. (C) D240 peak intensity recovery by Ru360 titration at 0, 0.1, 0.5, and 1 mM. The mutant channel concentration used for Mn2+ and Ru360 titration is 20 µM. (D) The D240 recovery curve is shown as normalized peak intensity vs. [Ru360], in which the normalized peak intensity is defined as I (peak height at a given concentration of Ru360)/I0 (peak height without Mn2+ or Ru360). (E) The E243 peak recovery by Ru360 titration at 0, 0.1, 0.5, and 1 mM. (F) The E243 recovery curve as in C but shows no peak recovery.
Fig. 4.
Fig. 4.
MD simulation of Ru360 binding to the MCU pore. (A) The distances between the ruthenium centers of Ru360 and the β carbons of D240 (averaged over the five protomers) vs. simulation time. (B) The average Ru360 position relative to the cMCU-∆NTD NMR structure showing the overall location of the inhibitor. (C) Zoomed side and top views of Ru360 interacting with D240 of the DXXE selectivity filter, showing possible hydrogen bonds between MCU and Ru360 (dashed lines).
Fig. 5.
Fig. 5.
Proposed model for Ca2+ binding to the MCU selectivity filter. (A) Coordination of K+ ions either at the S1 and S3 sites or at the S2 and S4 sites, with water molecules (red sphere) bound to the alternate sites between the two K+ ions (green sphere). The distance between the two K+ ions is 7.5 Å [atomic coordinates from Protein Data Bank (PDB) ID code 1BL8]. (B) The NMR structure ensemble of the DXXE motif showing the average distance between the D and E rings is 8.0 ± 1.5 Å (atomic coordinates from PDB ID code 5ID3). The green spheres represent hypothetical ions bound at the two ring positions. (C) The proposed Ca2+ pentagonal bipyramid coordination as five oxygen atoms of D or E ring coordinate ion in a plane while water molecules on the two sides of the plane interact with the ion along the pore axis.
Fig. S7.
Fig. S7.
Diagrammatic representation of the calcium coordination on the fivefold axis for the pentameric rhinovirus protein (35). The two representations are from different serotypes of human rhinovirus (HRV): (Left) HRV14 and (Right) HRV3.
Fig. S8.
Fig. S8.
Shape and surface complementarity between MCU and Ru360. The surfaces of the pore region of MCU and Ru360 are shown in gray and red, respectively. The Ru360–MCU complex model was generated by MD simulation in Fig. 4.

References

    1. Deluca HF, Engstrom GW. Calcium uptake by rat kidney mitochondria. Proc Natl Acad Sci USA. 1961;47(11):1744–1750. - PMC - PubMed
    1. Vasington FD, Murphy JV. Ca ion uptake by rat kidney mitochondria and its dependence on respiration and phosphorylation. J Biol Chem. 1962;237(13925019):2670–2677. - PubMed
    1. Denton RM, McCormack JG. The role of calcium in the regulation of mitochondrial metabolism. Biochem Soc Trans. 1980;8(3):266–268. - PubMed
    1. Gunter TE, Pfeiffer DR. Mechanisms by which mitochondria transport calcium. Am J Physiol. 1990;258(5 Pt 1):C755–C786. - PubMed
    1. Kirichok Y, Krapivinsky G, Clapham DE. The mitochondrial calcium uniporter is a highly selective ion channel. Nature. 2004;427(6972):360–364. - PubMed

Publication types

MeSH terms

LinkOut - more resources