. 2017 Mar 19;9(3):615-626.
doi: 10.18632/aging.101206.

Physiological frailty index (PFI): quantitative in-life estimate of individual biological age in mice

Affiliations

Physiological frailty index (PFI): quantitative in-life estimate of individual biological age in mice

Marina P Antoch et al. Aging (Albany NY). .

Abstract

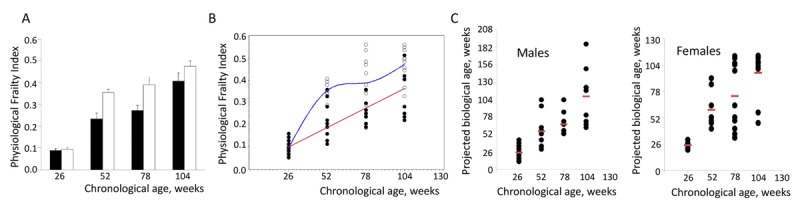
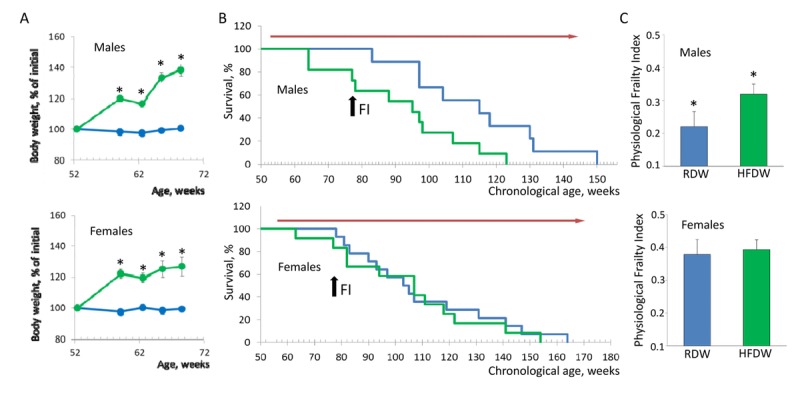
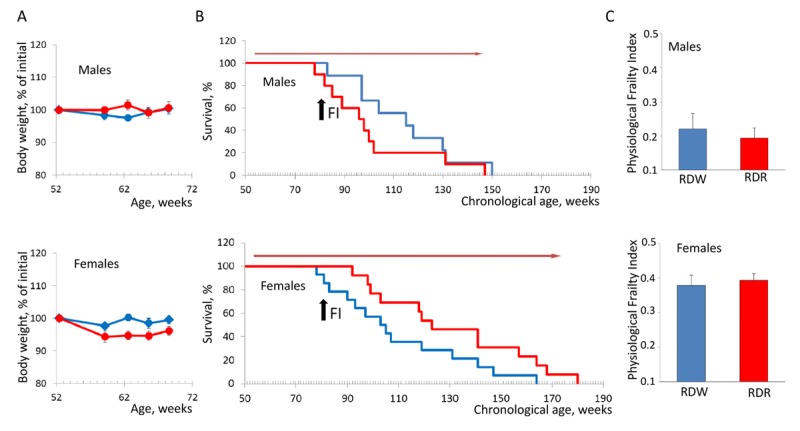
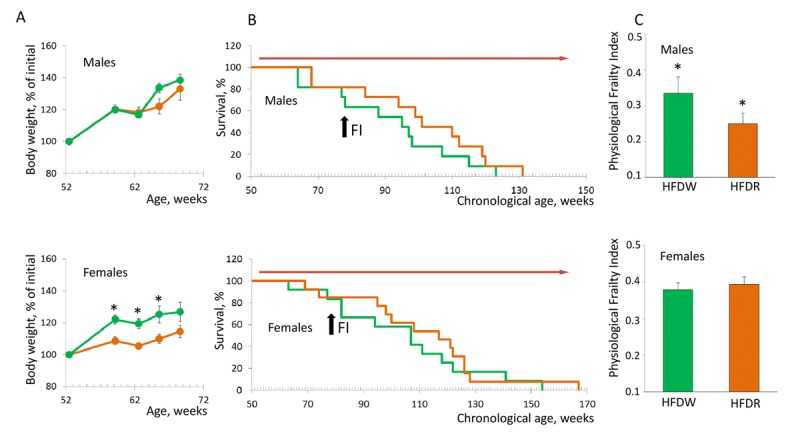
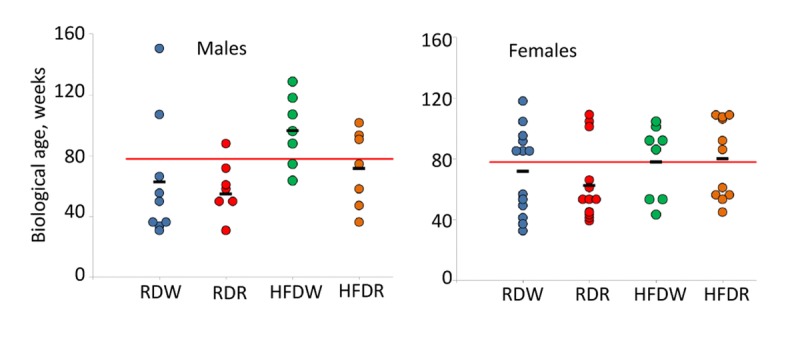
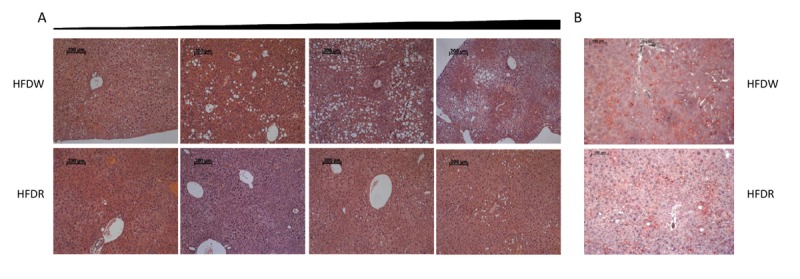
The development of healthspan-extending pharmaceuticals requires quantitative estimation of age-related progressive physiological decline. In humans, individual health status can be quantitatively assessed by means of a frailty index (FI), a parameter which reflects the scale of accumulation of age-related deficits. However, adaptation of this methodology to animal models is a challenging task since it includes multiple subjective parameters. Here we report a development of a quantitative non-invasive procedure to estimate biological age of an individual animal by creating physiological frailty index (PFI). We demonstrated the dynamics of PFI increase during chronological aging of male and female NIH Swiss mice. We also demonstrated acceleration of growth of PFI in animals placed on a high fat diet, reflecting aging acceleration by obesity and provide a tool for its quantitative assessment. Additionally, we showed that PFI could reveal anti-aging effect of mTOR inhibitor rapatar (bioavailable formulation of rapamycin) prior to registration of its effects on longevity. PFI revealed substantial sex-related differences in normal chronological aging and in the efficacy of detrimental (high fat diet) or beneficial (rapatar) aging modulatory factors. Together, these data introduce PFI as a reliable, non-invasive, quantitative tool suitable for testing potential anti-aging pharmaceuticals in pre-clinical studies.

Keywords: aging; chronological age; high fat diet; obesity; rapamycin; rapatar.


Conflict of interest statement

CONFLICTS OF INTEREST

O.B.C. and A.V.G. are co-founders and shareholders of Everon Biosciences.

Figures

Figure 1
Figure 1. Assessment of individual biological age of NIH Swiss mice
(A) Age-related increase in PFI in male (closed bars) and female (open bars) NIH Swiss mice (n=10-12/group). PFI indices were measured as described using 16 or 18 parameters for males and females respectively. Data is presented as mean ±SEM. One-way ANOVA detects significant effect of age on FI value (p<0.001 for both sexes). (B) PFI values for individual male (closed circles) and female (open circles) mice. A cubic regression performed on this set of data generated the best fitting model as: PFI=0.00684+0.0034×BA for males (red line) and PFI=-0.67372+0.04277×CA-0.00057899×CA2+0.00000263×CA3 for females (blue line). All regression coefficients presented were significantly different from 0 at the 0.05 alpha-level. (C) Projected biological age of individual mice calculated from the PFI values using the fitting model predictions.
Figure 2
Figure 2. Sex-specific effects of HFD on lifespan and health of NIH Swiss mice
(A) HFD-induced body weight gain in male and female mice. Feeding HFD results in 40% and 30% increase in body weight in males and females respectively (p<0.001, Student's t-test). Since mortality is usually preceded by rapid weight loss, data is shown for the initial period of treatment before the first case of death in each group was recorded. Blue line – regular diet; green line – HFD. (B) Feeding HFD reduces lifespan of male mice from 121.1±9.2 to 91.5±5.9 weeks (p=0.008, Kaplan-Meier log-rank test) but had no effect on longevity of female mice (109.6 ±6.9 and 104.9±7.7 weeks for mice fed regular or high fat chow respectively). Blue line – regular diet; green – HFD. Red arrow indicates the period of time when mice received HFD. Black arrow indicates time when PFI was measured (at the age of 78 weeks). (C) PFI created at 78 weeks of age using 16 or 18 parameters for male and female mice respectively. Feeding HFD significantly increases PFI of male (p=0.019, Student's t-test) but not female mice. RDW - regular diet in combination with water (group 1), HFDW – HFD in combination with water (group 3).
Figure 3
Figure 3. Sex-specific effects of rapamycin on lifespan and health of NIH Swiss mice
(A) Animals receiving rapamycin in drinking water maintain their body weights comparable to control mice. Blue line – normal drinking water; red line – water with rapamycin. (B) Kaplan-Meier survival curves for mice fed regular chow in combination with normal drinking water (blue line) or rapamycin (red line). Chronic administration of rapamycin has no effect on longevity of male mice (mean survival is 113.91±6.98 and 100.8±6.96 weeks for control and rapamycin-treated mice respectively. In females, rapamycin administration increases lifespan from 110.09±7.12 to 131.23±8.29 weeks (p=0.05, Kaplan-Meier log-rank test). Red arrow indicates the period of time when mice received rapamycin. Black arrow indicates time when PFI was measured. (C) PFI created at described above. No effect of rapamycin on health status was detected in male and female mice fed regular chow. RDW – regular diet in combination with normal drinking water (group1); RDR – regular diet in combination with rapamycin (group 2).
Figure 4
Figure 4. Chronic treatment with rapamycin ameliorates HFD-induced health decline in male mice
(A) Rapamycin prevents HFD-induced weight gain in female but not in male mice (p<0.01, Student's t-test). Green – HFD given with normal water, orange – HFD given in combination with rapamycin. (B) Kaplan-Meier survival curves for mice fed HFD in combination with normal drinking water (green line) or rapamycin (orange line). Chronic administration of rapamycin has no effect on longevity of both male (mean survival is 91.5±5.9 and 100.5±6.26 weeks) and female mice (mean survival is 104.9±7.7 and 110.5±7.6 weeks for control and rapamycin-treated mice respectively). Red arrow indicates the period of time when mice received rapamycin. Black arrow indicates time when PFI was measured. (C) PFI created at 78 weeks of age using 16 or 18 parameters for male and female mice respectively. Chronic administration of rapamycin ameliorates detrimental effect of HFD and brings the PFI values down to the normal range characteristic for this age (p=0.014, Student's t-test). HFDW – high-fat diet in combination with regular drinking water (group 3), HFDR – high-fat diet in combination with rapamycin (group 4).
Figure 5
Figure 5. Sex-specific effects of detrimental (HFD) and beneficial (rapamycin) factors on BA of NIH Swiss mice
Feeding HFD accelerates aging of NIH Swiss male mice whereas rapamycin counteracts this process. Projected biological age of individual mice (shown by circles) and mean BA for the group (black marker) were calculated from the corresponding FI value using the fitting model predictions. Red line designates chronological age of all mice at the time of testing (78 weeks). Data show that projected BA of all mice that received HFD (green circles) is significantly higher that their actual chronological age and mean BA age for control group on regular diet (62.7±13.3 and 96.4±8.8 weeks for RDW and HFDW groups respectively (p=0.03, Student's t-test). Chronic administration of rapamycin reduces BA of males fed HFD to values characteristic for control group (from 96.4±8.8 to 71.5±9.6 weeks; p=0.04, Student's t-test). No difference between groups was detected in female mice, in which BA was very close to their CA. Slight reduction in BA in rapamycin treated group from 71.8±7.8 to 62.6±7.0 weeks was not statistically significant (p=0.3 Student's t-test).
Figure 6
Figure 6. Rapamycin prevents development of HFD-induced hepatic steatosis in male mice
(A) H&E staining of representative liver sections graded from the least affected (left) to the worst affected (right) within each group. (B) Representative oil-red O stained sections of livers. HFDW – mice fed with HFD; HFDR – mice received HFD in combination with rapamycin.

References

    1. López-Otín C, Blasco MA, Partridge L, Serrano M, Kroemer G. The hallmarks of aging. Cell. 2013;153:1194–217. doi: 10.1016/j.cell.2013.05.039. - DOI - PMC - PubMed
    1. Rodier F, Campisi J. Four faces of cellular senescence. J Cell Biol. 2011;192:547–56. doi: 10.1083/jcb.201009094. - DOI - PMC - PubMed
    1. Mitnitski A, Rockwood K. Aging as a process of deficit accumulation: its utility and origin. Interdiscip Top Gerontol. 2015;40:85–98. doi: 10.1159/000364933. - DOI - PubMed
    1. Howlett SE. Assessment of Frailty in Animal Models. Interdiscip Top Gerontol Geriatr. 2015;41:15–25. - PubMed
    1. Rockwood K, McMillan M, Mitnitski A, Howlett SE. A Frailty Index Based on Common Laboratory Tests in Comparison With a Clinical Frailty Index for Older Adults in Long-Term Care Facilities. J Am Med Dir Assoc. 2015;16:842–47. doi: 10.1016/j.jamda.2015.03.027. - DOI - PubMed

Publication types