. 2017 Mar 21;18(1):183.
doi: 10.1186/s12859-017-1579-y.

metaX: a flexible and comprehensive software for processing metabolomics data

Affiliations

metaX: a flexible and comprehensive software for processing metabolomics data

Bo Wen et al. BMC Bioinformatics. .

Abstract

Background: Non-targeted metabolomics based on mass spectrometry enables high-throughput profiling of the metabolites in a biological sample. The large amount of data generated from mass spectrometry requires intensive computational processing for annotation of mass spectra and identification of metabolites. Computational analysis tools that are fully integrated with multiple functions and are easily operated by users who lack extensive knowledge in programing are needed in this research field.

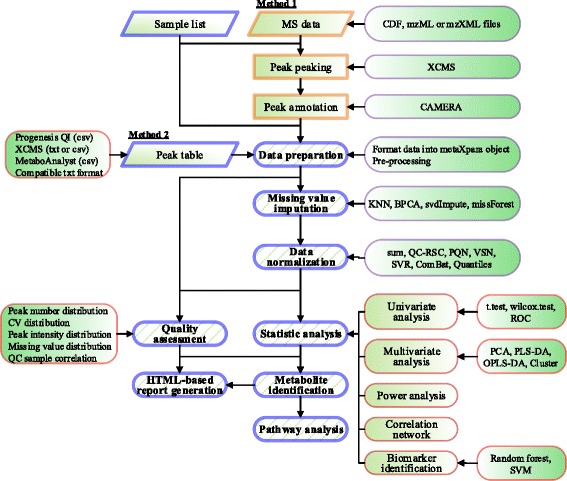
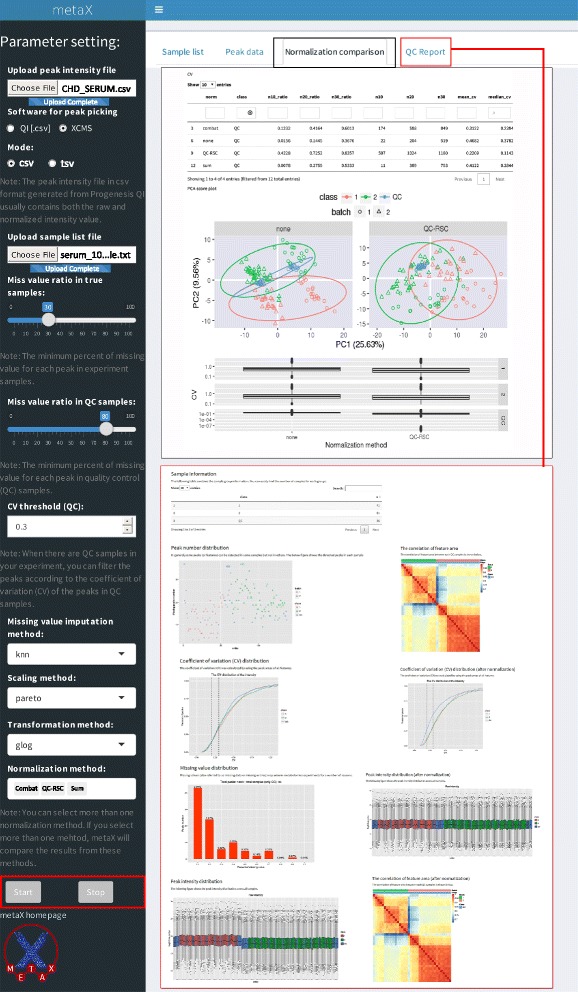
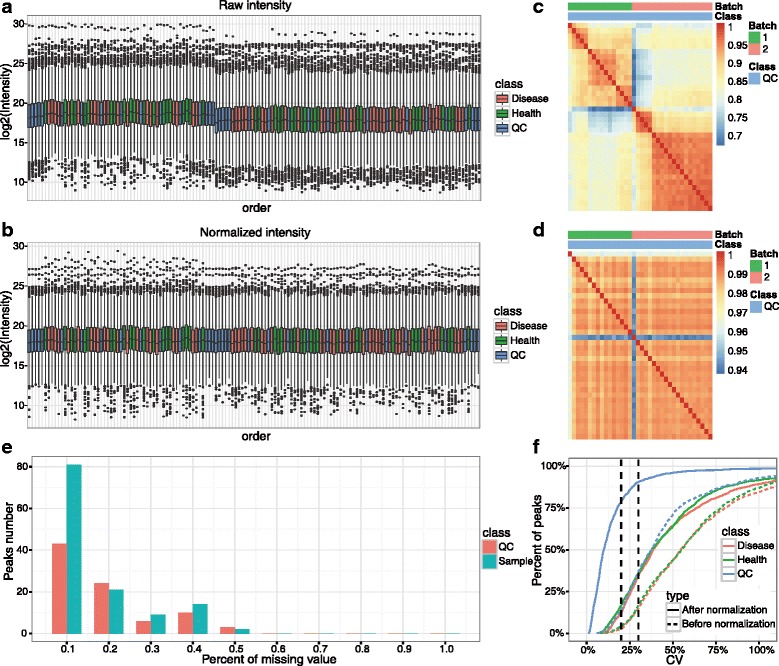
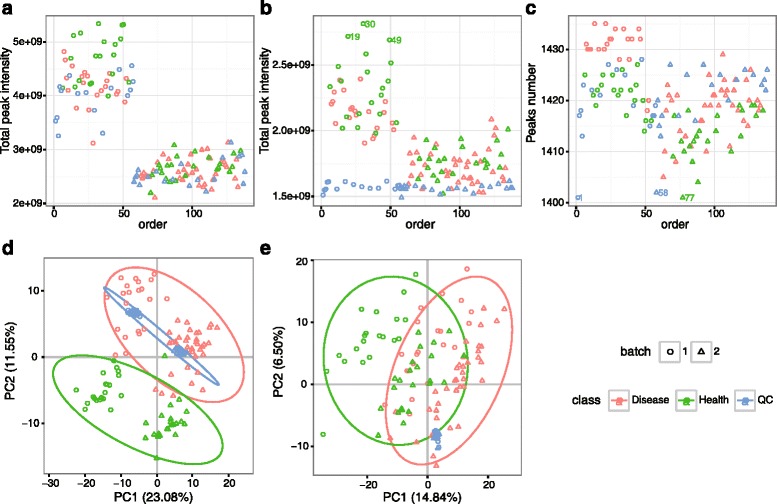
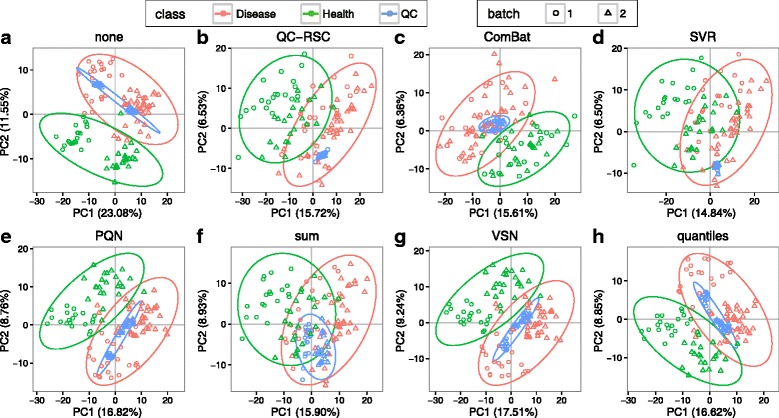
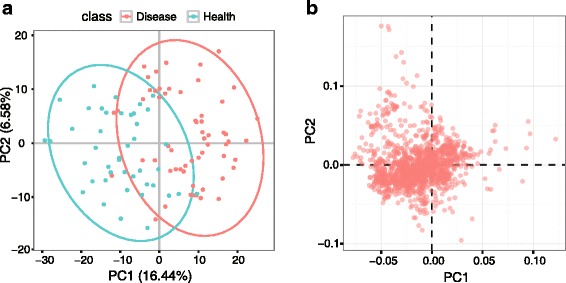
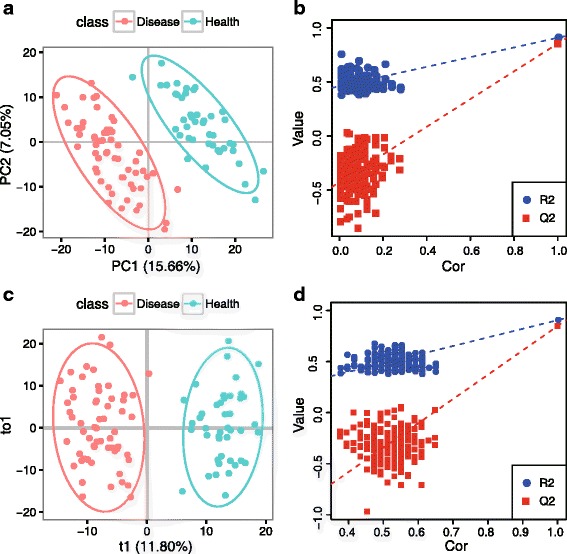
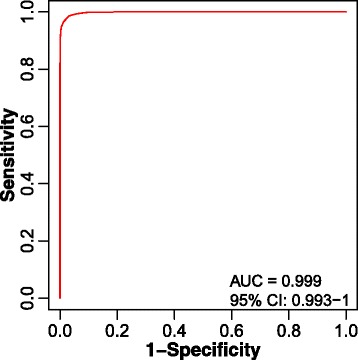
Results: We herein developed an R package, metaX, that is capable of end-to-end metabolomics data analysis through a set of interchangeable modules. Specifically, metaX provides several functions, such as peak picking and annotation, data quality assessment, missing value imputation, data normalization, univariate and multivariate statistics, power analysis and sample size estimation, receiver operating characteristic analysis, biomarker selection, pathway annotation, correlation network analysis, and metabolite identification. In addition, metaX offers a web-based interface ( http://metax.genomics.cn ) for data quality assessment and normalization method evaluation, and it generates an HTML-based report with a visualized interface. The metaX utilities were demonstrated with a published metabolomics dataset on a large scale. The software is available for operation as either a web-based graphical user interface (GUI) or in the form of command line functions. The package and the example reports are available at http://metax.genomics.cn/ .

Conclusions: The pipeline of metaX is platform-independent and is easy to use for analysis of metabolomics data generated from mass spectrometry.

Keywords: Metabolomics; Normalization; Pipeline; Quality control; Workflow.


Figures

Fig. 1
Fig. 1
Overview of metaX. This figure summarizes the main modules, functions and features of metaX. The input data and the functions are included in the figure
Fig. 2
Fig. 2
User interface of metaX for quality assessment and normalization evaluation
Fig. 3
Fig. 3
QC charts generated by metaX. a The intensity of feature distribution before normalization. b The intensity of feature distribution after normalization. c The correlation plot of QC samples before normalization. d The correlation plot of QC samples after normalization. e The missing value distribution in experimental and QC samples. f The CV distribution of all features before and after normalization for each group
Fig. 4
Fig. 4
QC charts generated by metaX. a The sum intensity of all features per sample before normalization over the analysis time (injection order). b The sum intensity of all features per sample after normalization over the analysis time (injection order). c The number of features per sample over the analysis time (injection order). d The score plot of PCA for the raw feature intensity data. e The score plot of PCA for the normalized data
Fig. 5
Fig. 5
Comparison of different normalization methods from PCA. a none, b QC-RSC, c ComBat, d SRV, e) PQN, f sum, g VSN and h quantiles. The different points in the figures refer to different samples, and the samples were color-coded according to their group information and shape-coded according to their batch information
Fig. 6
Fig. 6
The score and loading plots of PCA. a Score plot of PCA and (b) Loading plot of PCA. The different points in the figures refer to different samples, and the samples are color-coded according to their group information. The QC samples were removed before performing the PCA analysis
Fig. 7
Fig. 7
The score and permutation test plots of PLS-DA and OPLS-DA. a Score plot of PLS-DA. R2Y: 0.908, Q2Y: 0.854. b Permutation test plot of PLS-DA, p-value < = 0.05. c Score plot of OPLS-DA. R2Y: 0.905, Q2Y: 0.847. d Permutation test plot of OPLS-DA, p-value < = 0.05. The different points in the score plots (A and C) refer to different samples, and the samples are color-coded according to their group information. The number of permutations for the permutation test is 200
Fig. 8
Fig. 8
The ROC curve result of the six selected metabolites
Fig. 9
Fig. 9
The differential correction network. The top six largest numbers of nodes communities were color-coded. Detailed information about the samples and their communities are presented in Table S3

Similar articles

Cited by

References

    1. Rochfort S. Metabolomics Reviewed: A New “Omics” Platform Technology for Systems Biology and Implications for Natural Products Research. J Nat Prod. 2005;68(12):1813–20. doi: 10.1021/np050255w. - DOI - PubMed
    1. Gowda GAN, Djukovic D. Overview of Mass Spectrometry-Based Metabolomics. Oppor Challenges. 2014;1198:3–12. - PMC - PubMed
    1. Frédérich M, Pirotte B, Fillet M, de Tullio P. Metabolomics as a Challenging Approach for Medicinal Chemistry and Personalized Medicine. J Med Chem. 2016;59(19):8649–66. doi: 10.1021/acs.jmedchem.5b01335. - DOI - PubMed
    1. Smith CA, Want EJ, O’Maille G, Abagyan R, Siuzdak G. XCMS: processing mass spectrometry data for metabolite profiling using nonlinear peak alignment, matching, and identification. Anal Chem. 2006;78(3):779–87. doi: 10.1021/ac051437y. - DOI - PubMed
    1. Kuhl C, Tautenhahn R, Bottcher C, Larson TR, Neumann S. CAMERA: an integrated strategy for compound spectra extraction and annotation of liquid chromatography/mass spectrometry data sets. Anal Chem. 2012;84(1):283–9. doi: 10.1021/ac202450g. - DOI - PMC - PubMed

LinkOut - more resources