. 2017 Mar 21;18(1):243.
doi: 10.1186/s12864-017-3630-9.

Interferon signaling in ascites-associated macrophages is linked to a favorable clinical outcome in a subgroup of ovarian carcinoma patients

Affiliations

Interferon signaling in ascites-associated macrophages is linked to a favorable clinical outcome in a subgroup of ovarian carcinoma patients

Till Adhikary et al. BMC Genomics. .

Abstract

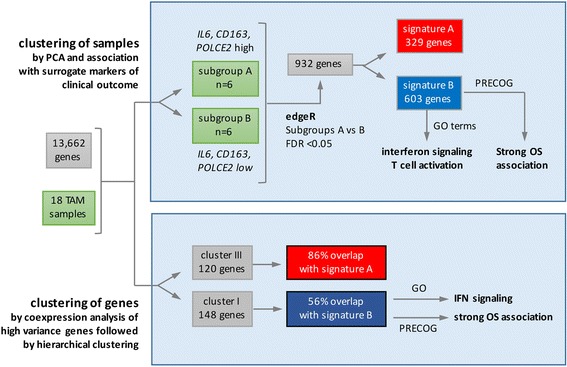
Background: Although tumor-associated macrophages (TAMs) are essential for cancer progression, connections between different clinical outcomes and transcriptional networks have not been reported. We have addressed this issue by analyzing global expression patterns of TAMs isolated from the ascites of ovarian cancer patients.

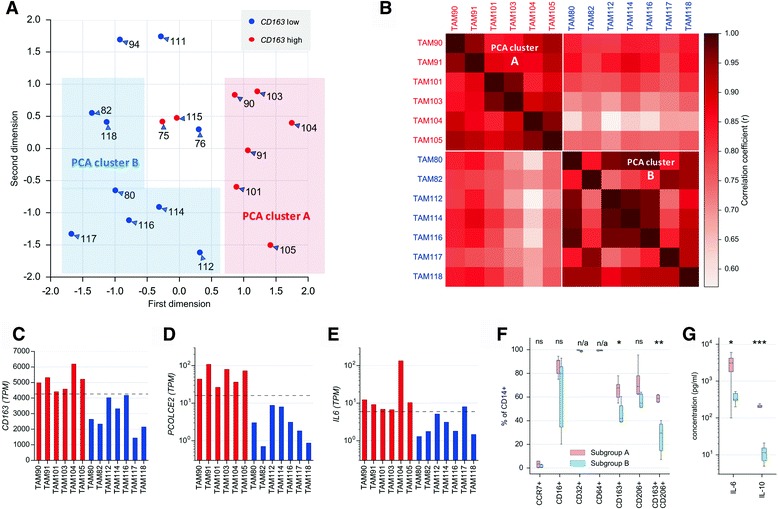
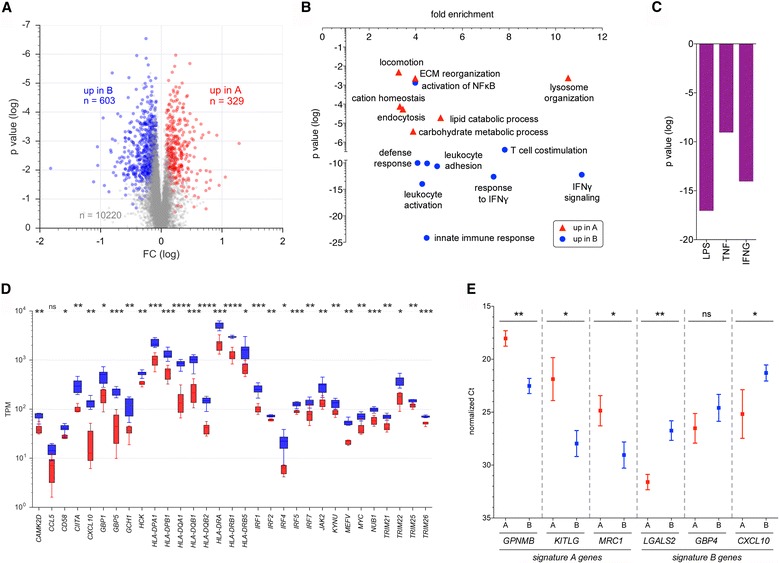
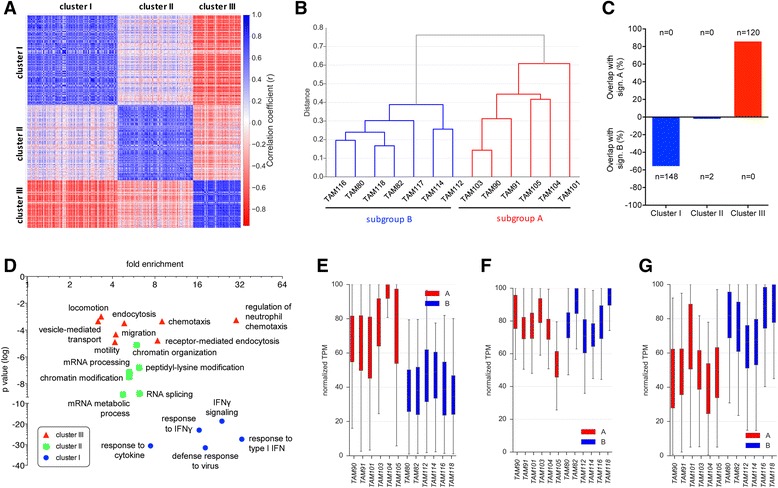
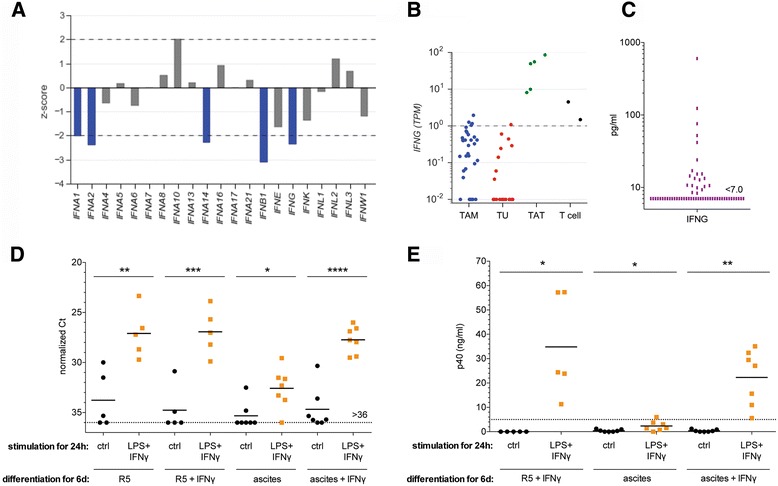
Results: TAMs isolated from different ovarian cancer patients can be stratified by coexpression or principal component analysis into subgroups with specific biological features and associated with distinct clinical outcomes. A hallmark of subgroup A is a high expression of clinically unfavorable markers, including (i) high CD163 expression, a surface receptor characteristic of an anti-inflammatory activation state, (ii) increased PCOLCE2 expression, indicative of enhanced extracellular matrix organization, and (iii) elevated ascites levels of IL-6 and IL-10, linked to the aggressiveness of ovarian cancer and immune suppression. In contrast, subgroup B TAMs are characterized by the upregulation of genes linked to immune defense mechanisms and interferon (IFN) signaling. Intriguingly, analysis of published data for 1763 ovarian cancer patients revealed a strong association of this transcriptional signature with a longer overall survival. Consistent with these results, IFNγ was able to abrogate the suppressive effect of ovarian cancer ascites on the inducibility of IL12B expression and IL-12 secretion, a key determinant of a cytotoxic immune response.

Conclusions: The survival of ovarian cancer patients is linked to the presence of TAMs with a transcriptional signature that is characterized by a low expression of protumorigenic and immunosuppressive markers and an upregulation of genes linked to interferon signaling. The observed IFNγ-mediated restoration of the inducibility of IL-12 in the presence of ascites provides a possible explanation for the association of an interferon signaling-associated signature with a favorable clinical outcome.

Keywords: CD163; Interferon signaling; Interleukin 10; Interleukin 6; Ovarian cancer ascites; PCOLCE2; Tumor-associated macrophages.


Figures

Fig. 1
Fig. 1
Schematic representation of data analysis and summary of results. Nomenclature for designation of clusters: TAM samples clustered by PCA: letters (A, B); genes clustered by coexpression analysis: roman numbers (I, II, III). Genes identified by edgeR and upregulated in TAM subgroup A or B were defined as signature A and B, respectively
Fig. 2
Fig. 2
Clustering of ovarian carcinoma TAM samples based on RNA-Seq data. a Principal component analysis (PCA) of TAM transcriptomes. Samples with high expression of CD163 (TPM > median) are shown in red (sub A), samples with low expression of CD163 in blue (sub B). b Heatmap based on Pearson correlation coefficients (r) calculated for the TAM transcriptomes identified by PCA (sorted by subgroups). c-e Expression of IL6, PCOLCE2 and CD163 in TAM samples of clusters A (red) and B (blue). Dotted lines show the quantiles used in panel (a). f Flow cytometry analysis of cluster A and B samples. The plot shows the fraction of CD16+, CD32+, CD64+, CD163+, CD206+ and CD163+CD206+ cells (of CD14+ cells). g Concentrations of IL-6 and IL10 in the ascites of cluster A and B patients determined by ELISA. Boxes show the upper and lower quartiles, whiskers the 95% confidence intervals (CI), and horizontal lines the median. Asterisks indicate the statistical significance determined by unpaired t test (cluster A versus B samples). n/a, not applicable since all values >97%; ns: not significant
Fig. 3
Fig. 3
Identification of differentially expressed genes in subgroup A versus B TAMs by edgeR. a Scatter plot showing the expression of genes identified by the edgeR tool (FDR <0.05) in TAM subgroups A or B identified by PCA in Fig. 2. Data represent the ratio (FC) of median TPM values for subgroup A versus subgroup B. b Functional annotation of genes upregulated in subgroup A (red) or subgroup B (blue) by gene ontology (GO) enrichment analysis. p values are plotted against fold enrichment. Only specific non-redundant terms with p values <0.01 and enrichment >3 are shown. c Upstream Regulator Analysis (Ingenuity Pathways Analysis database) of upregulated genes with p < 10−8. d Expression of the IFN signaling-associated genes of signature B identified by GO enrichment analysis (c). Boxes show the upper and lower quartiles, whiskers the 95% CI, and horizontal lines the median. e Validation of RNA-Seq data. Analysis by RT-qPCR of signature A and B genes (Additional file 2: Datasets S3 and S4) in TAM samples from subgroup A and B (n = 6). Error bars show the standard deviation and horizontal lines the mean. Red: cluster A samples; blue: cluster B samples. Asterisks indicate the statistical significance determined by unpaired t test (cluster A versus B samples); ns: not significant
Fig. 4
Fig. 4
Coexpression analysis of all TAM samples. a Correlation based heatmap of gene clusters (I, II and III; 265, 222 and 139 genes, respectively) defined by coexpression analysis of genes with the highest variance across all TAM samples, followed by hierarchical clustering (see Additional file 3: Figure S4 for a dendrogram). b Hierarchical clustering of patients based on the genes identified in panel (a). c Overlap of genes in clusters I - IV with signatures A and B identified by PCA. d Functional annotation of cluster I (blue), cluster II (green) and cluster III (red) genes by gene ontology (GO) enrichment analysis. p values are plotted against fold enrichment. Only specific non-redundant terms with p values <0.0001 and enrichment >3 are shown. e Expression of cluster I genes (n = 120; genewise normalized TPM values) in subgroup A (red) and B (blue) samples. f As panel (e), but for cluster II genes (n = 223). g As panel (e), but for cluster III genes (n = 148). Boxes show the upper and lower quartiles, whiskers the 95% confidence intervals (CI), and horizontal lines the median
Fig. 5
Fig. 5
Association of cluster-specific gene expression with ovarian cancer survival. a Mean z-scores (OS) for signature A and B genes; the ECM-related and IFN signaling-associated genes of signature A and B, respectively; cluster III and I genes; and genes representing the intersection of signature A with cluster III or of signature B with cluster I. Survival data were obtained from the PRECOG database with 1763 ovarian cancer patients [25]. b OS z-scores for signature B genes that are associated with IFN signaling. Significant associations with a favorable clinical outcome are shown in blue (z-score < −2.0; HR <1). The corresponding data for the complete signatures A and B are shown in Additional file 3: Figure S6. c-f Kaplan-Meier plots analyzing the association of IRF1, TAP1, CD14 and CD68 with RFS of high-grade serous ovarian cancer determined by KM plotter [26]. g Expression of the signature B genes HLA-DPB1, HLA-DRA and KYNU in TAMs (blue, n = 33), tumor cells (red, n = 15) and CD3+ TATs (green, n = 5) isolated from ovarian cancer ascites
Fig. 6
Fig. 6
Associations of IFN gene expression with survival and abrogation by IFNγ of the ascites-induced IL12B activation block. a z-scores for the association of IFN genes with OS (PRECOG data). Blue bars: significant associations with a favorable clinical outcome (z-score < −2.0; HR <1). b Expression of IFNG in TAMs (n = 33), tumor cell (n = 22) and TATs (n = 5) samples from ovarian carcinoma ascites, and in CD3+ T cells from healthy donors (n = 2). Each dot represents an individual sample (see Additional file 2: Dataset S1 for details). c IFNγ concentrations in the ascites from n = 61 ovarian cancer patients determined by ELISA. d IL12B expression in MDMs differentiated for 6 d either in RPMI plus 5% human A/B serum (R5 medium) or in ovarian cancer ascites in the absence or presence of IFNγ (50 ng/ml). Cultures were stimulated with LPS (100 ng/ml) plus IFNγ (20 ng/ml) or solvent only (Ctrl) for 24 h and RNA was analyzed by RT-qPCR. The experiment was performed with 7 independent samples (combinations of 5 donors and 5 ascites samples). e p40 (IL-12B/IL-23) protein concentrations in the culture medium of the experiments in panel (d). Each dot represents an independent sample. Horizontal lines: median. Significance was determined by t-test between unstimulated and IFNγ + LPS-stimulated cells

References

    1. Lengyel E. Ovarian cancer development and metastasis. Am J Pathol. 2010;177:1053–64. doi: 10.2353/ajpath.2010.100105. - DOI - PMC - PubMed
    1. Bowtell DD, Bohm S, Ahmed AA, Aspuria PJ, Bast RC, Jr, Beral V, Berek JS, Birrer MJ, Blagden S, Bookman MA, et al. Rethinking ovarian cancer II: reducing mortality from high-grade serous ovarian cancer. Nat Rev Cancer. 2015;15:668–79. doi: 10.1038/nrc4019. - DOI - PMC - PubMed
    1. Thibault B, Castells M, Delord JP, Couderc B. Ovarian cancer microenvironment: implications for cancer dissemination and chemoresistance acquisition. Cancer Metastasis Rev. 2014;33:17–39. doi: 10.1007/s10555-013-9456-2. - DOI - PubMed
    1. Mantovani A, Sozzani S, Locati M, Allavena P, Sica A. Macrophage polarization: tumor-associated macrophages as a paradigm for polarized M2 mononuclear phagocytes. Trends Immunol. 2002;23:549–55. doi: 10.1016/S1471-4906(02)02302-5. - DOI - PubMed
    1. Pollard JW. Tumour-educated macrophages promote tumour progression and metastasis. Nat Rev Cancer. 2004;4:71–8. doi: 10.1038/nrc1256. - DOI - PubMed

Publication types

MeSH terms