. 2017 Mar 21;15(1):21.
doi: 10.1186/s12951-017-0255-8.

Quantification of silver nanoparticle uptake and distribution within individual human macrophages by FIB/SEM slice and view

Affiliations

Quantification of silver nanoparticle uptake and distribution within individual human macrophages by FIB/SEM slice and view

Erik Guehrs et al. J Nanobiotechnology. .

Abstract

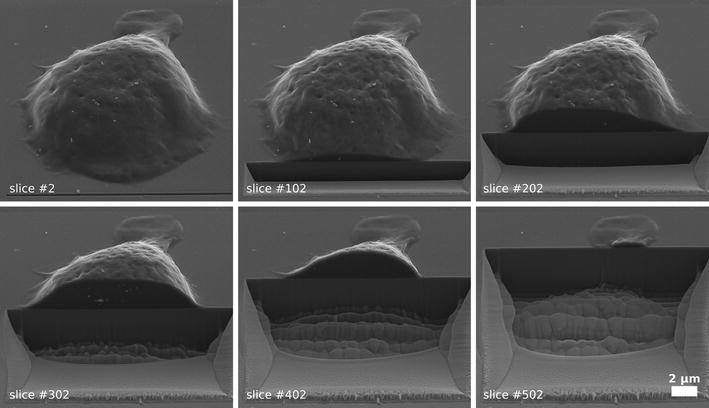
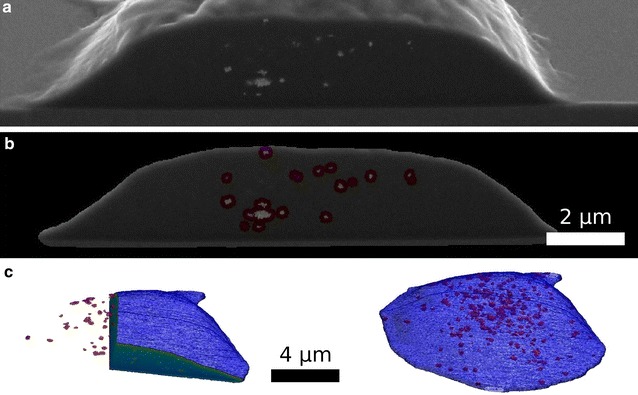
Background: Quantification of nanoparticle (NP) uptake in cells or tissues is very important for safety assessment. Often, electron microscopy based approaches are used for this purpose, which allow imaging at very high resolution. However, precise quantification of NP numbers in cells and tissues remains challenging. The aim of this study was to present a novel approach, that combines precise quantification of NPs in individual cells together with high resolution imaging of their intracellular distribution based on focused ion beam/ scanning electron microscopy (FIB/SEM) slice and view approaches.

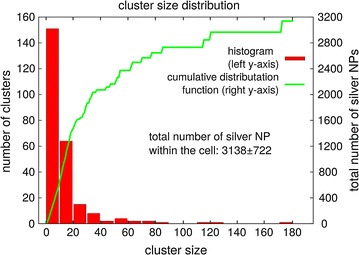
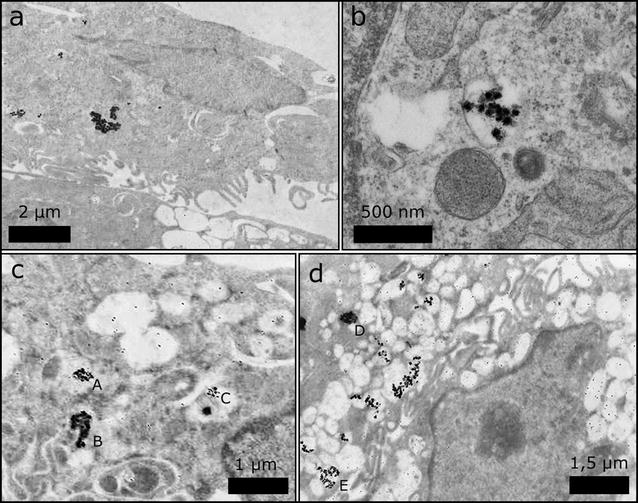
Results: We quantified cellular uptake of 75 nm diameter citrate stabilized silver NPs (Ag 75 Cit) into an individual human macrophage derived from monocytic THP-1 cells using a FIB/SEM slice and view approach. Cells were treated with 10 μg/ml for 24 h. We investigated a single cell and found in total 3138 ± 722 silver NPs inside this cell. Most of the silver NPs were located in large agglomerates, only a few were found in clusters of fewer than five NPs. Furthermore, we cross-checked our results by using inductively coupled plasma mass spectrometry and could confirm the FIB/SEM results.

Conclusions: Our approach based on FIB/SEM slice and view is currently the only one that allows the quantification of the absolute dose of silver NPs in individual cells and at the same time to assess their intracellular distribution at high resolution. We therefore propose to use FIB/SEM slice and view to systematically analyse the cellular uptake of various NPs as a function of size, concentration and incubation time.

Keywords: Absolute dose; Cellular internalization; FIB/SEM slice and view; Macrophage; Nanoparticles.


Figures

Fig. 1
Fig. 1
FIB/SEM slice and view. Gradual degradation of a single THP-1 macrophage using FIB/SEM slice and view. Here, six sample images of the slicing process are shown. In total, 625 images were taken to record the complete cell. A single slicing step removes 40 nm of the cell. The Ag 75 Cit NPs are visible as bright spots in the cell
Fig. 2
Fig. 2
Cell and silver NP segmentation. In a one single slice of the cell (slice 238) is shown before segmentation. In b the segmented shape of the cell as well as the detected Ag 75 Cit NPs (highlighted in red) are presented. Based on the segmentation, a 3D model (c) of the cell (blue) and the silver NPs (red) is calculated. In the left panel, two orthogonal cross-sections through the cell are shown
Fig. 3
Fig. 3
Analysis of a single silver NP. Nine slices in the immediate vicinity of a single silver NP at a distance of 40 nm to each other are shown above the x-axis. The maximum intensity of each image is taken to calculate the escape depth of electrons. The escape depth for the particle shown is ~79 nm. The average escape depth for all 16 single silver NPs investigated in this fashion is 89 ± 17 nm. The escape depth is used to determine total normalized intensity of a segmented single SNP in our sample to be (89 ± 17)
Fig. 4
Fig. 4
Simple model of the imaging process of silver NPs by SEM. Due to the escape depth of the electrons within the cell matrix, the detected silver NP volume appears elongated along the optical axis of the SEM. To correct for this effect, the escape depth of the electrons and the shape of the NP clusters needs to be taken into account
Fig. 5
Fig. 5
Cluster size distribution of uptaken silver NPs. Histogram and cumulative distribution function of all silver NPs within the cell. The absolute dose of silver NPs within the cell was 3138 ± 722. Although only a few clusters with a size larger than 20 NPs were present in the cell, most NPs were located in these larger clusters (~53%). Only 9% of all silver NPs were found in very small clusters (cluster size 1–5, corresponding histogram not shown). The binning width for the histogram is 10 silver NPs. The left y-axis corresponds to the histogram and the right y-axis to the cumulative distribution function
Fig. 6
Fig. 6
TEM images of slices through THP-1 cells with uptaken silver NPs. In the TEM images, the silver NPs appear as dark spots in ad. From all images it can be seen that most silver NPs are found in loosely- or densely-packed agglomerates. The larger magnification b reveals that silver NPs are located inside membrane-enclosed structures, which likely represent phagolysosomes. In c and d exemplary sizes of several agglomerates were determined. The agglomerate sizes are A = 336 nm; B = 344 nm; C = 224 nm; D = 425 nm; E = 525 nm

References

    1. Kessler R. Engineered nanoparticles in consumer products: understanding a new ingredient. Environ Health Perspect. 2011;119(3):120–125. doi: 10.1289/ehp.119-a120. - DOI - PMC - PubMed
    1. Li W-R, Xie X-B, Shi Q-S, Zeng H-Y, Ou-Yang Y-S, Chen Y-B. Antibacterial activity and mechanism of silver nanoparticles on Escherichia coli. Appl Microbiol Biotechnol. 2010;85(4):1115–1122. doi: 10.1007/s00253-009-2159-5. - DOI - PubMed
    1. Wilkinson LJ, White RJ, Chipman JK. Silver and nanoparticles of silver in wound dressings: a review of efficacy and safety. J Wound Care. 2011;20(11):543–549. doi: 10.12968/jowc.2011.20.11.543. - DOI - PubMed
    1. Larguinho M, Baptista PV. Gold and silver nanoparticles for clinical diagnostics—from genomics to proteomics. J Proteom. 2012;75(10):2811–2823. doi: 10.1016/j.jprot.2011.11.007. - DOI - PubMed
    1. Thurn KT, Arora H, Paunesku T, Wu A, Brown EMB, Doty C, Kremer J, Woloschak G. Endocytosis of titanium dioxide nanoparticles in prostate cancer PC-3M cells. Nanomed Nanotechnol Biol Med. 2011;7(2):123–130. doi: 10.1016/j.nano.2010.09.004. - DOI - PMC - PubMed

LinkOut - more resources