. 2017 Mar 21;12(1):27.
doi: 10.1186/s13024-017-0169-9.

Soluble oligomeric amyloid-β induces calcium dyshomeostasis that precedes synapse loss in the living mouse brain

Affiliations

Soluble oligomeric amyloid-β induces calcium dyshomeostasis that precedes synapse loss in the living mouse brain

Michal Arbel-Ornath et al. Mol Neurodegener. .

Abstract

Background: Amyloid-β oligomers (oAβ) are thought to mediate neurotoxicity in Alzheimer's disease (AD), and previous studies in AD transgenic mice suggest that calcium dysregulation may contribute to these pathological effects. Even though AD mouse models remain a valuable resource to investigate amyloid neurotoxicity, the concomitant presence of soluble Aβ species, fibrillar Aβ, and fragments of amyloid precursor protein (APP) complicate the interpretation of the phenotypes.

Method: To explore the specific contribution of soluble oligomeric Aβ (oAβ) to calcium dyshomeostasis and synaptic morphological changes, we acutely exposed the healthy mouse brain, at 3 to 6 months of age, to naturally occurring soluble oligomers and investigated their effect on calcium levels using in vivo multiphoton imaging.

Results: We observed a dramatic increase in the levels of neuronal resting calcium, which was dependent upon extracellular calcium influx and activation of NMDA receptors. Ryanodine receptors, previously implicated in AD models, did not appear to be primarily involved using this experimental setting. We used the high resolution cortical volumes acquired in-vivo to measure the effect on synaptic densities and observed that, while spine density remained stable within the first hour of oAβ exposure, a significant decrease in the number of dendritic spines was observed 24 h post treatment, despite restoration of intraneuronal calcium levels at this time point.

Conclusions: These observations demonstrate a specific effect of oAβ on NMDA-mediated calcium influx, which triggers synaptic collapse in vivo. Moreover, this work leverages a method to quantitatively measure calcium concentration at the level of neuronal processes, cell bodies and single synaptic elements repeatedly and thus can be applicable to testing putative drugs and/or other intervention methodologies.

Keywords: Alzheimer’s disease; Amyloid β oligomers; Calcium; In vivo imaging.


Figures
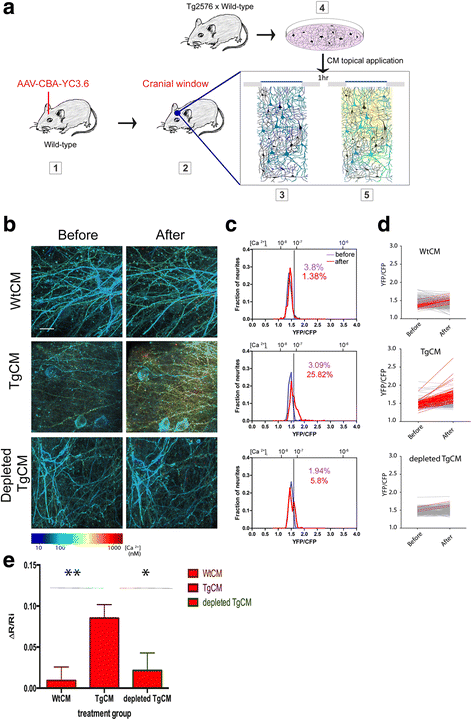
Fig. 1
Fig. 1
Oligomeric Aβ induces calcium overload in the healthy mouse brain. a A new experimental setting was designed to specifically address the effect of oAβ on calcium homeostasis in vivo. Wild-type C57BL/6 mice were injected with an AAV-CBA-YC3.6 and a cranial window was installed 4 weeks later. After a first imaging session at baseline, the window was opened and WtCM, TgCM or depleted TgCM was topically applied for 1 hour before reimaging again the exact same fields of view. b Neurites, consisting of dendrites and axons, filled with YC3.6 were imaged before and after treatment with TgCM, WtCM or depleted-TgCM. Images were pseudocolored according to calcium concentration (Scale bar = 20 μm). c Individual neurites were selected for measuring YFP and CFP ratio and calculating resting calcium levels. Distribution curves of [Ca2+] i (YFP/CFP ratio on the lower x-axis and [Ca2+] i on the upper x-axis) are presented before (purple curve) and after treatment (red curve) for each experimental group. Acute exposure to TgCM, but not to WtCM or immunodepleted-TgCM, resulted in a shift in the [Ca2+] i distribution towards higher ratio values, i.e. higher calcium concentrations. The black line indicates the threshold for calcium overload which represents 2 SD above the mean of ratios measured from all mice before treatment. The percentage of neurites with calcium overload before (purple) and after (red) treatment is noted on the graphs. Calcium overload was only significantly increased in the TgCM treated group from 3.09 to 25.82% (p < 0.0001 Fisher exact test). d YFP/CFP ratios before and after treatment with WtCM, TgCM or depleted TgCM represented for each neurite. The red traces account for the neurites that showed an increase of ≥10% in YFP/CFP ratio after topical application of CM. e The relative change in ratio was calculated for each neurite and the mean + SEM of each group is presented (linear mixed effects model fitted with treatment group as fixed effect and mouse as random effect ** p = 0.0012, *p = 0.0183)
Fig. 2
Fig. 2
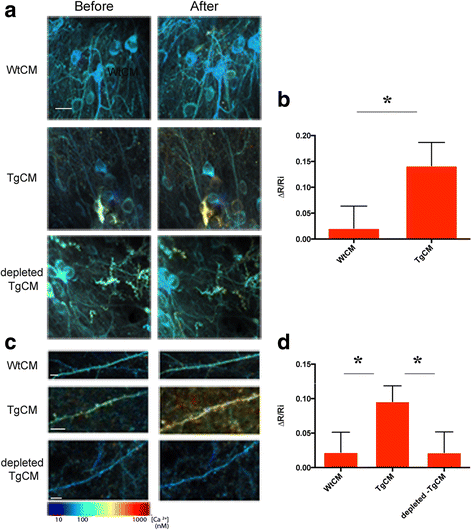
Oligomeric Aβ induces calcium overload in neuronal cell bodies and dendritic spines. Neuronal cell bodies (a,b) or dendritic spines (c,d) were imaged before and 1 h after treatment with conditioned media, and the YFP/CFP ratio and resting calcium were calculated for each compartment. Images were pseudocolored according to calcium concentrations. b In cell bodies, TgCM, but not WtCM, induced an increase in resting calcium. (TgCM: n = 165 cells, WtCM: n = 157 cells, in 5 mice, pair-wise comparison of the relative change in YC ratio, * p = 0.0458). d TgCM effect on YC ratio in dendritic spines followed the same trend as neurites and was significantly different from that of WtCM and depleted-TgCM (pair-wise analysis TgCM vs. WtCM * p = 0.0466; TgCM vs. depleted-TgCM * p = 0.0494; WtCM vs. depleted-TgCM p = 0.9916). Scale bars = 20 μm in (a) and 5 μm in (c)
Fig. 3
Fig. 3
Oligomeric Aβ decreases spine density at 24 h. a Representative images of YFP-filled neurites and dendritic spines before and after 1 h or 24 h treatment with WtCM, TgCM and TgCM + MK-801 (Scale bar = 10 μm). b Box plots showing the relative changes in percentage of spine densities after treatment accordingly to the mean spine density calculated for each animal before treatment. Whiskers represent the minimal and maximal values of each experimental group (n = 3–4 mice per group. For WtCM: n = 58 neurites and 578 spines evaluated after 1 h and n = 91 neurites and 1382 spines evaluated after 24 h. For TgCM: n = 68 neurites and 760 spines evaluated after 1 h and n = 69 neurites and 635 spines evaluated after 24 h. For TgCM + Mk-801: n = 152 neurites and 854 spines evaluated after 1 h and n = 174 neurites and 1044 spines evaluated after 24 h. Linear mixed effects model was fitted with treatment group and time of imaging (as outlined in the graph) as fixed effect and mouse as random effect. (pair-wise comparisons: TgCM 1 h vs. 24 h: *** p < 0.0001, Wtcm 1 h vs. 24 h p = 0.3897, TgCM + MK-801 1 h vs. 24 h p = 0.6667)
Fig. 4
Fig. 4
Extracellular calcium is the source of calcium overload in primary neurons expressing human APP. a Tg2576 neurons were incubated with the ratiometric calcium indicator indo-1 AM and then imaged before and after application of NiCl2 to block all voltage gate calcium channels. The ratios of bound vs. unbound indo-1 were calculated, converted to calcium concentration and pseudocolored using the jet color map. Distribution curves of [Ca2+] i (bound/unbound ratio on the lower x-axis and [Ca2+] i on the upper x-axis) are presented in the lower panel showing a wider distribution at baseline, which became more narrow and was shifted to the left after application of NiCl2. The black line indicates the threshold for calcium overload. The percentage of neurons with calcium overload, noted on the graphs before and after treatment, is significantly reduced by NiCl2 from 21.3 to 9.9% (n = 366 neurons before treatment and 321 after treatment in three separate experiments, Fisher exact test, p < 0.0001). b Neurons were transfected with YC3.6 and imaged before and after application of the NMDA receptor antagonist, MK-801. Ratios were converted to calcium levels and pseudocolored as in A. Upper panel shows resting calcium measured in the same neuron before and after inhibition of NMDA receptors. Distribution curves of [Ca2+] i (YFP/CFP on the lower x-axis and [Ca2+] i on the upper x-axis) are shown on the lower panel. Again, the wide distribution of calcium initially observed in transgenic neurons was shifted to the left after treatment with MK-801, dramatically reducing calcium overload from 15.7 to 0.5% (n = 189 neurons in 4 separate experiments, Fisher exact test p < 0.0001). c Summary bar graph for experiments with antagonists for different calcium channel measured with YC3.6 as described in B. The relative change in ratio (ΔR/Ri) after exposure with each inhibitor was calculated for individual cells and presented here as the group mean + SEM (each inhibitor was tested in three independent experiments: vehicles: ddw – n = 243, DMSO – n = 161; inhibitors: Nifedipine (L-type voltage channels) – n = 158, ω-conotoxin (N-type channels) – n = 141, 2-APB (IP3R) – 173, dantrolene (RyR) – 208). The effect of the treatment was tested by comparing each inhibitor to its appropriate vehicle using one way ANOVA with post hoc Dunn’s Multiple comparison test (* p < 0.05, ** p < 0.01, ***p < 0.0001). (Scale bar = 50 μm)
Fig. 5
Fig. 5
Oligomeric Aβ induces calcium overload through activation of NMDA receptors in vivo. The antagonists MK-801 and Dantrolene were applied 10-min before and during TgCM application. Distribution curves of [Ca2+] i (YFP/CFP ratio on the lower x-axis and [Ca2+] i on the upper x-axis) are presented before (purple curve) and after treatment (red curve) for mice treated with WtCM (a) TgCM (b) MK-801 + TgCM (c), dantrolene + TgCM (d) and MK-801 alone (e). The black line indicates the threshold for calcium overload. The percent of overloaded neurites is noted on each graph. Treatment with MK-801, but not of dantrolene, abolished the effect of TgCM on resting calcium (pair-wise comparisons of the relative change in YC ratio: TgCM vs. TgCM + MK-801 p = 0.0221; TgCM vs. TgCM + Dantrolene p = 0.7656; TgCM + MK-801 vs. TgCM + Dantrolene p = 0.0077)

Similar articles

Cited by

References

    1. Spires TL, Meyer-Luehmann M, Stern EA, McLean PJ, Skoch J, Nguyen PT, Bacskai BJ, Hyman BT. Dendritic spine abnormalities in amyloid precursor protein transgenic mice demonstrated by gene transfer and intravital multiphoton microscopy. J Neurosci. 2005;25:7278–7287. doi: 10.1523/JNEUROSCI.1879-05.2005. - DOI - PMC - PubMed
    1. Knowles RB, Wyart C, Buldyrev SV, Cruz L, Urbanc B, Hasselmo ME, Stanley HE, Hyman BT. Plaque-induced neurite abnormalities: implications for disruption of neural networks in Alzheimer’s disease. Proc Natl Acad Sci U S A. 1999;96:5274–5279. doi: 10.1073/pnas.96.9.5274. - DOI - PMC - PubMed
    1. Selkoe DJ. Soluble oligomers of the amyloid beta-protein impair synaptic plasticity and behavior. Behav Brain Res. 2008;192:106–113. doi: 10.1016/j.bbr.2008.02.016. - DOI - PMC - PubMed
    1. Shankar GM, Li S, Mehta TH, Garcia-Munoz A, Shepardson NE, Smith I, Brett FM, Farrell MA, Rowan MJ, Lemere CA, et al. Amyloid-beta protein dimers isolated directly from Alzheimer’s brains impair synaptic plasticity and memory. Nat Med. 2008;14:837–842. doi: 10.1038/nm1782. - DOI - PMC - PubMed
    1. Wu HY, Hudry E, Hashimoto T, Kuchibhotla K, Rozkalne A, Fan Z, Spires-Jones T, Xie H, Arbel-Ornath M, Grosskreutz CL, et al. Amyloid beta induces the morphological neurodegenerative triad of spine loss, dendritic simplification, and neuritic dystrophies through calcineurin activation. J Neurosci. 2010;30:2636–2649. doi: 10.1523/JNEUROSCI.4456-09.2010. - DOI - PMC - PubMed

Substances