. 2017 Mar 22:8:14611.
doi: 10.1038/ncomms14611.

Endogenous opioids regulate moment-to-moment neuronal communication and excitability

Affiliations

Endogenous opioids regulate moment-to-moment neuronal communication and excitability

Bryony L Winters et al. Nat Commun. .

Abstract

Fear and emotional learning are modulated by endogenous opioids but the cellular basis for this is unknown. The intercalated cells (ITCs) gate amygdala output and thus regulate the fear response. Here we find endogenous opioids are released by synaptic stimulation to act via two distinct mechanisms within the main ITC cluster. Endogenously released opioids inhibit glutamate release through the δ-opioid receptor (DOR), an effect potentiated by a DOR-positive allosteric modulator. Postsynaptically, the opioids activate a potassium conductance through the μ-opioid receptor (MOR), suggesting for the first time that endogenously released opioids directly regulate neuronal excitability. Ultrastructural localization of endogenous ligands support these functional findings. This study demonstrates a new role for endogenously released opioids as neuromodulators engaged by synaptic activity to regulate moment-to-moment neuronal communication and excitability. These distinct actions through MOR and DOR may underlie the opposing effect of these receptor systems on anxiety and fear.


Conflict of interest statement

The authors declare no competing financial interests.

Figures

Figure 1
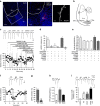
Figure 1. Met-enkephalin expressed within the main ITC island is positioned to modulate excitatory synapses.
(a) Schematic of amygdala subdivisions. ITC islands are shaded in grey. BLA, basolateral amygdala; CeL, lateral central amygdala and CeM, medial central amygdala make up the central amygdala (CeA); Im, Main ITC island; lpc, lateral ITC; mpc, medial ITC. (b) Single confocal images in the amygdala (Bregma −2.00 mm) of ME (green), MOR (magenta) and the two merged channels. Im is outlined by the dashed line. Scale bars, 100 μm. (ce) electron micrographs showing: (c) ME immunoreactivity is located in an axon terminal (ME-t) and concentrated in a dense core vesicle (dcv) that is directly apposed to an unlabeled terminal (ut) that forms an asymmetric synapse (curved arrow) with an unlabelled dendrite (UD). (d) An, unmyelinated axon (ME-a) contains a dense core vesicle that is immunoreactive for ME and is apposed to an unlabeled axon terminal (ut) that forms a perforated asymmetric synapse (curved arrows) with an unlabelled dendrite (UD). (e) ME immunogold immunoreactivity is located in an axon terminal (ME-t) apposed to an unlabelled dendrite (ud) that receives an asymmetric synapse (curved arrow) from an unlabelled terminal (ut). Scale bars, 100 nm.
Figure 2
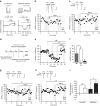
Figure 2. DOR and MOR activation inhibits glutamate release at the BLA-ITC synapse.
(a) Post hoc confocal images of DAPI (blue) and biocytin-labelled ITCs (red/white). Low power image shows intense DAPI labelling with high cell density within Im. Single image; scale bar, 100 μm. Magnification (× 20 objective) of boxed area, shows two filled ITCs with bipolar characteristics. Stack image (z=13.5 μm); scale bar, 50 μm. Further magnification (× 63, boxed area) reveals dendritic spines (arrows); single Z section (z=2.5 μm); scale bar, 3 μm. (b) Representative BLA-Im stimulation and recording locations. (ce) Selective DOR (deltorphin II, Delt 300 nM) and MOR (DAMGO, 1 μM)) agonists, reduced eEPSC amplitude and increased PPR that was reversed by the corresponding antagonists ICI1173864 (ICI, 1 μM) and CTAP (1 μM), respectively. KOR agonist (U69, 3 μM) and antagonist norBNI (10 nM), had no effect. (c) Example eEPSCs and time plot of normalized peak amplitude (eEPSC1) of a single representative experiment. (d) Bar chart showing percentage inhibition from baseline. Baseline defined as eEPSC amplitude of CTL (no drug) or previous antagonist. (e) Bar chart showing PPR, calculated as eEPSC2/eEPSC1. (fh) ME (10 μM) reduced eEPSC amplitude and increased PPR which fully reversed after wash. (f) Example eEPSCs and time plot of single representative experiment; (g) bar chart of mean inhibition during ME and wash. (h) Bar chart of mean PPR (bottom) and example traces (top) normalized to first eEPSC before (black) and during ME (grey). (i) ME inhibition was fully reversed by combined DOR and MOR antagonist treatment. Example eEPSCs and bar chart showing the proportion of ME inhibition of eEPSC amplitude (%) reversed by the selective antagonists. (Data are represented as mean±s.e.m.; *P<0.05, **P<0.01, paired t-test, from CTL; ##P<0.01, paired t-test versus ME.) Highlighted regions on time plots represent region sampled for bar charts. Scale bars, 50 ms, 100 pA.
Figure 3
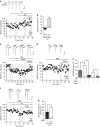
Figure 3. Endogenously released opioids inhibit glutamate release at the BLA-ITC synapse.
(a) Graphic showing stimulus paradigms and calculation of endogenous opioid effect. (b) Naloxone (Nalox, 10 μM) has no effect on eEPSC amplitude when evoked with a low stimulus, (c) while amplitude of the moderate stimulus ‘test eEPSC' is increased by naloxone. Data displaying eEPSCs and time plots of single representative experiments. (d) Met/leu-enkephalin is catabolized by specific peptidases; diagram showing cleavage sites, peptidases and their corresponding inhibitors (PIs). (e,f) Inhibition of eEPSC amplitude with submaximal ME (300–500 nM) is potentiated by peptidase inhibitors (PI; thiorphan 10 μM, captopril 1 μM, bestatin 10 μM). (e) Representative time plot and (f) bar chart showing percentage inhibition of eEPSC amplitude (from baseline). When peptidases are inhibited, naloxone now (g) increases synaptic responses evoked with the low stimulus and (h) produces a larger increase in amplitude of the moderate stimulus test eEPSC. Data displaying eEPSCs and time plots of single representative experiments. (i) The increase in synaptic response by naloxone increases with greater stimulus intensity and/or inclusion of PIs. Bar chart shows mean increase by naloxone (%) across each condition (Data are represented as mean±s.e.m.; *P<0.05, **P<0.01, paired t-tests, versus CTL; #P<0.05, ##P<0.01, unpaired t-tests as indicated). Highlighted regions on time plots represent region sampled for bar charts. Scale bars, 50 ms, 100 pA.
Figure 4
Figure 4. Endogenously released opioids act exclusively through DOR and their signalling is enhanced by a DOR PAM.
(a,b) Endogenous opioids signal exclusively through DOR. (a) Moderate stimulus ‘test eEPSCs' and corresponding time plot from single representative experiment. (b) Bar chart of percentage increase of eEPSC amplitude by selective antagonists. MOR antagonist CTAP (1 μM) produced no change while DOR antagonist, ICI174864 (ICI, 1 μM) significantly increased test eEPSC amplitude (**P<0.01, paired t-test, versus PI). (ce) The DOR PAM BMS-986187 (BMS, 1 μM) (c) significantly enhanced exogenous ME inhibition (submaximal, 100 nM) after at least 15 min continuous perfusion and (d) decreased single stimulus evoked eEPSC amplitude in absence of exogenous ligand, both were fully reversed by naloxone indicating PAM and not agonist activity of BMS-986187 (see also Supplementary Fig. 1). (c,d) Data displaying eEPSCs and time plots of single representative experiment and (e) summary bar chart (**P<0.01, repeated ANOVA; *P<0.05, paired t-test). (f,g) Preincubation (>45 min) and subsequent continual perfusion of BMS-986187 significantly enhanced endogenous opioid signalling under ‘low stimulus' conditions, in the presence of PIs. (f) eEPSCs and time plot of single representative experiment. (g) Summary bar chart showing BMS-986187 significantly enhanced the naloxone-induced increase of eEPSC amplitude (**P<0.01, unpaired t-test). Data are represented as mean±s.e.m. Highlighted regions on time plots represent region sampled for bar charts. Scale bars, 50 ms, 100 pA.
Figure 5
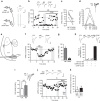
Figure 5. Endogenously released opioids activate a postsynaptic conductance in ITC neurons.
(a) ME-ir axon terminals converge onto a single postsynaptic target. Numerous ME terminals (MEt1–5) contact an unlabeled dendrite (ud). ME immunoperoxidase reactivity was observed in axon terminals across a spectrum of density and localization ranging from densely filling the entire terminal (ME-t1–3), to diffuse localization within a terminal (MEt4), to discrete compartmentalization in dense core vesicles (ME-t5). ME-ir terminals (ME-t) were also observed elsewhere in the field. Curved arrow indicates an asymmetric synapse. Scale bar, 500 nm. (b) ME rapidly activates an outward current in ITC neurons through MOR. Example current trace showing ME (30 μM) and rapid washout. Bar chart showing outward current amplitude is blocked by CTAP (1 μM, *P<0.05, paired t-test). (c) Example current traces and IV relationship of single representative neuron. Currents produced by voltage steps (10 mV increments) from −63.6 to 133.6 mV before (CTL; left) and during ME (30μM, right). Reversal potential for the ME-induced current is the point at which the control and ME I-V relationship curves intersect (−101.6 mV, this example). (df) Peptidase inhibition activates an endogenous opioid outward conductance that is increased by slice stimulation. (d) Example traces showing peptidase inhibitors (PI) induce a range of outward currents that are reversed by CTAP (n=4) or naloxone (n=5; top: small current; bottom: larger current). (e) Example trace showing effect of peptidase inhibitors on consecutive 1.5 s recordings following trains of stimuli (10–20, 150 Hz) delivered every 15 s, upward and downward deflections are the response to stimulation and are followed by holding current recording, gap represents 13.5 s between each stimuli. (f) Bar chart and scatter plot showing the amplitude of the outward current with/without stimulation; *P<0.05, Mann–Whitney U-test. Neurons voltage clamped at −64 mV. Data are represented as mean±s.e.m. Scale bars, (b,d) 1 min, 20 pA; (c) 50 ms, 100 pA; (e) 20 pA.
Figure 6
Figure 6. Endogenously released opioids modestly inhibit local GABA ITC synapses.
(a) Paired recordings of synaptically connected ITCs. Example pre-synaptic (lower trace) and postsynaptic (upper trace) currents following voltage pulses (200 mV) to the pre-synaptic cell. (bd) ME (10 μM) strongly inhibits synaptic transmission between paired ITCs and increases PPR, both are reversed by washout or CTAP. Data showing (b) IPSCs and time plot of single representative experiment and (c) scatter plot (*P<0.05, Friedman's with Fisher's post hoc tests). (d) Scatter plot of PPR and example IPSCs normalized to first peak (**P<0.01, Friedman's with Fisher's post hoc tests). (e) Stimulation/recording locations for local GABAergic-ITC synapses. (f,g) ME (10 μM) strongly inhibits local eIPSCs amplitude, (f) eIPSCs and time plot of single representative experiment, (g) summary bar chart (**P<0.01, paired t-test versus CTL). (h) ME inhibition is mediated exclusively by MOR. Example eIPSCs and bar chart showing percent recovery from ME inhibition by application of DOR (Naltrindole, 10 nM), KOR (norBNI) and MOR (CTAP) selective antagonists (*P<0.05, paired t-test, CTAP versus ME). (i) ME has no effect on PPR and quickens synaptic decay kinetics; example eIPSCs normalized to first peak showing no change in PPR but faster synaptic decay and summary bar chart of PPR (NS, not significant, paired t-test). (j,k) In the presence of peptidase inhibitors (PI), naloxone only increased moderate stimulus evoked test eIPSCs. (j) Test eIPSCs and time plot of single representative experiment. (k) Bar chart showing modest increase in test eIPSC by naloxone but no change in low stimulus eIPSCs. (*P<0.05, paired t-test versus PI). Data are represented as mean±s.e.m. Highlighted regions on time plot represents region sampled for bar charts. Scale bars, (a) 50 ms, 5 nA; (a,b) 50 ms, 200 pA; (df) 50 ms, 500 pA.
Figure 7
Figure 7. Working model of endogenous opioid actions in Im.
(a) Working model of endogenously released opioid signalling within Im. (1) Low–moderate stimuli at BLA-Im synapses promote release of endogenous enkephalins from dense core vesicles (DCV) contained within Im neurons. Sufficient peptide release through moderate stimulation is required to overcome peptidases and allow enkephalin signalling through DOR. Enkephalin reduces BLA-Im synaptic activity by decreasing pre-synaptic glutamate release. (2) Moderate stimuli, together with peptidase inhibition, are required to overcome potential microarchitectural constraints to allow enkephalin-induced MOR activation that reduces presynaptic GABA release at local Im–Im synapses. (3) Activation of postsynaptic MORs by endogenously released opioids activates a potassium conductance. The resulting efflux of K+ ions hyperpolarizes ITCs reducing their excitability. Subsequent synaptic activity is also shunted (for example, blue arrows) due to decreased input resistance. Both outcomes are expected to reduce total Im activity and limit feed forward inhibition from Im to CeM neurons, thus affecting amygdala output. (b) Schematic representation of information flow through the amygdala. Putative thalamic/cortical glutamatergic (blue) afferents carry sensory information to the lateral amygdala (LA), activating BLA pyramidal neurons. These subsequently activate medial central amygdala (CeM) output neurons to promote fear behaviour. BLA excitatory afferents also project to Im, which then sends inhibitory GABAergic (red) efferents to the CeM. Other inputs (for example, from mPFC), traverse the intermediate capsule to activate Im neurons and contribute to feed-forward inhibition of CeM, preventing a fear response. Thinner lines depict putative inputs from the cortex, lateral/medial ITCs and the lateral central amygdala (CeL), all of which directly or indirectly affect amygdala output.

Similar articles

Cited by

References

    1. Phelps E. A. & LeDoux J. E. Contributions of the amygdala to emotion processing: from animal models to human behavior. Neuron 48, 175–187 (2005). - PubMed
    1. Pape H. C. & Pare D. Plastic synaptic networks of the amygdala for the acquisition, expression, and extinction of conditioned fear. Physiol. Rev. 90, 419–463 (2010). - PMC - PubMed
    1. Konig M. et al.. Pain responses, anxiety and aggression in mice deficient in pre-proenkephalin. Nature 383, 535–538 (1996). - PubMed
    1. Ragnauth A. et al.. Female preproenkephalin-knockout mice display altered emotional responses. Proc. Natl Acad. Sci. USA 98, 1958–1963 (2001). - PMC - PubMed
    1. Nieto M. M., Guen S. L., Kieffer B. L., Roques B. P. & Noble F. Physiological control of emotion-related behaviors by endogenous enkephalins involves essentially the delta opioid receptors. Neuroscience 135, 305–313 (2005). - PubMed

Publication types