. 2017 Mar 22:8:14843.
doi: 10.1038/ncomms14843.

Quantitative volumetric Raman imaging of three dimensional cell cultures

Affiliations

Quantitative volumetric Raman imaging of three dimensional cell cultures

Charalambos Kallepitis et al. Nat Commun. .

Abstract

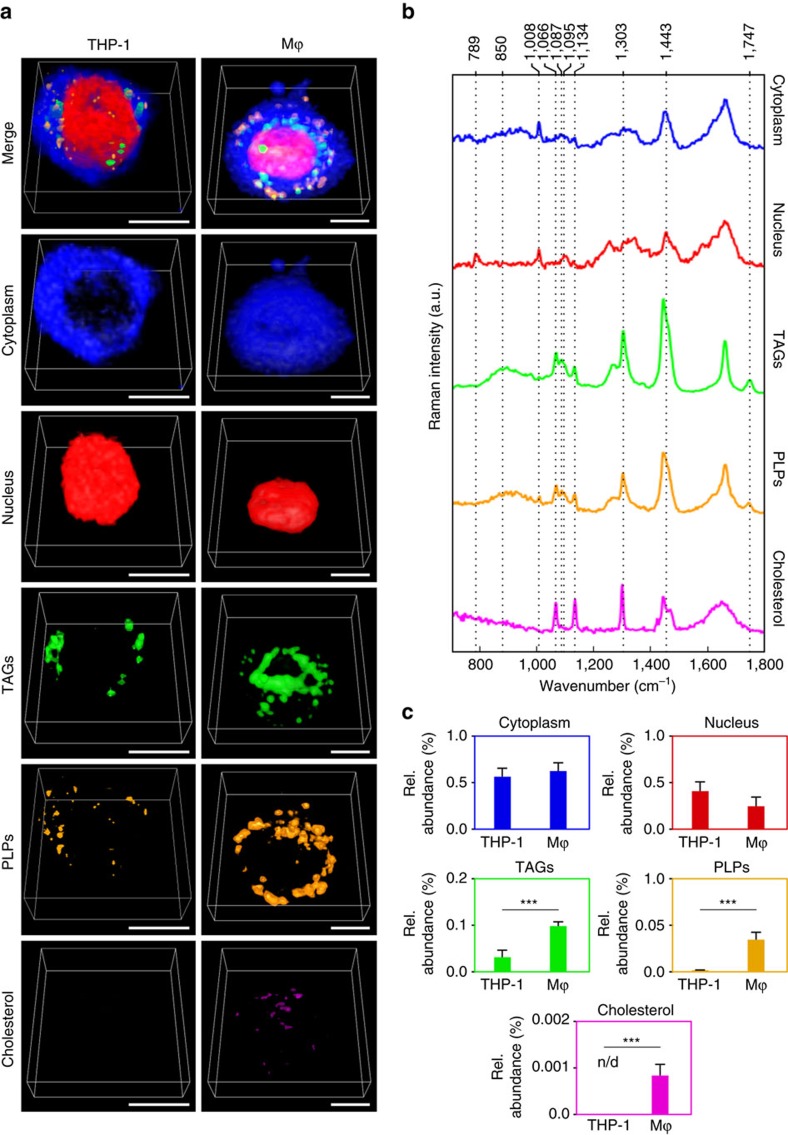
The ability to simultaneously image multiple biomolecules in biologically relevant three-dimensional (3D) cell culture environments would contribute greatly to the understanding of complex cellular mechanisms and cell-material interactions. Here, we present a computational framework for label-free quantitative volumetric Raman imaging (qVRI). We apply qVRI to a selection of biological systems: human pluripotent stem cells with their cardiac derivatives, monocytes and monocyte-derived macrophages in conventional cell culture systems and mesenchymal stem cells inside biomimetic hydrogels that supplied a 3D cell culture environment. We demonstrate visualization and quantification of fine details in cell shape, cytoplasm, nucleus, lipid bodies and cytoskeletal structures in 3D with unprecedented biomolecular specificity for vibrational microspectroscopy.


Conflict of interest statement

The authors declare no competing financial interests.

Figures

Figure 1
Figure 1. Schematic illustration of qVRI imaging process, from data collection and spectral unmixing to 3D reconstruction and quantification.
The confocal microscope provides control over x × y × z dimensions of the sample position for 3D imaging. Each imaging plane is described by a hyperspectral dataset. Hyperspectral datasets are 3D datasets with x × y (number of pixels in a single imaging plane) spatial dimensions and w (wavenumbers) spectral dimension. Each voxel in 3D is associated with a single Raman spectrum. Combining hyperspectral datasets from multiple imaging planes creates a volumetric hyperspectral dataset with z × x spatial dimensions and z being equal to the sum of yn imaging planes. For spectral unmixing analysis the volumetric hyperspectral dataset is unfolded to form a matrix D=M × w with M=z × x. D is unmixed using N number of ‘pure' components (e.g., here N=4) into two matrices C and ST. C contains the relative abundance values of the pure components in each voxel in an M × N matrix with every column associated to one component. ST is an N × w matrix containing a ‘pure' component spectrum in every row. Each column of C contains all the spatial information needed to reconstruct every components' 3D architecture by refolding it to the original x × y × z dimensions. Each voxel contains the concentration profile of the reconstructed component. The number of voxels within an isosurface at a chosen threshold can be used as a metric for quantification, comparing experimental conditions (e.g., comparing Cell A to Cell B).
Figure 2
Figure 2. 3D visualization of representative pluripotent stem cells and CMs.
(a) 3D volumes of intensity distributions of hiPSCs (n=4 colonies), hiPSC-derived CMs (n=4 monolayers) and adult rat ventricular CMs (n=2 cells) for selected bands: 1,008 cm−1 for cell cytoplasm (blue), 789 cm−1 for cell nucleus (red), 2,857 cm−1 for lipids (green), 485 cm−1 for glycogen (white) and a merge of all components. (b) Representative Raman spectra of each subcellular component (cytoplasm (blue), nucleus (red), lipids (green), glycogen (black)), indicating the band used to reconstruct the 3D intensity volumes. Scale bar, 10 μm.
Figure 3
Figure 3. Lipid analysis in monocyte to macrophage differentiation.
(a) qVRI identifies the main subcellular components of THP-1 cells (n=4 cells) and THP-1 differentiated macrophages (Mϕ) (n=4 cells) representative cells shown, and their corresponding (b) endmember Raman spectra from VCA (showing five components); from top to bottom cytoplasm (blue), nucleus (red), triacylglycerols (green), phospholipids (orange), cholesterol (magenta). (c) Bar chart of mean abundance values for each subcellular component showing significant differences between the two cells for TAG (two sample t-test, P<0.001), PLP (two sample t-test, P<0.001) and cholesterol (two sample t-test, P<0.001), ***P<0.001 (n/d, non-detectable). Error bars represent one standard deviation around the mean. Scale bar, 10 μm.
Figure 4
Figure 4. Volumetric quantification of cellular biochemical components in a 3D culture system.
Representative 3D reconstructions by qVRI, of the main subcellular components of hMSCs (n=2 cells per hydrogel) in (a) a bioactive (PEG-MMP+RGD) and a bioinert (PEG) hydrogel, and their corresponding (b) endmember Raman spectra from VCA (showing five components); from top to bottom cytoplasm (blue), nucleus (red), triacylglycerols (green), phospholipids (orange) and hydrogel (cyan). (c) Bar chart of mean abundance values for each subcellular component. Error bars represent one standard deviation around the mean. Scale bar, 10 μm.

References

    1. Ravi M., Paramesh V., Kaviya S. R., Anuradha E. & Paul Solomon F. D. 3D cell culture systems: advantages and applications. J. Cell. Physiol. 230, 16–26 (2015). - PubMed
    1. Huh D., Hamilton G. A. & Ingber D. E. From 3D cell culture to organs-on-chips. Trends Cell Biol. 21, 745–754 (2011). - PMC - PubMed
    1. Justice B. A., Badr N. A. & Felder R. A. 3D cell culture opens new dimensions in cell-based assays. Drug Discov. Today 14, 102–107 (2009). - PubMed
    1. Fischer R. S., Wu Y., Kanchanawong P., Shroff H. & Waterman C. M. Microscopy in 3D: a biologist's toolbox. Trends Cell Biol. 21, 682–691 (2011). - PMC - PubMed
    1. Streets A. M., Li A., Chen T. & Huang Y. Imaging without fluorescence: nonlinear optical microscopy for quantitative cellular imaging. Anal. Chem. 86, 8506–8513 (2014). - PubMed

Publication types