

Validation of surface-to-volume ratio measurements derived from oscillating gradient spin echo on a clinical scanner using anisotropic fiber phantoms
- PMID: 28328013
- PMCID: PMC5501714
- DOI: 10.1002/nbm.3708
Validation of surface-to-volume ratio measurements derived from oscillating gradient spin echo on a clinical scanner using anisotropic fiber phantoms
Abstract
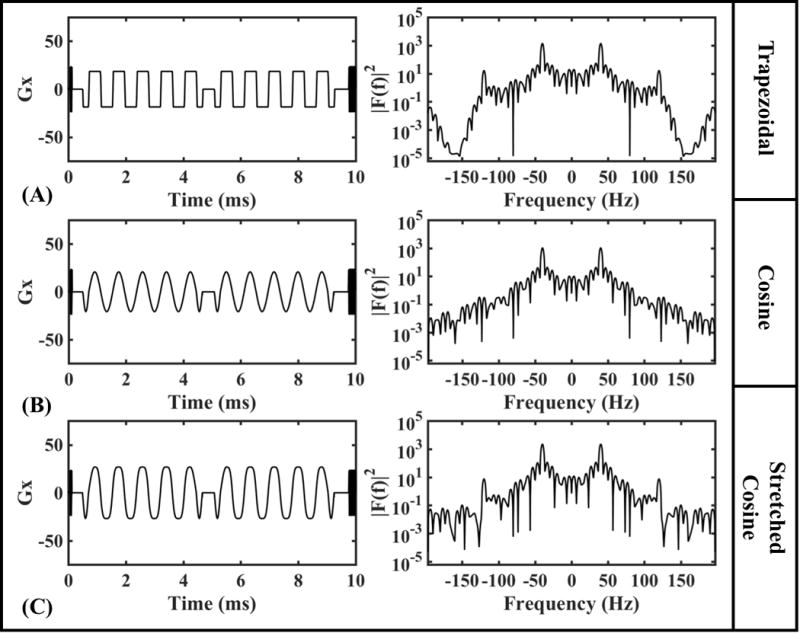
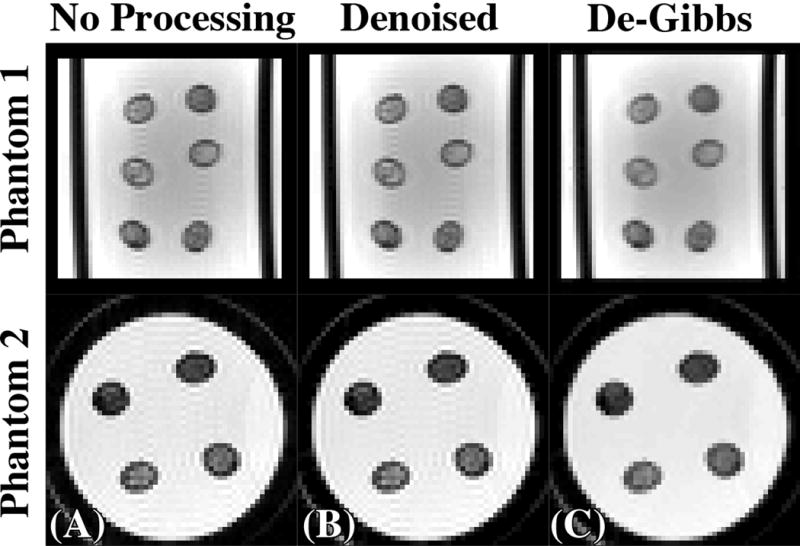
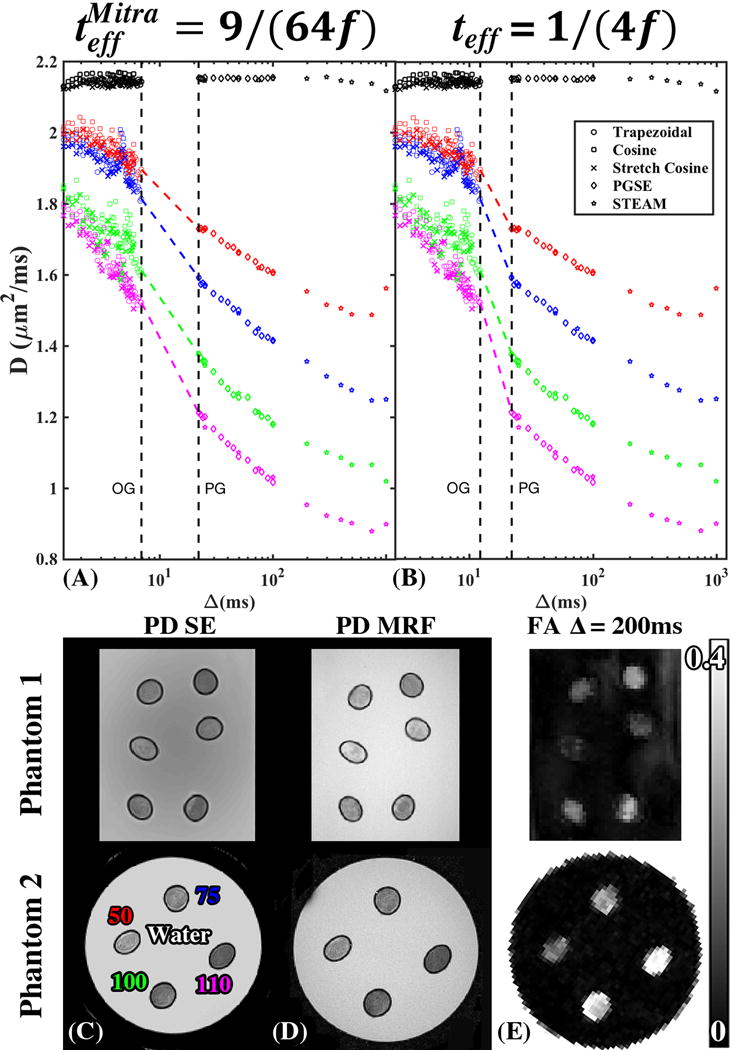
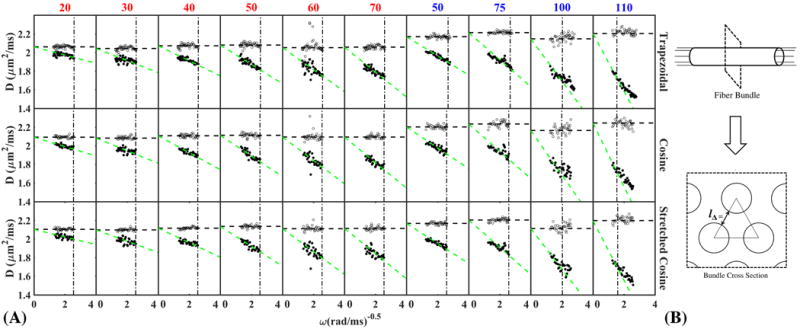
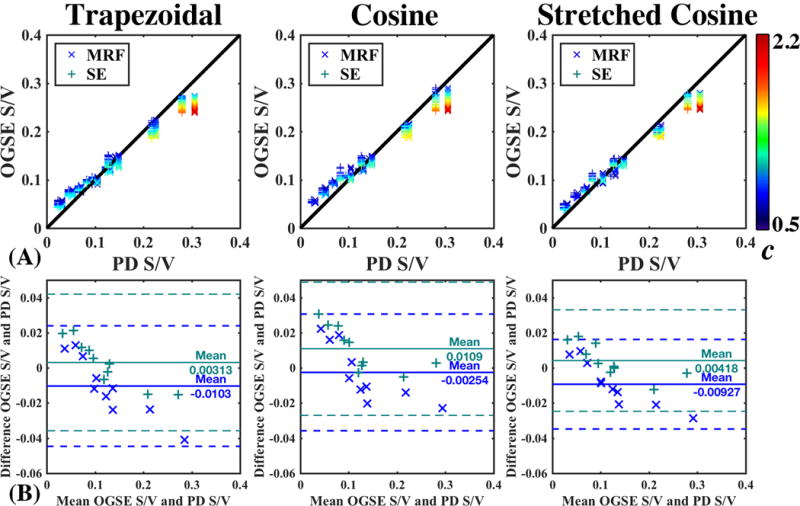
A diffusion measurement in the short-time surface-to-volume ratio (S/V) limit (Mitra et al., Phys Rev Lett. 1992;68:3555) can disentangle the free diffusion coefficient from geometric restrictions to diffusion. Biophysical parameters, such as the S/V of tissue membranes, can be used to estimate microscopic length scales non-invasively. However, due to gradient strength limitations on clinical MRI scanners, pulsed gradient spin echo (PGSE) measurements are impractical for probing the S/V limit. To achieve this limit on clinical systems, an oscillating gradient spin echo (OGSE) sequence was developed. Two phantoms containing 10 fiber bundles, each consisting of impermeable aligned fibers with different packing densities, were constructed to achieve a range of S/V values. The frequency-dependent diffusion coefficient, D(ω), was measured in each fiber bundle using OGSE with different gradient waveforms (cosine, stretched cosine, and trapezoidal), while D(t) was measured from PGSE and stimulated-echo measurements. The S/V values derived from the universal high-frequency behavior of D(ω) were compared against those derived from quantitative proton density measurements using single spin echo (SE) with varying echo times, and from magnetic resonance fingerprinting (MRF). S/V estimates derived from different OGSE waveforms were similar and demonstrated excellent correlation with both SE- and MRF-derived S/V measures (ρ ≥ 0.99). Furthermore, there was a smoother transition between OGSE frequency f and PGSE diffusion time when using teffS/V=9/64f, rather than the commonly used teff = 1/(4f), validating the specific frequency/diffusion time conversion for this regime. Our well-characterized fiber phantom can be used for the calibration of OGSE and diffusion modeling techniques, as the S/V ratio can be measured independently using other MR modalities. Moreover, our calibration experiment offers an exciting perspective of mapping tissue S/V on clinical systems.
Keywords: OGSE diffusion; STEAM diffusion; anisotropic diffusion phantom; magnetic resonance fingerprinting; surface to volume ratio.
Copyright © 2017 John Wiley & Sons, Ltd.
Figures
References
-
- Bihan DL, Breton E, Lallemand D, Aubin ML, Vignaud J, Laval-Jeantet M. Separation of diffusion and perfusion in intravoxel incoherent motion MR imaging. Radiology. 1988;168(2):497–505. - PubMed
-
- Hagmann P, Jonasson L, Maeder P, Thiran J-P, Wedeen VJ, Meuli R. Understanding Diffusion MR Imaging Techniques: From Scalar Diffusion-weighted Imaging to Diffusion Tensor Imaging and Beyond. Radiographics: a review publication of the Radiological Society of North America, Inc. 2006;26(suppl_1):S205–S223. - PubMed
-
- Srinivasan A, Goyal M, Azri FA, Lum C. State-of-the-Art Imaging of Acute Stroke. Radiographics: a review publication of the Radiological Society of North America, Inc. 2006;26(suppl_1):S75–S95. - PubMed
-
- Padhani AR, Liu G, Mu-Koh D, Chenevert TL, Thoeny HC, Takahara T, Dzik-Jurasz A, Ross BD, Van Cauteren M, Collins D, Hammoud DA, Rustin GJS, Taouli B, Choyke PL. Diffusion-Weighted Magnetic Resonance Imaging as a Cancer Biomarker: Consensus and Recommendations. Neoplasia. 2009;11(2):102–125. - PMC - PubMed
MeSH terms
Substances
Grants and funding
LinkOut - more resources
Full Text Sources
Other Literature Sources
Miscellaneous
