Perfusion CT in acute stroke: effectiveness of automatically-generated colour maps
- PMID: 28328241
- PMCID: PMC5605056
- DOI: 10.1259/bjr.20150472
Perfusion CT in acute stroke: effectiveness of automatically-generated colour maps
Abstract
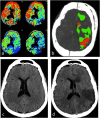
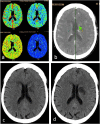
Objective: To evaluate the accuracy of perfusion CT (pCT) in the definition of the infarcted core and the penumbra, comparing the data obtained from the evaluation of parametric maps [cerebral blood volume (CBV), cerebral blood flow (CBF) and mean transit time (MTT)] with software-generated colour maps.
Methods: A retrospective analysis was performed to identify patients with suspected acute ischaemic strokes and who had undergone unenhanced CT and pCT carried out within 4.5 h from the onset of the symptoms. A qualitative evaluation of the CBV, CBF and MTT maps was performed, followed by an analysis of the colour maps automatically generated by the software.
Results: 26 patients were identified, but a direct CT follow-up was performed only on 19 patients after 24-48 h. In the qualitative analysis, 14 patients showed perfusion abnormalities. Specifically, 29 perfusion deficit areas were detected, of which 15 areas suggested the penumbra and the remaining 14 areas suggested the infarct. As for automatically software-generated maps, 12 patients showed perfusion abnormalities. 25 perfusion deficit areas were identified, 15 areas of which suggested the penumbra and the other 10 areas the infarct. The McNemar's test showed no statistically significant difference between the two methods of evaluation in highlighting infarcted areas proved later at CT follow-up.
Conclusion: We demonstrated how pCT provides good diagnostic accuracy in the identification of acute ischaemic lesions. The limits of identification of the lesions mainly lie at the pons level and in the basal ganglia area. Qualitative analysis has proven to be more efficient in identification of perfusion lesions in comparison with software-generated maps. However, software-generated maps have proven to be very useful in the emergency setting. Advances in knowledge: The use of CT perfusion is requested in increasingly more patients in order to optimize the treatment, thanks also to the technological evolution of CT, which now allows a whole-brain study. The need for performing CT perfusion study also in the emergency setting could represent a problem for physicians who are not used to interpreting the parametric maps (CBV, MTT etc.). The software-generated maps could be of value in these settings, helping the less expert physician in the differentiation between different areas.
Figures


References
-
- Zhu G, Michel P, Aghaebrahim A, Patrie JT, Xin W, Eskandari A, et al. . Computed tomography workup of patients suspected of acute ischemic stroke: perfusion computed tomography adds value compared with clinical evaluation, noncontrast computed tomography, and computed tomography angiogram in terms of predicting outcome. Stroke 2013; 44: 1049–55. doi: https://doi.org/10.1161/STROKEAHA.111.674705 - DOI - PubMed
-
- Ho CY, Hussain S, Alam T, Ahmad I, Wu IC, O'Neill DP. Accuracy of CT cerebral perfusion in predicting infarct in the emergency department: lesion characterization on CT perfusion based on commercially available software. Emerg Radiol 2013; 20: 203–12. doi: https://doi.org/10.1007/s10140-012-1102-8 - DOI - PMC - PubMed
-
- Michel P, Bogousslavsky J. Penumbra is brain: no excuse not to perfuse. Ann Neurol 2005; 58: 661–3. doi: https://doi.org/10.1002/ana.20713 - DOI - PubMed
-
- Soares BP, Dankbaar JW, Bredno J, Cheng S, Bhogal S, Dillon WP, et al. . Automated versus manual post-processing of perfusion-CT data in patients with acute cerebral ischemia: influence on interobserver variability. Neuroradiology 2009; 51: 445–51. doi: https://doi.org/10.1007/s00234-009-0516-9 - DOI - PMC - PubMed
MeSH terms
LinkOut - more resources
Full Text Sources
Other Literature Sources
Medical
Research Materials

