

Comparing internal migration across the countries of Latin America: A multidimensional approach
- PMID: 28328932
- PMCID: PMC5362059
- DOI: 10.1371/journal.pone.0173895
Comparing internal migration across the countries of Latin America: A multidimensional approach
Abstract
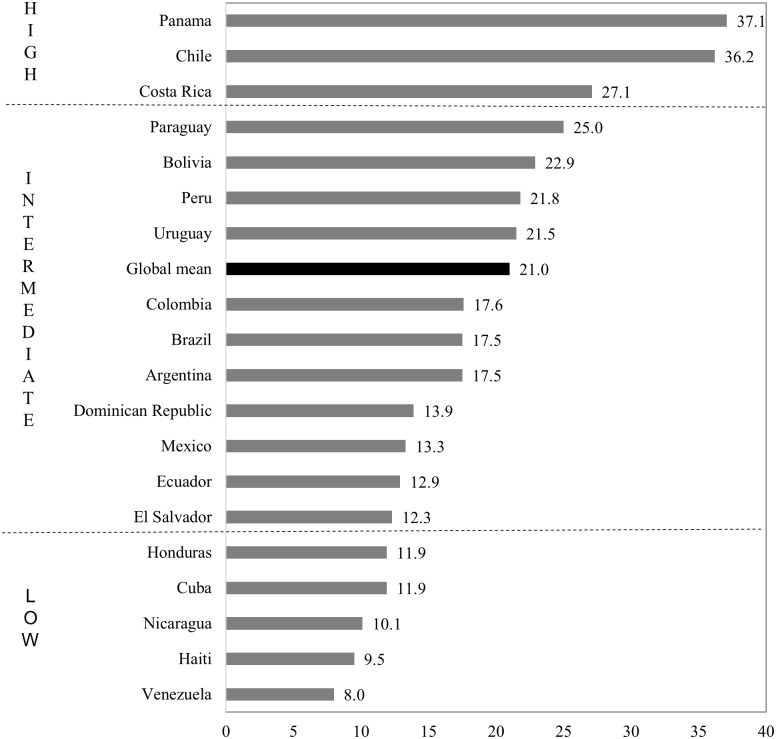
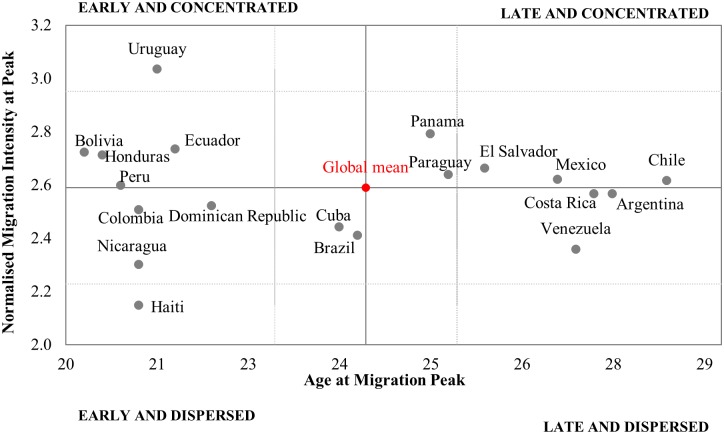
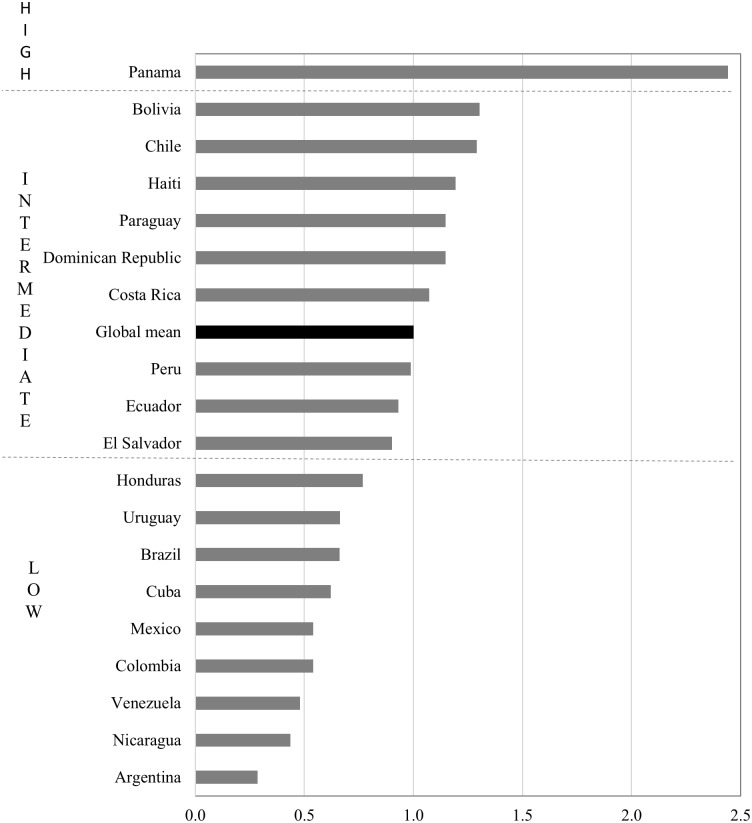
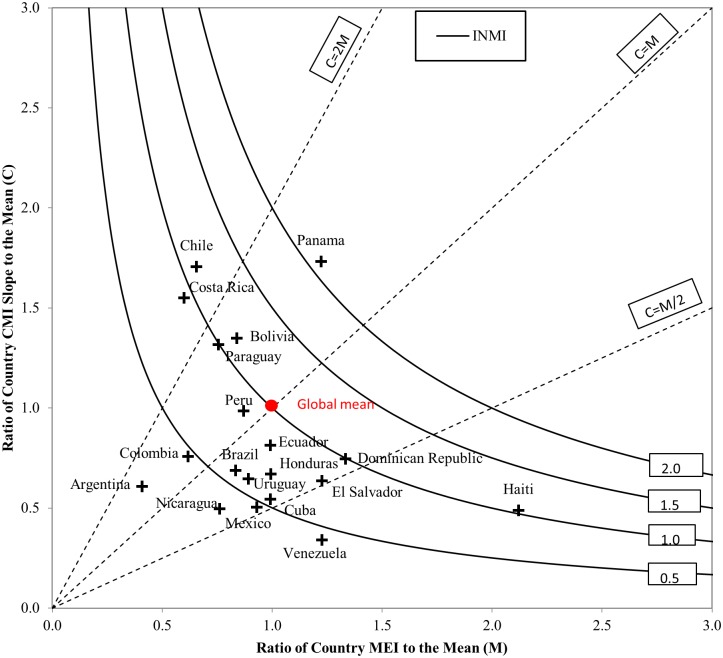
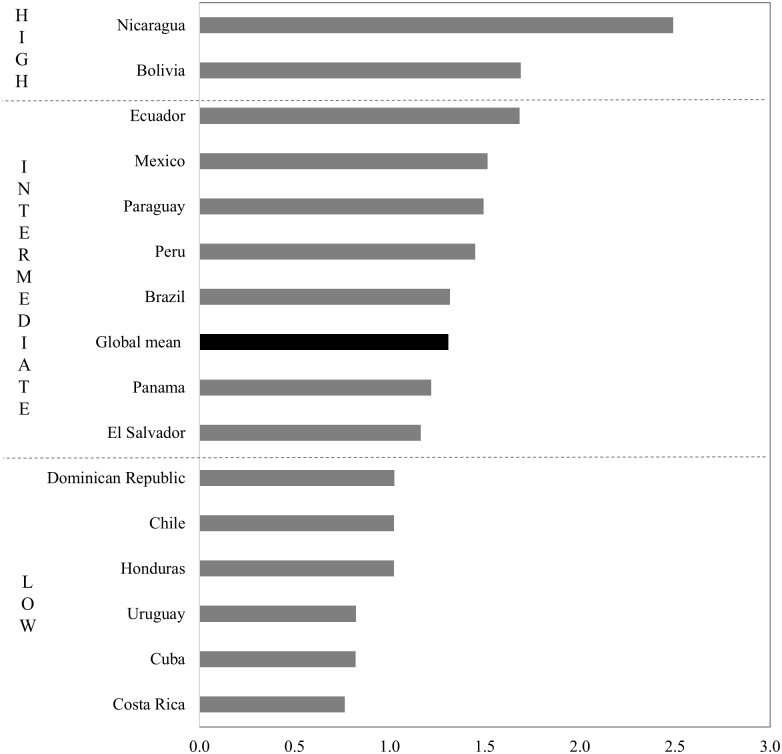
While considerable progress has been made in understanding the way particular aspects of internal migration, such as its intensity, age profile and spatial impact, vary between countries around the world, little attention to date has been given to establishing how these dimensions of migration interact in different national settings. We use recently developed measures of internal migration that are scale-independent to compare the overall intensity, age composition, spatial impact, and distance profile of internal migration in 19 Latin American countries. Comparisons reveal substantial cross-national variation but cluster analysis suggests the different dimensions of migration evolve systematically to form a broad sequence characterised by low intensities, young ages at migration, unbalanced flows and high friction of distance at lower levels of development, trending to high intensities, an older age profile of migration, more closely balanced flows and lower friction of distance at later stages of development. However, the transition is not linear and local contingencies, such as international migration and political control, often distort the migration-development nexus, leading to unique migration patterns in individual national contexts.
Conflict of interest statement
Figures
References
-
- Bell M, Blake M, Boyle P, Duke-Williams O, Rees P, Stillwell J, et al. Cross-national comparison of internal migration: issues and measures. Journal of the Royal Statistical Society: Series A (Statistics in Society). 2002;165(3):435–64.
-
- Bell M, Charles-Edwards E, Kupiszewska D, Kupiszewski M, Stillwell J, Zhu Y. Internal migration and development: comparing migration intensities around the world. Population and Development Review. 2015;41(1):33–58.
-
- Bernard A, Bell M, Charles-Edwards E. Improved measures for the cross-national comparison of age profiles of internal migration. Population Studies. 2014;68(2):179–95. doi: 10.1080/00324728.2014.890243 - DOI - PubMed
-
- Rees P, Bell M, Kupiszewski M, Kupiszewska D, Ueffing P, Bernard A, et al. The Impact of Internal Migration on Population Redistribution: an International Comparison Population, Space and Place. 2016;
-
- Stillwell J, Bell M, Ueffing P, Daras K, Charles-Edwards E, Kupiszewski M, et al. Internal migration around the world: comparing distance travelled and its frictional effect. Environment and Planning A. 2016:0308518X16643963.
Publication types
MeSH terms
LinkOut - more resources
Full Text Sources
Other Literature Sources
