

Dynamics of Cough Frequency in Adults Undergoing Treatment for Pulmonary Tuberculosis
- PMID: 28329268
- PMCID: PMC5399950
- DOI: 10.1093/cid/cix039
Dynamics of Cough Frequency in Adults Undergoing Treatment for Pulmonary Tuberculosis
Abstract
Background: Cough is the major determinant of tuberculosis transmission. Despite this, there is a paucity of information regarding characteristics of cough frequency throughout the day and in response to tuberculosis therapy. Here we evaluate the circadian cycle of cough, cough frequency risk factors, and the impact of appropriate treatment on cough and bacillary load.
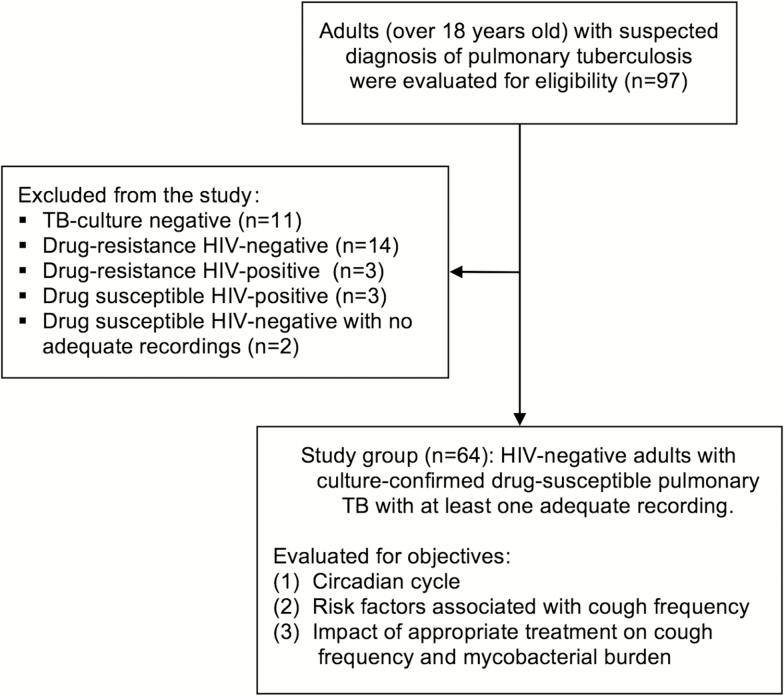
Methods: We prospectively evaluated human immunodeficiency virus-negative adults (n = 64) with a new diagnosis of culture-proven, drug-susceptible pulmonary tuberculosis immediately prior to treatment and repeatedly until treatment day 62. At each time point, participant cough was recorded (n = 670) and analyzed using the Cayetano Cough Monitor. Consecutive coughs at least 2 seconds apart were counted as separate cough episodes. Sputum samples (n = 426) were tested with microscopic-observation drug susceptibility broth culture, and in culture-positive samples (n = 252), the time to culture positivity was used to estimate bacillary load.
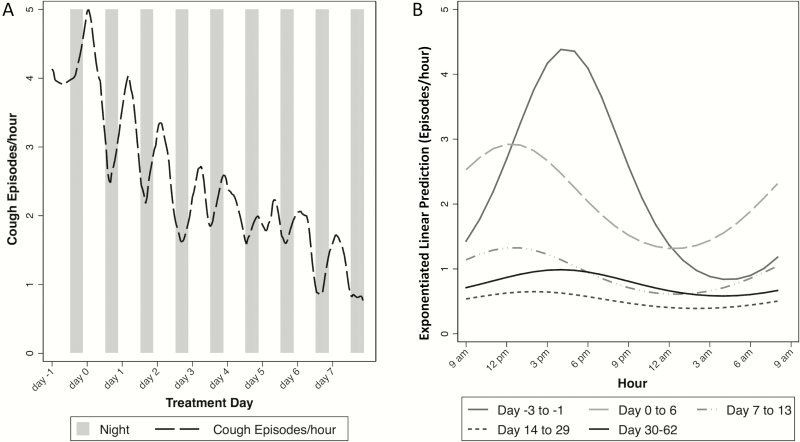
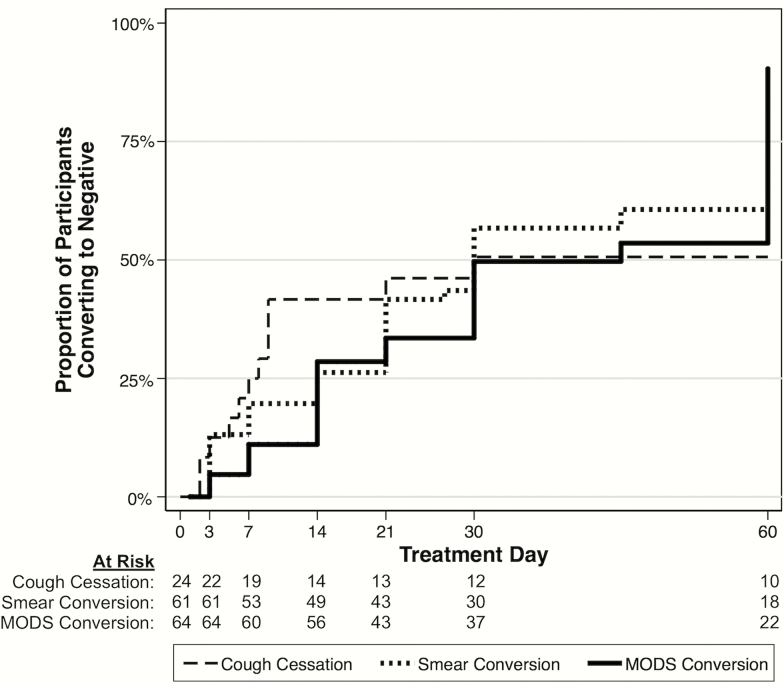
Results: The highest cough frequency occurred from 1 pm to 2 pm, and the lowest from 1 am to 2 am (2.4 vs 1.1 cough episodes/hour, respectively). Cough frequency was higher among participants who had higher sputum bacillary load (P < .01). Pretreatment median cough episodes/hour was 2.3 (interquartile range [IQR], 1.2-4.1), which at 14 treatment days decreased to 0.48 (IQR, 0.0-1.4) and at the end of the study decreased to 0.18 (IQR, 0.0-0.59) (both reductions P < .001). By 14 treatment days, the probability of culture conversion was 29% (95% confidence interval, 19%-41%).
Conclusions: Coughs were most frequent during daytime. Two weeks of appropriate treatment significantly reduced cough frequency and resulted in one-third of participants achieving culture conversion. Thus, treatment by 2 weeks considerably diminishes, but does not eliminate, the potential for airborne tuberculosis transmission.
Keywords: airborne transmission; cough; infectiousness; tuberculosis; Peru.
© The Author 2017. Published by Oxford University Press for the Infectious Diseases Society of America.
Figures
References
-
- World Health Organization. Global tuberculosis report 2016. Geneva, Switzerland: WHO, 2016.
-
- Loudon RG, Roberts RM. Singing and the dissemination of tuberculosis. Am Rev Respir Dis 1968; 98:297–300. - PubMed
-
- Turner RD, Bothamley GH. Cough and the transmission of tuberculosis. J Infect Dis 2015; 211:1367–72. - PubMed
-
- Loudon RG, Spohn SK. Cough frequency and infectivity in patients with pulmonary tuberculosis. Am Rev Respir Dis 1969; 99:109–11. - PubMed
MeSH terms
Substances
Grants and funding
LinkOut - more resources
Full Text Sources
Other Literature Sources
Medical
