

Posttreatment Reactions After Single-Dose Diethylcarbamazine or Ivermectin in Subjects With Loa loa Infection
- PMID: 28329346
- PMCID: PMC5850646
- DOI: 10.1093/cid/cix016
Posttreatment Reactions After Single-Dose Diethylcarbamazine or Ivermectin in Subjects With Loa loa Infection
Abstract
Background: Severe adverse reactions have been observed in individuals with Loa loa infection treated with either diethylcarbamazine (DEC), the drug of choice for loiasis, or ivermectin (IVM), which is used in mass drug administration programs for control of onchocerciasis and lymphatic filariasis in Africa. In this study, posttreatment clinical and immunologic reactions were compared following single-dose therapy with DEC or IVM to assess whether these reactions have the same underlying pathophysiology.
Methods: Twelve patients with loiasis and microfilarial counts <2000 mf/mL were randomized to receive single-dose DEC (8 mg/kg) or IVM (200 µg/kg). Clinical and laboratory assessments were performed at 4, 8, 24, 48, and 72 hours and 5, 7, 9, and 14 days posttreatment.
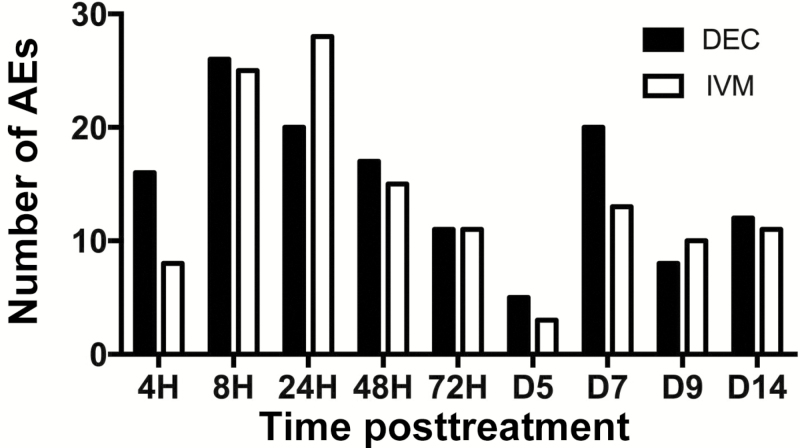
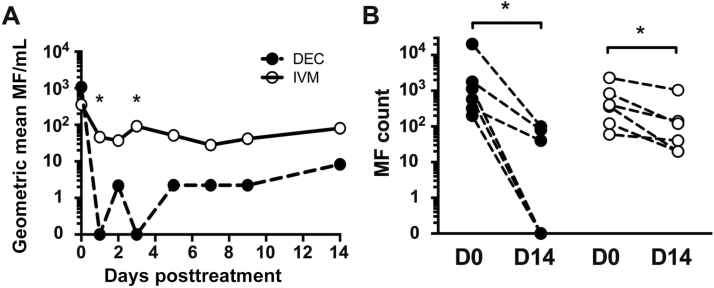
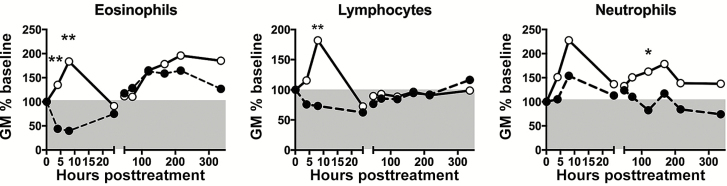
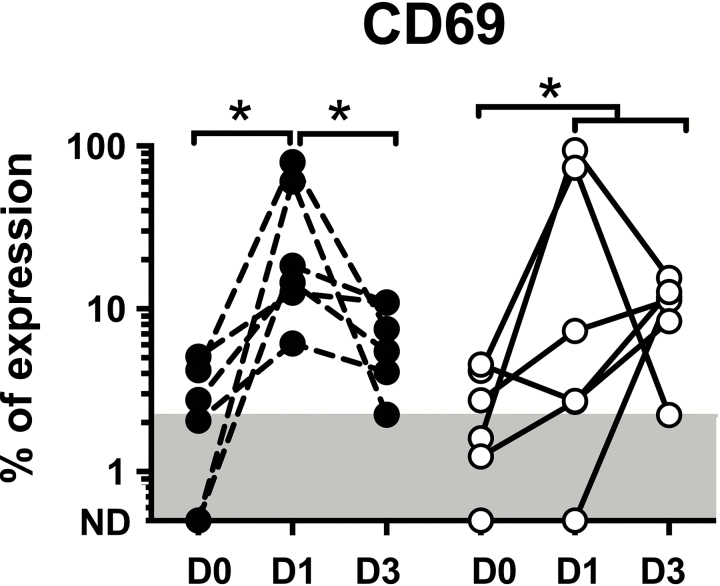
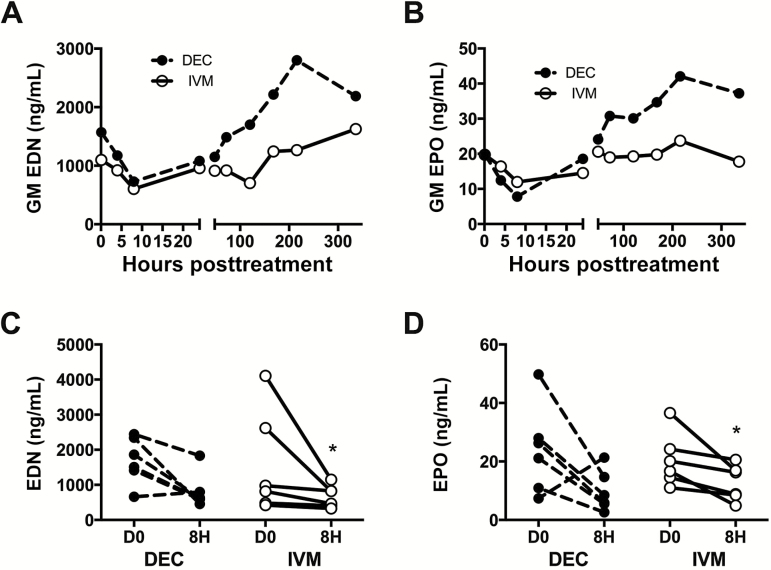
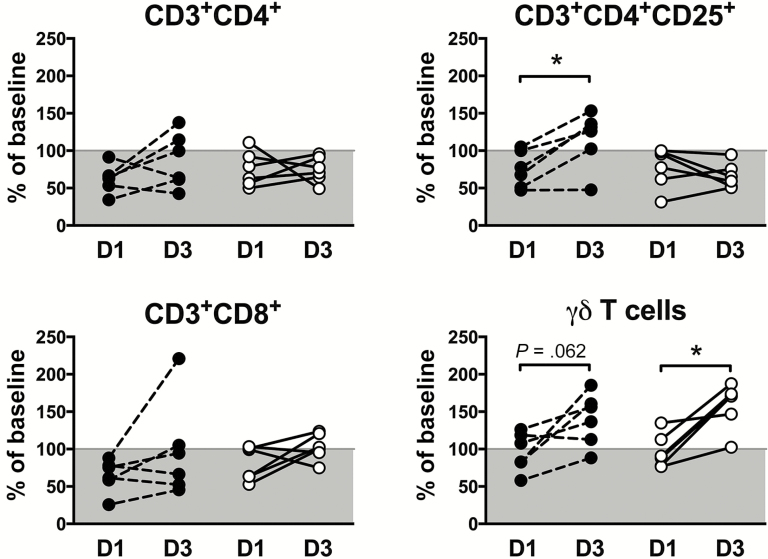
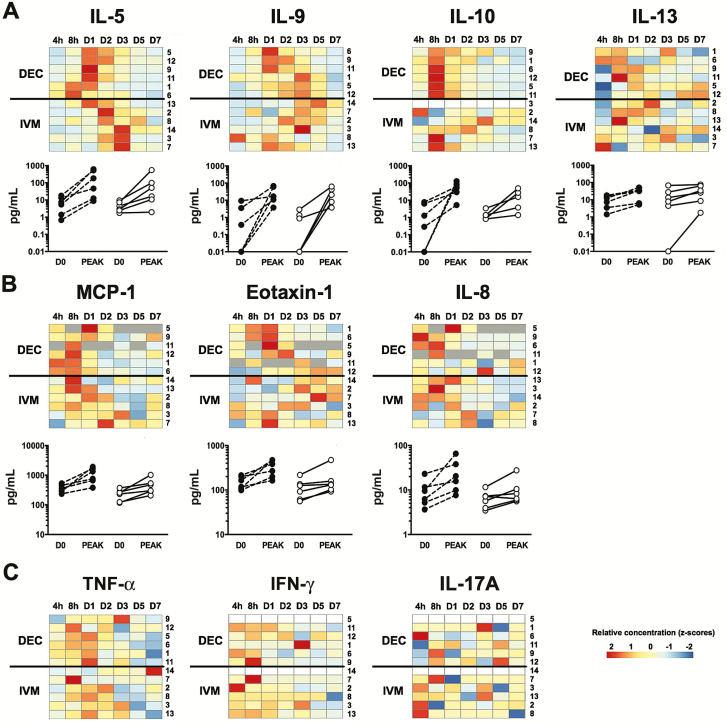
Results: Posttreatment adverse events were similar following DEC or IVM, but peaked earlier in subjects who received DEC, consistent with a trend toward more rapid and complete microfilarial clearance in the DEC group. After a transient rise (post-IVM) or fall (post-DEC) in the first 24 hours posttreatment, the eosinophil count rose significantly in both groups, peaking at day 5 in the DEC group and day 9 in the IVM group. Serum interleukin 5 levels and eosinophil activation, as assessed by surface expression of CD69 and serum levels of eosinophil granule proteins, were increased posttreatment in both groups.
Conclusions: Despite differences in eosinophil and lymphocyte counts during the first 24 hours posttreatment, the overall pattern of hematologic and immunologic changes suggest that posttreatment reactions following DEC and IVM share a common pathophysiology.
Clinical trials registration: NCT01593722.
Keywords: Loa loa; diethylcarbamazine; eosinophil; filariasis; ivermectin.
Published by Oxford University Press for the Infectious Diseases Society of America 2017. This work is written by (a) US Government employee(s) and is in the public domain in the US.
Figures
Similar articles
-
Efficacy, Safety, and Pharmacokinetics of Coadministered Diethylcarbamazine, Albendazole, and Ivermectin for Treatment of Bancroftian Filariasis.Clin Infect Dis. 2016 Feb 1;62(3):334-341. doi: 10.1093/cid/civ882. Epub 2015 Oct 20. Clin Infect Dis. 2016. PMID: 26486704 Clinical Trial.
-
[Secondary effects of the treatment of hypermicrofilaremic loiasis using ivermectin].Bull Soc Pathol Exot. 1995;88(3):105-12. Bull Soc Pathol Exot. 1995. PMID: 8555762 French.
-
Pharmacokinetics, safety, and efficacy of a single co-administered dose of diethylcarbamazine, albendazole and ivermectin in adults with and without Wuchereria bancrofti infection in Côte d'Ivoire.PLoS Negl Trop Dis. 2019 May 20;13(5):e0007325. doi: 10.1371/journal.pntd.0007325. eCollection 2019 May. PLoS Negl Trop Dis. 2019. PMID: 31107869 Free PMC article. Clinical Trial.
-
Adverse events following single dose treatment of lymphatic filariasis: Observations from a review of the literature.PLoS Negl Trop Dis. 2018 May 16;12(5):e0006454. doi: 10.1371/journal.pntd.0006454. eCollection 2018 May. PLoS Negl Trop Dis. 2018. PMID: 29768412 Free PMC article. Review.
-
[Loa loa filariasis in Italy: review of the literature with a clinical report].Infez Med. 2011 Sep;19(3):147-51. Infez Med. 2011. PMID: 22037434 Review. Italian.
Cited by
-
Eosinophils, basophils and myeloid-derived suppressor cells in chronic Loa loa infection and its treatment in an endemic setting.PLoS Negl Trop Dis. 2024 May 21;18(5):e0012203. doi: 10.1371/journal.pntd.0012203. eCollection 2024 May. PLoS Negl Trop Dis. 2024. PMID: 38771861 Free PMC article.
-
Eosinophils in filarial infections: Inducers of protection or pathology?Front Immunol. 2022 Oct 31;13:983812. doi: 10.3389/fimmu.2022.983812. eCollection 2022. Front Immunol. 2022. PMID: 36389745 Free PMC article. Review.
-
Mouse models of Loa loa.Nat Commun. 2019 Mar 29;10(1):1429. doi: 10.1038/s41467-019-09442-0. Nat Commun. 2019. PMID: 30926803 Free PMC article.
-
Major basic protein and eosinophil peroxidase support microfilariae motility inhibition by eosinophil ETosis.PLoS Negl Trop Dis. 2025 Mar 3;19(3):e0012889. doi: 10.1371/journal.pntd.0012889. eCollection 2025 Mar. PLoS Negl Trop Dis. 2025. PMID: 40029883 Free PMC article.
-
Reduction of Loa loa Microfilaremia with Imatinib - A Case Report.N Engl J Med. 2017 Nov 23;377(21):2095-2096. doi: 10.1056/NEJMc1712990. N Engl J Med. 2017. PMID: 29166233 Free PMC article. No abstract available.
References
-
- Klion AD, Massougbodji A, Sadeler BC, Ottesen EA, Nutman TB. Loiasis in endemic and nonendemic populations: immunologically mediated differences in clinical presentation. J Infect Dis 1991; 163:1318–25. - PubMed
-
- Carme B, Boulesteix J, Boutes H, Puruehnce MF. Five cases of encephalitis during treatment of loiasis with diethylcarbamazine. Am J Trop Med Hyg 1991; 44:684–90. - PubMed
-
- Gardon J, Gardon-Wendel N, Demanga-Ngangue, Kamgno J, Chippaux JP, Boussinesq M. Serious reactions after mass treatment of onchocerciasis with ivermectin in an area endemic for Loa loa infection. Lancet 1997; 350:18–22. - PubMed
Publication types
MeSH terms
Substances
Associated data
LinkOut - more resources
Full Text Sources
Other Literature Sources
Medical
Research Materials
