. 2017 Mar 21;18(12):2893-2906.
doi: 10.1016/j.celrep.2017.02.074.

The SWI/SNF Protein PBRM1 Restrains VHL-Loss-Driven Clear Cell Renal Cell Carcinoma

Affiliations

The SWI/SNF Protein PBRM1 Restrains VHL-Loss-Driven Clear Cell Renal Cell Carcinoma

Amrita M Nargund et al. Cell Rep. .

Abstract

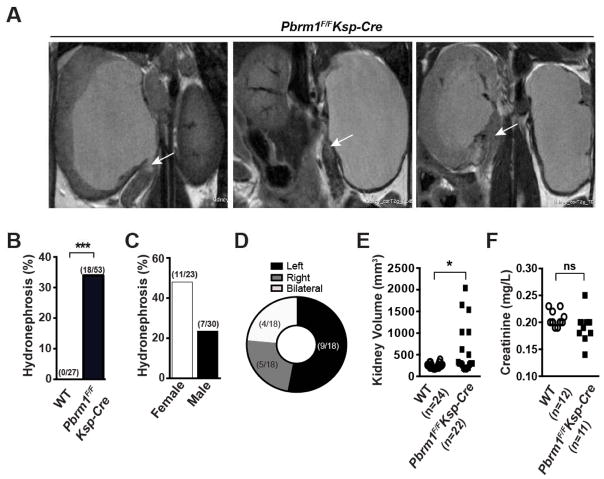
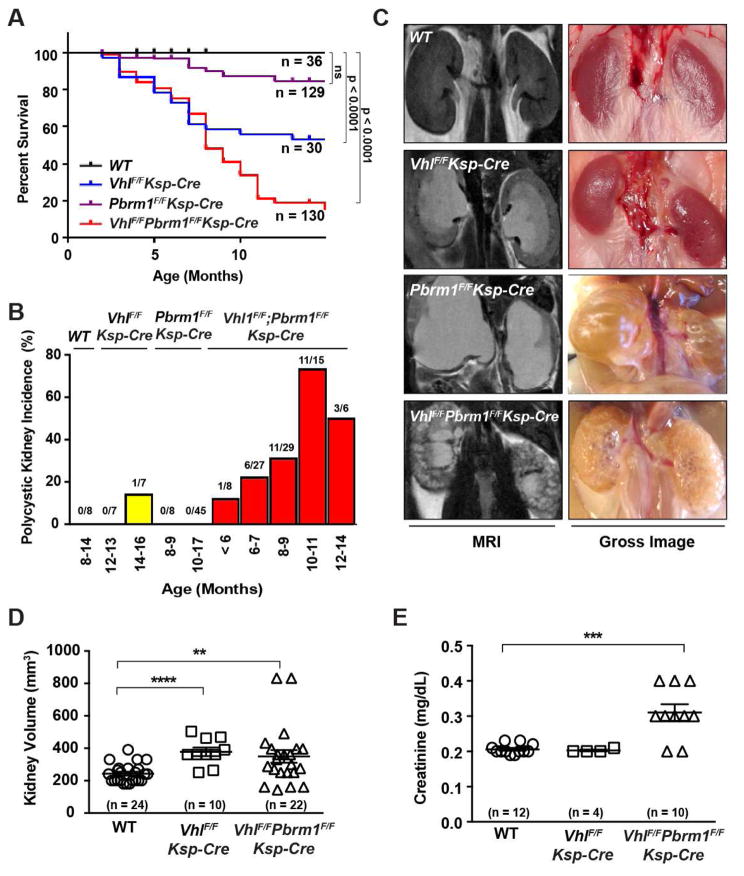
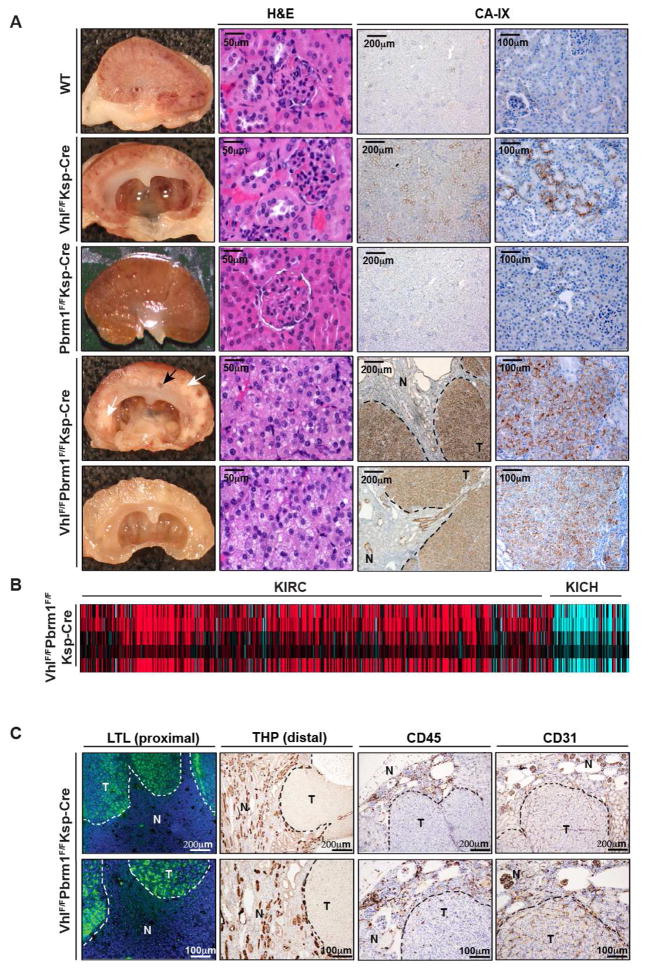
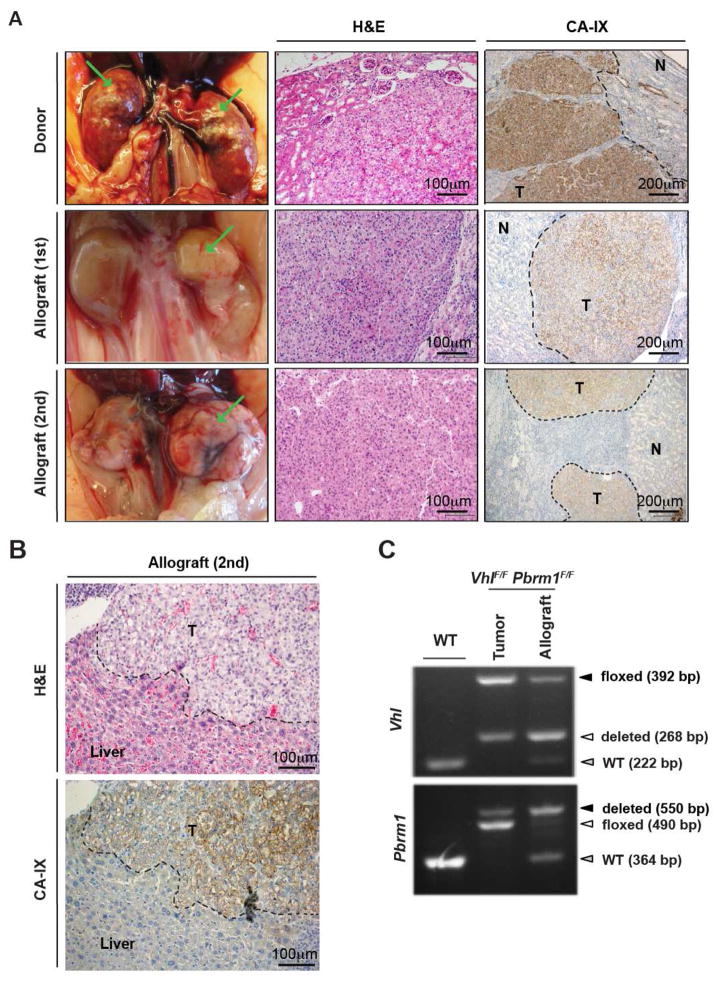
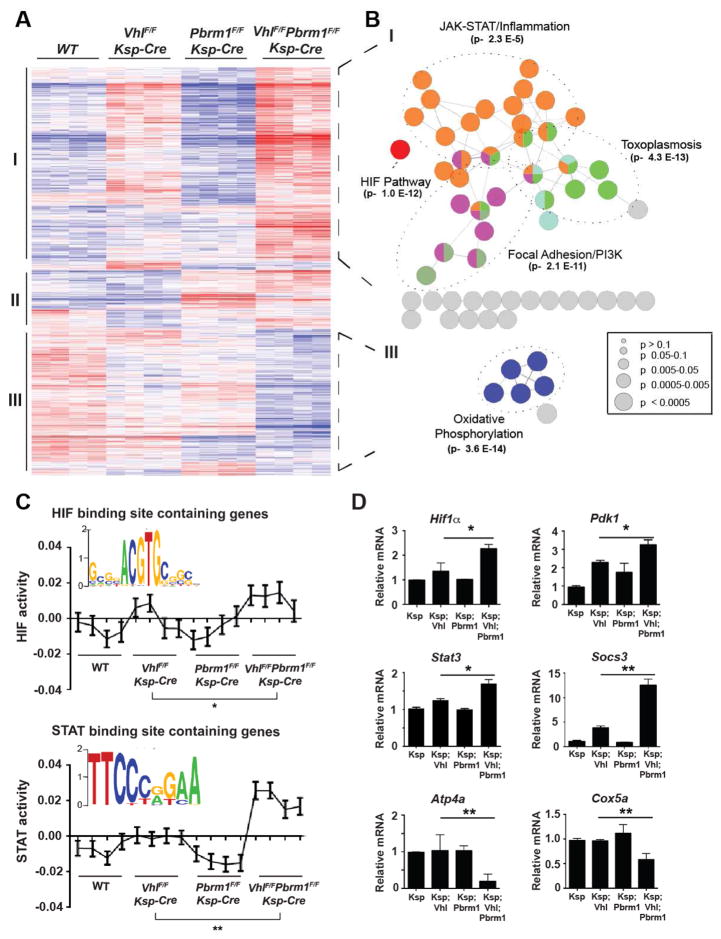
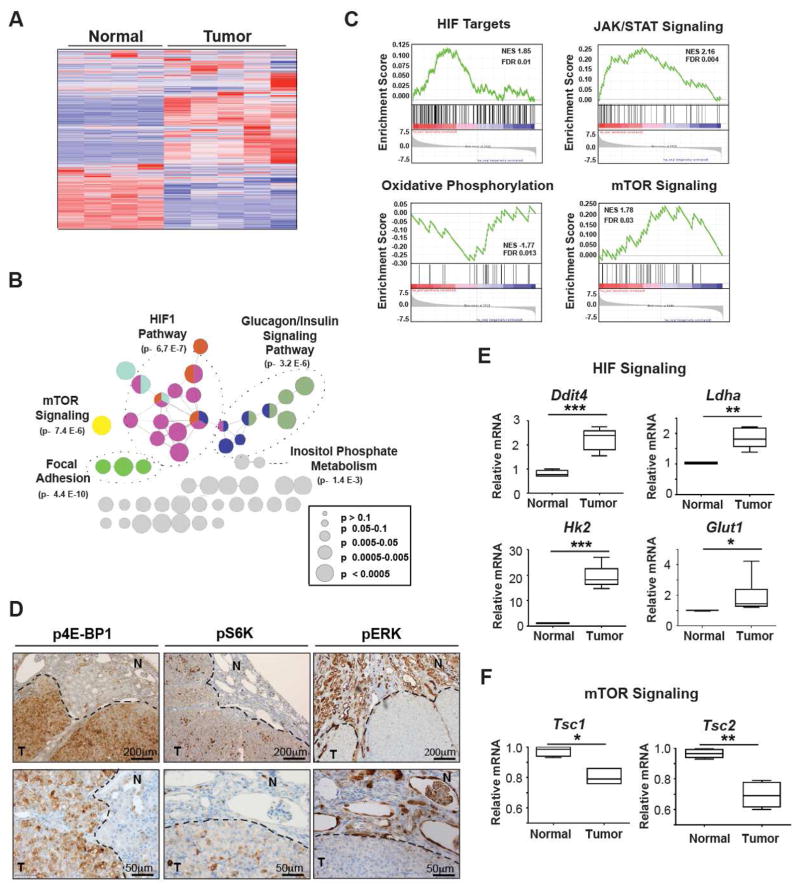
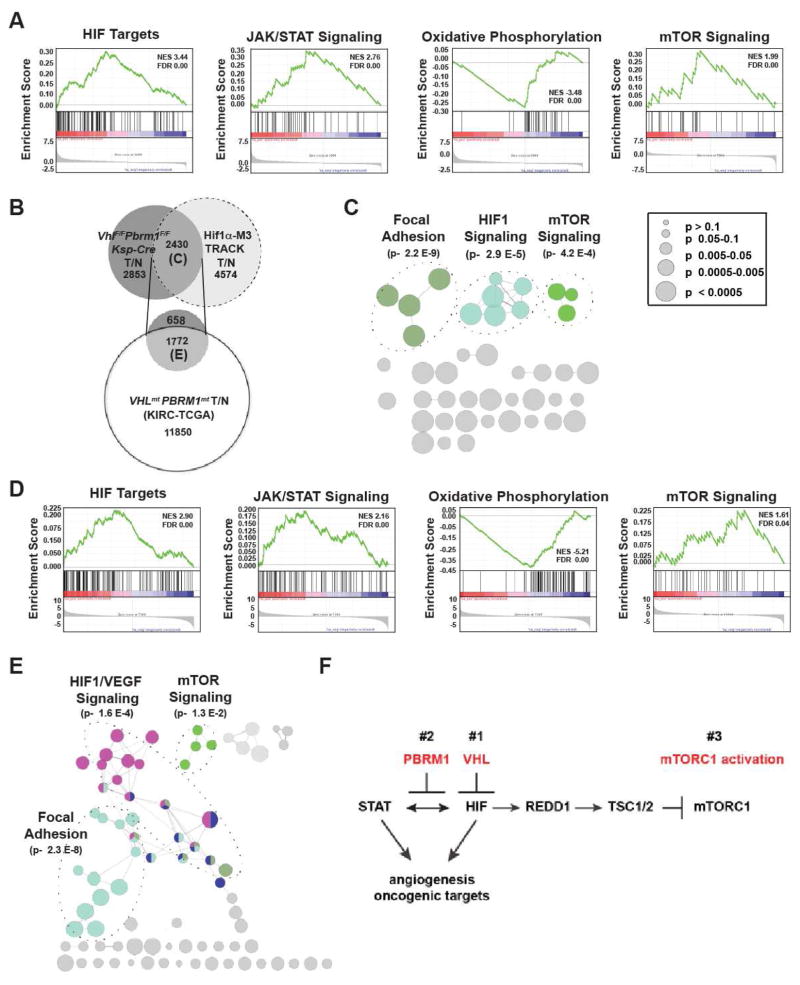
PBRM1 is the second most commonly mutated gene after VHL in clear cell renal cell carcinoma (ccRCC). However, the biological consequences of PBRM1 mutations for kidney tumorigenesis are unknown. Here, we find that kidney-specific deletion of Vhl and Pbrm1, but not either gene alone, results in bilateral, multifocal, transplantable clear cell kidney cancers. PBRM1 loss amplified the transcriptional outputs of HIF1 and STAT3 incurred by Vhl deficiency. Analysis of mouse and human ccRCC revealed convergence on mTOR activation, representing the third driver event after genetic inactivation of VHL and PBRM1. Our study reports a physiological preclinical ccRCC mouse model that recapitulates somatic mutations in human ccRCC and provides mechanistic and therapeutic insights into PBRM1 mutated subtypes of human ccRCC.

Keywords: HIF1; MTOR; PBRM1; STAT3; VHL; ccRCC; epigenetics; genetics; kidney cancer; mouse tumor model.


Figures

Figure 1
Figure 1. Pbrm1F/FKsp-Cre Mice Develop Obstructive Hydronephrosis
(A) Representative MRI images of unilateral or bilateral severe hydronephrosis. The non-neoplastic mass at the proximal ureter is marked by arrow. (B) Incidence of hydronephrosis in WT and Pbrm1F/FKsp-Cre mice. Cohorts of animals at 12 months of age on average were randomly selected for MRI scanning. ***, P < 0.001 (Fischer’s Exact). (C) Incidence of hydronephrosis in the Pbrm1F/FKsp-Cre mice based on gender. (D) Location distribution of hydronephrosis in Pbrm1F/FKsp-Cre mouse kidneys. (E) Kidney volume in WT and Pbrm1F/FKsp-Cre mice. *, P < 0.05 (Mann Whitney). (F) Serum creatinine levels of mice in (E). ns denotes not statistically significant.
Figure 2
Figure 2. VhlF/FPbrm1F/FKsp-Cre Mice Develop Polycystic Kidney Disease and exhibit Premature Mortality
(A) Kaplan-Meier survival curve of WT, VhlF/FKsp-Cre, Pbrm1F/FKsp-Cre, and VhlF/FPbrm1F/FKsp-Cre mice. (B) Incidence of polycystic kidney disease in WT, VhlF/FKsp-Cre, Pbrm1F/FKsp-Cre, and VhlF/FPbrm1F/FKsp-Cre. Age and number of animals in each group are specified. (C) Representative MRI and gross images of kidneys of the indicated genotypes. (D) Kidney volumes of WT, VhlF/FKsp-Cre, and VhlF/FPbrm1F/FKsp-Cre mice. Numbers of kidneys measured in each group (n) are indicated. **, P =0.0096; ***, P < 0.0001 (Mann Whitney). (E) Serum creatinine levels in WT, VhlF/FKsp-Cre, and VhlF/FPbrm1F/FKsp-Cre mice (the same as 1D). ***, P < 0.001 (Mann Whitney).
Figure 3
Figure 3. VhlF/FPbrm1F/FKsp-Cre Mice Develop Multifocal CA-IX Positive Clear Cell Kidney Cancers
A) Representative gross images (column1), histopathological images (column 2), and immunohistochemistry of CA-IX (columns 3 and 4) of WT, VhlF/FKsp-Cre, Pbrm1F/FKsp-Cre, and VhlF/FPbrm1F/FKsp-Cre kidneys. Tumor and cyst are indicated by white and black arrows, respectively. T and N denote Tumor and adjacent Normal, respectively. Scale bars are at 50μm, 100μm, or 200μm as indicated. (B) Heatmap of inter-sample correlations (red, positive) between mRNA profiles of TCGA human RCC tumors (columns, TCGA KIRC and KICH data) and VhlF/FPbrm1F/FKsp-Cre mouse kidney tumors (rows). (C) Representative images of immunofluorescence of LTL (column 1), and immunohistochemistry of THP (column 2), CD45 (column 3) and CD31 (column 4) in VhlF/FPbrm1F/FKsp-Cre tumors and adjacent non-tumor tissues.
Figure 4
Figure 4. VhlF/FPbrm1F/FKsp-Cre Mice Tumors Are Transplantable and Invasive
(A) Representative gross images (column 1), histopathological images (column 2), and immunohistochemistry of CA-IX (column 3) of donor VhlF/FPbrm1F/FKsp-Cre kidney tumors (row1), primary allograft kidney tumors (row2), and secondary allograft kidney tumors (row3). (B) Representative histopathological image (top panel), and immunohistochemistry of CA-IX (bottom panel) of the transplanted invasive tumors. (C) PCR genotyping of WT kidney, and donor and allograft VhlF/FPbrm1F/FKsp-Cre tumors.
Figure 5
Figure 5. PBRM1 Loss Amplifies the Transcriptional Outputs of HIF1 and STAT3 Incurred by VHL Loss
(A) Heat map of genes with significantly different expression in the renal cortices of WT, VhlF/FKsp-Cre, Pbrm1F/FKsp-Cre, and VhlF/FPbrm1F/FKsp-Cre mice at 12 weeks of age. Unsupervised hierarchical agglomerative clustering identified three distinct clusters using Pearson correlation and average linkage as similarity measures for pairs of genes and pairs of inchoate clusters, respectively. (B) Clusters I and III were tested for pathway enrichment and presented using ClueGO. (C) Inferred HIF and STAT motif activities across the indicated genotypes. *, P = 0.035; **, P = 0.0022 (one sided t-test). (D) The mRNA levels of the indicated genes from the indicated genotypes were assessed by qRT-PCR. Data were normalized against GAPDH (mean ± s.d., n=3 independent experiments). *, P < 0.05; **, P < 0.005 (Student’s t-test).
Figure 6
Figure 6. Vhl and Pbrm1 Doubly Deficient Clear Cell Kidney Tumors Display Hyperactive mTORC1 Signaling
(A) Heat map of genes with significantly different expression in age-matched WT kidneys (n=4) and VhlF/FPbrm1F/FKsp-Cre tumors (n=5) based on unsupervised hierarchical agglomerative clustering. (B) The genes that were significantly, differentially expressed in VhlF/FPbrm1F/FKsp-Cre T/N (FDR < 0.05) were tested for enrichment and represented using ClueGO. (C) GSEA plots of the ranked list of differentially expressed genes in VhlF/FPbrm1F/FKsp-Cre kidney tumors (T) and WT normal kidneys (N) generated using three gene sets: curated HIF targets, KEGG JAK STAT signaling pathway, KEGG oxidative phosphorylation pathway, and KEGG mTOR Pathway enrichment. (D) Immunohistochemistry of phosphorylated-4E-BP1 (p4E-BP1) at threonine 37/46 (column 1), phosphorylated S6K (pS6K) at serine 240/244 (column 2), and phosphorylated ERK1/2 (pERK) at threonine 202/tyrosine 204 in VhlF/FPbrm1F/FKsp-Cre tumors. T and N denote Tumor and adjacent Normal, respectively. Scale bars are at 100μm or 200μm as indicated. (E–F) The mRNA levels of Ddit4, Ldha, Hk2, Glut1, Tsc1 and Tsc2 in VhlF/FPbrm1F/FKsp-Cre tumors (n=6) and WT kidneys (n=4) were assessed by qRT-PCR. Data were normalized against GAPDH (mean ± s.d.). *, P < 0.05; **, P < 0.005; ***, P < 0.0005 (Student’s t-test).
Figure 7
Figure 7. Analyses of Mouse and Human ccRCC Reveal Convergence on the mTOR Pathway Activation
(A) GSEA plots of the ranked list of differentially expressed genes in Hif1α-M3 TRACK mouse tumors (T) and normal (N) generated using four gene sets: curated HIF targets, KEGG JAK STAT signaling pathway, KEGG oxidative phosphorylation pathway, and KEGG mTOR Pathway. (B) Venn diagram of differentially expressed genes in VhlF/FPbrm1F/FKsp-Cre tumors (T) vs. WT normal (N) (T/N), Hif1α-M3 TRACK T/N samples, and human VHLmtPBRM1mt ccRCC tumors vs. normal. (C) The differentially expressed genes at the intersect of VhlF/FPbrm1F/FKsp-Cre T/N and Hif1α-M3 TRACK T/N were tested for enrichment and presented using ClueGO. (D) GSEA plots of the ranked list of differentially expressed genes in human VHLmtPBRM1mt ccRCC tumors versus normal kidneys generated using four gene sets: curated HIF targets, KEGG JAK STAT signaling pathway, KEGG oxidative phosphorylation pathway, and KEGG mTOR Pathway. (E) The shared differentially expressed genes in VhlF/FPbrm1F/FKsp-Cre T/N, Hif1α-M3 TRACK T/N, and TCGA-KIRC VHLmtPBRM1mt T/N were tested for enrichment and presented using ClueGO. (F) Model depicts the chronological sequences of genetic and signaling events during the pathogenesis of Vhl and Pbrm1 doubly deficient ccRCC.

References

    1. Adam J, Hatipoglu E, O’Flaherty L, Ternette N, Sahgal N, Lockstone H, Baban D, Nye E, Stamp GW, Wolhuter K, et al. Renal cyst formation in Fh1-deficient mice is independent of the Hif/Phd pathway: roles for fumarate in KEAP1 succination and Nrf2 signaling. Cancer Cell. 2011;20:524–537. - PMC - PubMed
    1. Baba M, Furihata M, Hong SB, Tessarollo L, Haines DC, Southon E, Patel V, Igarashi P, Alvord WG, Leighty R, et al. Kidney-targeted Birt-Hogg-Dube gene inactivation in a mouse model: Erk1/2 and Akt-mTOR activation, cell hyperproliferation, and polycystic kidneys. J Natl Cancer Inst. 2008;100:140–154. - PMC - PubMed
    1. Balwierz PJ, Pachkov M, Arnold P, Gruber AJ, Zavolan M, van Nimwegen E. ISMARA: automated modeling of genomic signals as a democracy of regulatory motifs. Genome Res. 2014;24:869–884. - PMC - PubMed
    1. Biegel JA, Busse TM, Weissman BE. SWI/SNF chromatin remodeling complexes and cancer. Am J Med Genet C Semin Med Genet. 2014;166C:350–366. - PMC - PubMed
    1. Bindea G, Mlecnik B, Hackl H, Charoentong P, Tosolini M, Kirilovsky A, Fridman WH, Pages F, Trajanoski Z, Galon J. ClueGO: a Cytoscape plug-in to decipher functionally grouped gene ontology and pathway annotation networks. Bioinformatics. 2009;25:1091–1093. - PMC - PubMed

MeSH terms