. 2017 Mar 21;18(12):2918-2931.
doi: 10.1016/j.celrep.2017.02.067.

cis-Regulatory Circuits Regulating NEK6 Kinase Overexpression in Transformed B Cells Are Super-Enhancer Independent

Affiliations

cis-Regulatory Circuits Regulating NEK6 Kinase Overexpression in Transformed B Cells Are Super-Enhancer Independent

Yue Huang et al. Cell Rep. .

Abstract

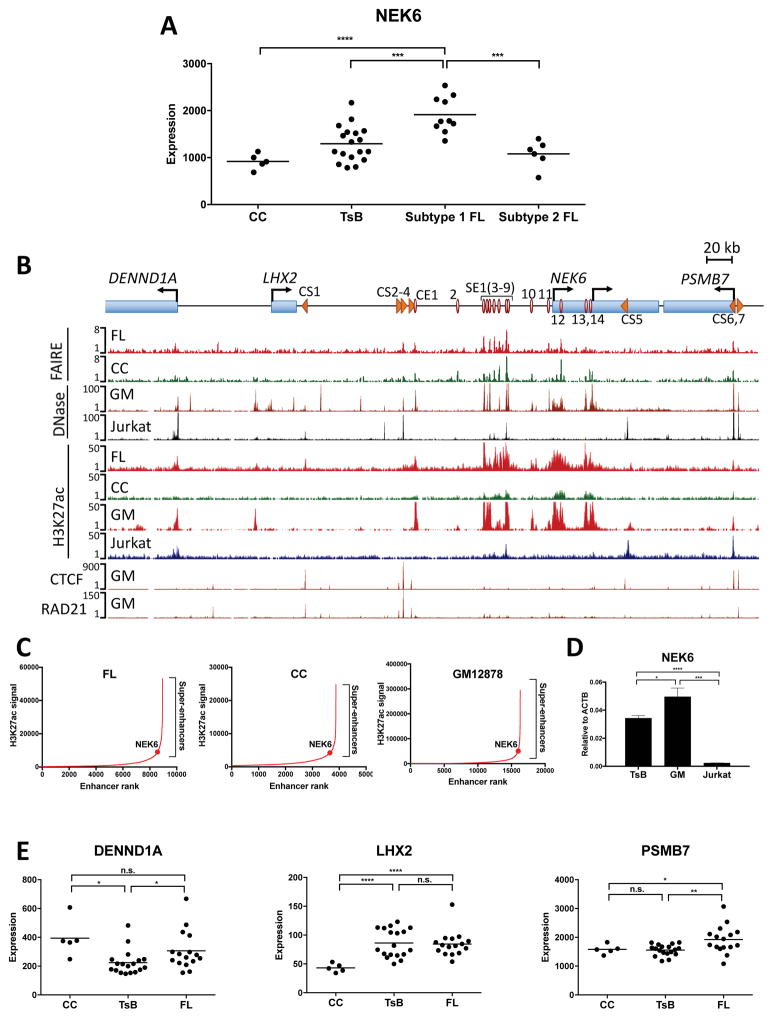
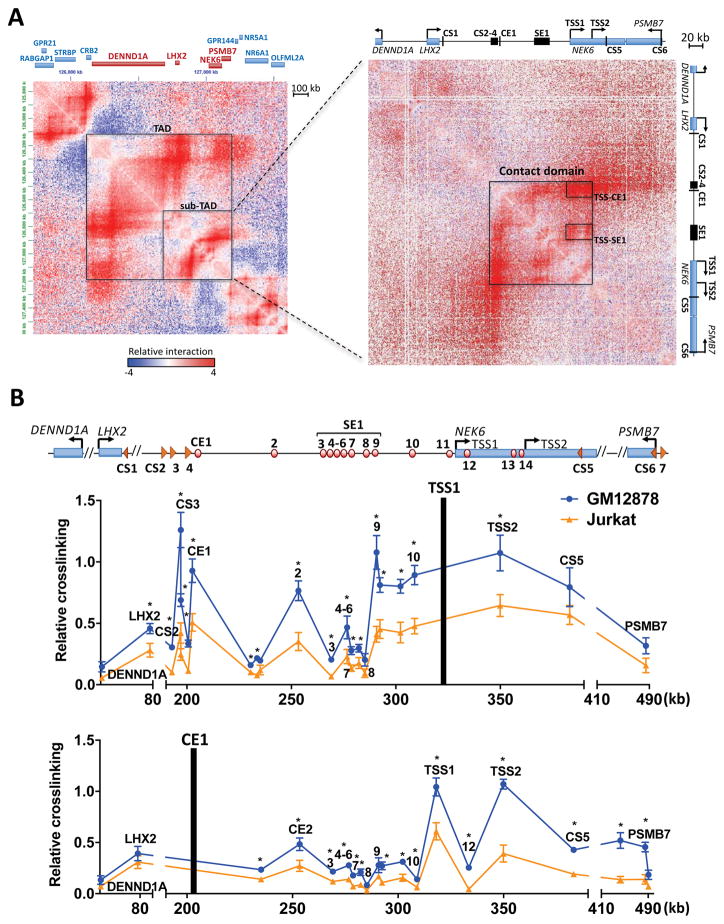
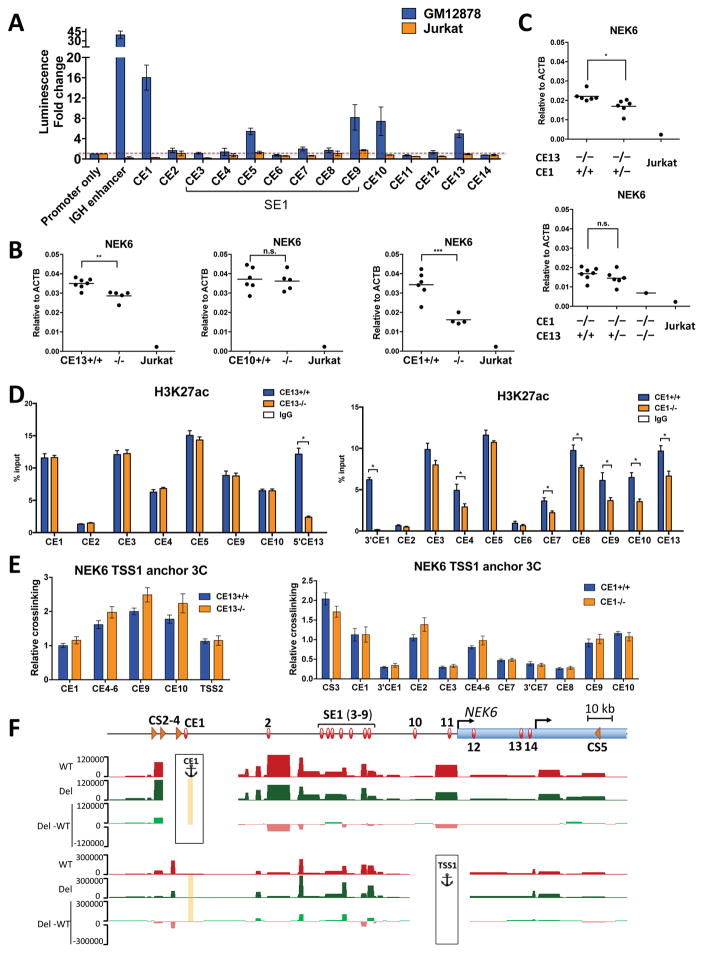
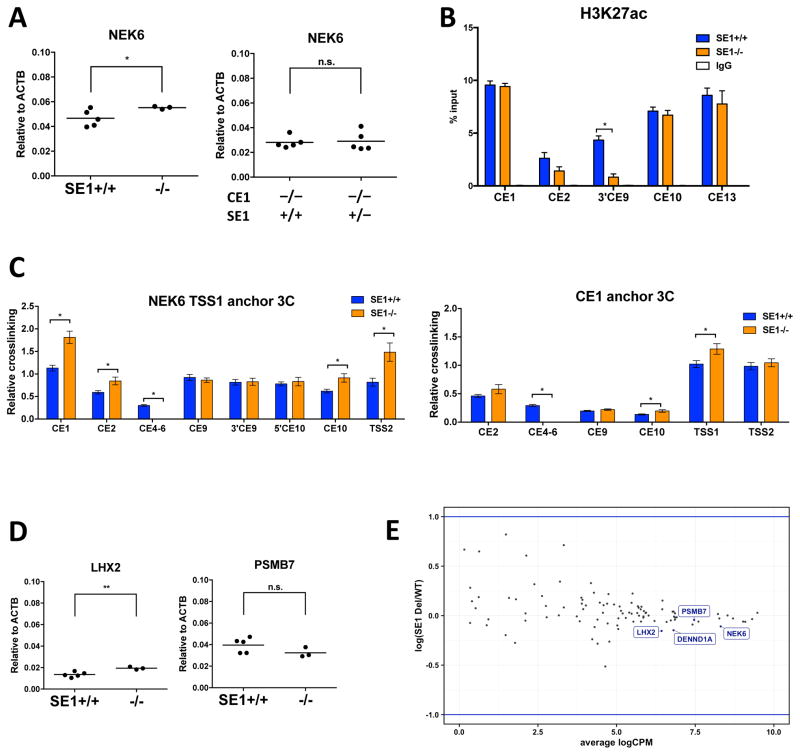
Alterations in distal regulatory elements that control gene expression underlie many diseases, including cancer. Epigenomic analyses of normal and diseased cells have produced correlative predictions for connections between dysregulated enhancers and target genes involved in pathogenesis. However, with few exceptions, these predicted cis-regulatory circuits remain untested. Here, we dissect cis-regulatory circuits that lead to overexpression of NEK6, a mitosis-associated kinase, in human B cell lymphoma. We find that only a minor subset of predicted enhancers is required for NEK6 expression. Indeed, an annotated super-enhancer is dispensable for NEK6 overexpression and for maintaining the architecture of a B cell-specific regulatory hub. A CTCF cluster serves as a chromatin and architectural boundary to block communication of the NEK6 regulatory hub with neighboring genes. Our findings emphasize that validation of predicted cis-regulatory circuits and super-enhancers is needed to prioritize transcriptional control elements as therapeutic targets.

Keywords: B cell lymphoma; NEK6; chromatin; chromosomal architecture; cis-regulatory circuits; gene regulation; super-enhancer.


Figures

Figure 1
Figure 1. The NEK6 Regulatory Landscape in Normal and Transformed Cells
(A) Expression levels of NEK6 in primary human cells. Each dot represents normalized microarray signals for a purified B cell sample from independent healthy volunteers or FL biopsies (CC: tonsillar centrocytes, TsB: unfractionated tonsillar B cells). Statistical tests were performed for subtype 1 or 2 FL versus other cell types. Only significant differences are shown for clarity (unpaired t-test with Welch’s correction): ***p<0.005, and ****p<0.001. (B) Scheme depicting genes and regulatory elements in the NEK6 neighborhood. Red circles represent CEs that are FAIRE- and H3K27ac-positive in at least two FL samples from previously published data (Koues et al. 2015). Orange arrowheads depict CSs, as well as their orientations, as identified by chromatin profiling. UCSC Genome Browser views are shown for FAIRE- and H3K27ac ChIP-seq data from FL and CC samples (Koues et al. 2015), as well as DNase-seq, H3K27ac, CTCF and RAD21 ChIP-seq data in GM12878 (GM) and Jurkat cell lines (ENCODE). All sequencing data are presented as reads per million mapped reads. (C) Rank order of increasing H3K27ac enrichment at enhancers in the indicated cell types. SEs were called using ROSE, with the NEK6-associated SE highlighted. (D) NEK6 transcripts in the indicated cell types measured by RT-qPCR. Results represent the mean ± SEM of three independent experiments. Statistical significance (unpaired t-test with Welch’s correction): *p<0.05, ***p<0.005, and ****p<0.001. (E) Expression levels of NEK6 neighboring genes in primary B cell samples, as measured by microarray. Each dot represents an independent sample. Statistical significance (unpaired t-test with Welch’s correction): *p<0.05, and ***p<0.005. See also Figure S1.
Figure 2
Figure 2. The NEK6 Regulatory Hub
(A) Hi-C data for the NEK6 region in GM12878, as visualized in Juicebox (Rao et al. 2014). The intensity of each pixel represents relative normalized numbers of contact between corresponding regions, for which red and blue represent enriched or depleted interaction frequencies, respectively. Knight and Ruiz normalization (balanced) is applied to remove locus-specific biases. The observed over expected (O/E) signal is displayed to account for a higher number of interactions with closer regions due to one-dimensional proximity (Rao et al. 2014). Several chromatin structures and contact points are highlighted with black boxes. In the left panel, genes within the NEK6-TAD are colored red and remaining genes are colored blue. (B) Interaction frequencies, as measured by 3C-qPCR, for NEK6 TSS1 (top) and CE1 (bottom) viewpoints in GM12878 (NEK6 expressed) and Jurkat (NEK6 silent). Results represent the mean ± SEM of three independent experiments. Statistical significance (unpaired t-test with Welch’s correction): *p<0.05. See also Figure S2.
Figure 3
Figure 3. CEs Potentiate NEK6 in Transformed B Cells
(A) Luciferase reporter assays for 14 putative CEs near NEK6. Enhancer activities were measured transiently in GM12878 or Jurkat cells and calculated relative to an SV40 promoter-only reporter construct. Human IGH enhancer was included as a positive control. Results show the mean ± SEM of at least four independent experiments in GM12878, and at least two in Jurkat. (B and C) NEK6 transcripts, as measured by RT-qPCR, in different GM12878-derived CRISPR deletion subclones with the indicated genotypes or Jurkat cells, as a negative control. Each dot represents the Jurkat cell line or a unique subclone of GM12878, reported as the average of two independent RNA preparations, reverse transcription, and qPCR assays, the latter performed in triplicate. Statistical significance (unpaired t-test with Welch’s correction): *p<0.05, **p<0.01, and ***p<0.005. (D) H3K27ac ChIP assays in GM12878-derived subclones harboring deletions of CE13 (left) or CE1 (right). ChIP-DNA was analyzed by qPCR with primers in or adjacent to indicated CEs. ChIP assays with a non-specific IgG antibody are shown as controls. For panels D and E, each bar represents the mean ± SEM of two subclones, each of which includes two independent experiments. Statistical significance (unpaired t-test with Welch’s correction): *p<0.05. (E) Interaction frequencies, as measured by 3C-qPCR, in deletion subclones of CE13 (left) and CE1 (right) for the NEK6 TSS1 viewpoint. (F) UCSC Genome Browser views of interaction profiles, as measured by 4C-seq, for CE1 wild-type and deletion subclones using CE1 and NEK6-TSS1 as anchors. For each viewpoint, the average counts per HindIII fragment normalized by DESeq2 are shown for three wild-type (red), and three CS2-4 deletion lines (green). A plot for differential signal between deletion and wild-type samples (Del-WT) is displayed below. None of the differences are statistically significant (DESeq2). The deleted CE1 region is shown as a yellow rectangle. See also Figure S3.
Figure 4
Figure 4. SE1 Is a Dispensable Element in the NEK6 Regulome
(A) NEK6 transcripts measured by RT-qPCR of SE1 deletion subclones. Each dot represents a unique subclone, which is reported as the average of two independent experiments. See Fig. 3B and C for details. For panels A–D, statistical significance (unpaired t-test with Welch’s correction): *p<0.05. (B) H3K27ac ChIP assays in SE1 deletion subclones. See Fig. 3D for details. For panels B and C, each bar represents the mean ± SEM of two subclones, each of which includes two independent experiments. (C) Interaction frequencies, as measured by 3C-qPCR, in SE1 deletion subclones for NEK6 TSS1 (left) and CE1 (right) viewpoints. (D) LHX2 and PSMB7 transcripts measured by RT-qPCR in SE1 deletion subclones. Each dot represents a unique subclone, which is reported as the average of two independent experiments. (E) Expression profile for all genes located within 5 Mb of SE1, as measured by RNA-seq, in SE1 wild-type and deletion subclones of GM12878. Average logCPM indicates the average expression level of each gene among three wild-type and three deletion subclones, reported as log2 read counts per million mapped reads. Log(SE1 Del/WT) represents the log2 fold-change of each gene between the average CPM of deletion versus wild-type subclones. Blue lines denote two-fold differences. See also Figure S4.
Figure 5
Figure 5. CS2-4 Serves as a Chromatin and Architectural Boundary for the NEK6 Regulatory Hub
(A) CTCF ChIP assays in CS2-4 deletion subclones. ChIP-DNA was analyzed by qPCR using primers within or adjacent to indicated CSs. Each bar represents the mean ± SEM of two subclones, each of which includes two independent experiments. ChIP assays with a non-specific IgG antibody were performed as specificity controls. For panels A–E and G, statistical significance (unpaired t-test with Welch’s correction): *p<0.05, and **p<0.01. (B) Transcript abundance of genes in the NEK6-TAD, as measured by RT-qPCR, for CS2-4 deletion subclones. Each dot represents a unique subclone, which is reported as an average of two independent experiments. See Fig. 3B and C for details. (C) H3K27ac ChIP assays in C2-4 deletion subclones. See Fig. 3D for details. Each bar represents the mean ± SEM of two subclones, each of which includes two independent experiments. (D and E) Interaction frequencies, as measured by 3C-qPCR, in CS2-4 deletion subclones for CE1, NEK6 TSS1 (D), and the LHX2 promoter (E) viewpoints. Each dot in (D) or bar in (E) represents the mean ± SEM of two subclones, each of which includes two independent experiments. (F) UCSC Genome Browser views of interaction profiles, as measured by 4C-seq, for CS2-4 wild-type and deletion subclones using CE1 and NEK6-TSS1 as anchors. For each viewpoint, the average reads per HindIII fragment normalized by DESeq2 are shown for three wild-type (red), and three CS2-4 deletion lines (green). Reads located within the deleted CS2-4 region (yellow rectangle) are removed from all samples. Percentages of total normalized reads are displayed above each sample for regions upstream and downstream of CS2-4 deletion, as marked by double-headed arrow lines. For each viewpoint, a plot for differential signal between deletion and wild-type samples in natural log scale, ln (Del-WT), is displayed below. Statistical significance (generalized linear model adjusted by Benjamini-Hochberg procedure): p<0.05, are denoted by green or red asterisks for interactions that are increased or decreased in CS2-4 mutants, respectively. (G) Interaction frequencies, as measured by 3C-qPCR, in CS2-4 deletion subclones for CS0 (left), CS5 (middle), and CS6 (right) viewpoints. Each bar represents the mean ± SEM of two subclones, each of which includes two independent experiments. See also Figure S5.

References

    1. Bulger M, Groudine M. Functional and mechanistic diversity of distal transcription enhancers. Cell. 2011;144:327–339. - PMC - PubMed
    1. Chapuy B, McKeown MR, Lin CY, Monti S, Roemer MGM, Qi J, Rahl PB, Sun HH, Yeda KT, Doench JG, et al. Discovery and characterization of super-enhancer-associated dependencies in diffuse large B cell lymphoma. Cancer Cell. 2013;24:777–790. - PMC - PubMed
    1. Dixon JR, Selvaraj S, Yue F, Kim A, Li Y, Shen Y, Hu M, Liu JS, Ren B. Topological domains in mammalian genomes identified by analysis of chromatin interactions. Nature. 2012;485:376–380. - PMC - PubMed
    1. Dixon JR, Gorkin DU, Ren B. Chromatin Domains: The Unit of Chromosome Organization. Mol Cell. 2016;62:668–680. - PMC - PubMed
    1. Dukler N, Gulko B, Huang YF, Siepel A. Is a super-enhancer greater than the sum of its parts? Nat Genet. 2016;49:2–3. - PMC - PubMed

Publication types

MeSH terms