. 2017 Mar 21;18(12):2943-2956.
doi: 10.1016/j.celrep.2017.02.072.

Demethylated HSATII DNA and HSATII RNA Foci Sequester PRC1 and MeCP2 into Cancer-Specific Nuclear Bodies

Affiliations

Demethylated HSATII DNA and HSATII RNA Foci Sequester PRC1 and MeCP2 into Cancer-Specific Nuclear Bodies

Lisa L Hall et al. Cell Rep. .

Abstract

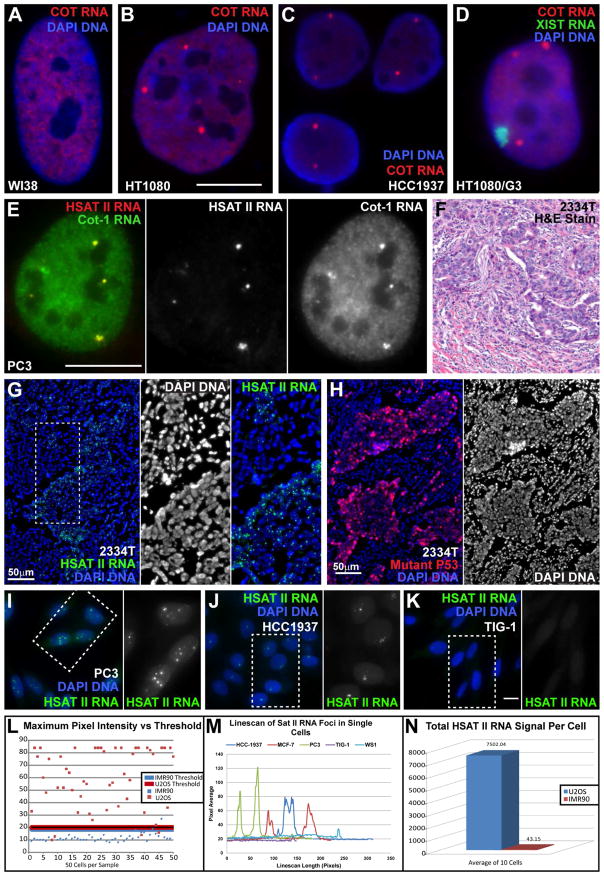
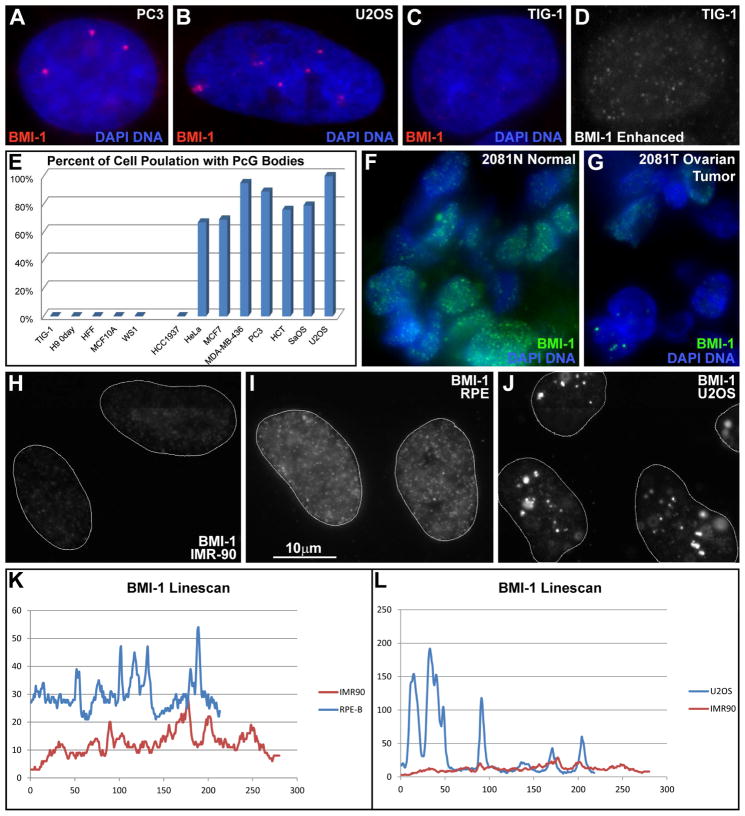
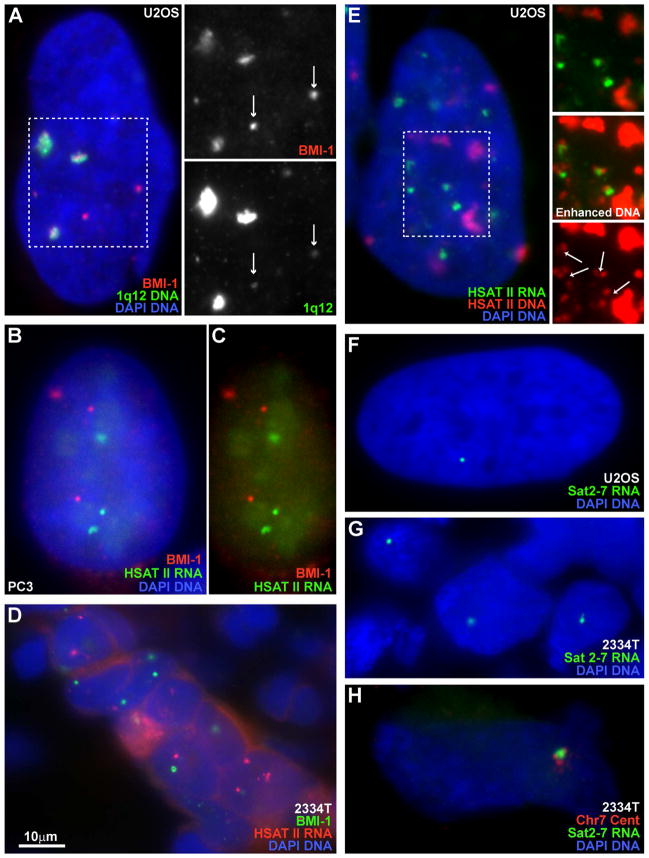
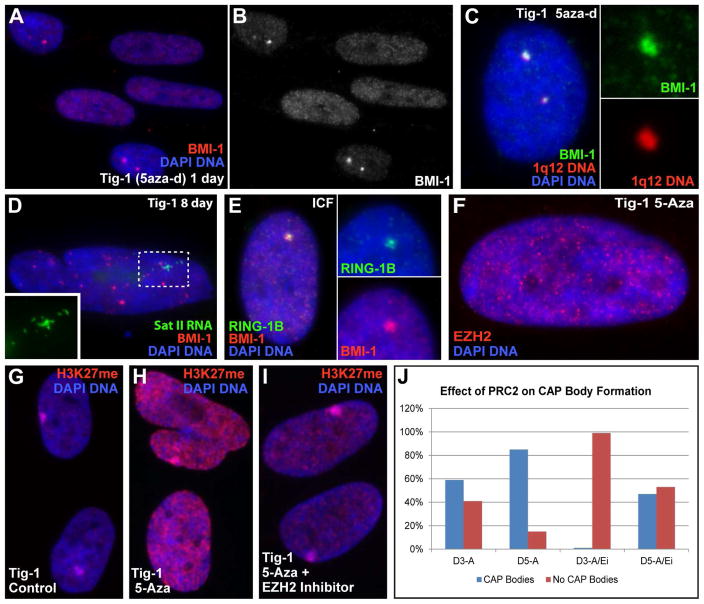
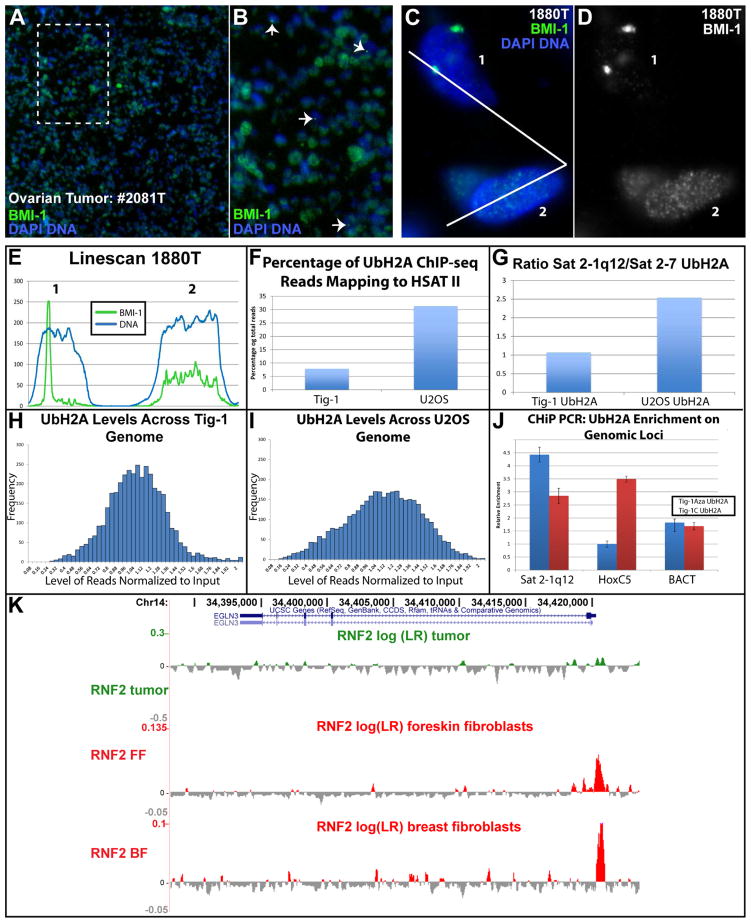
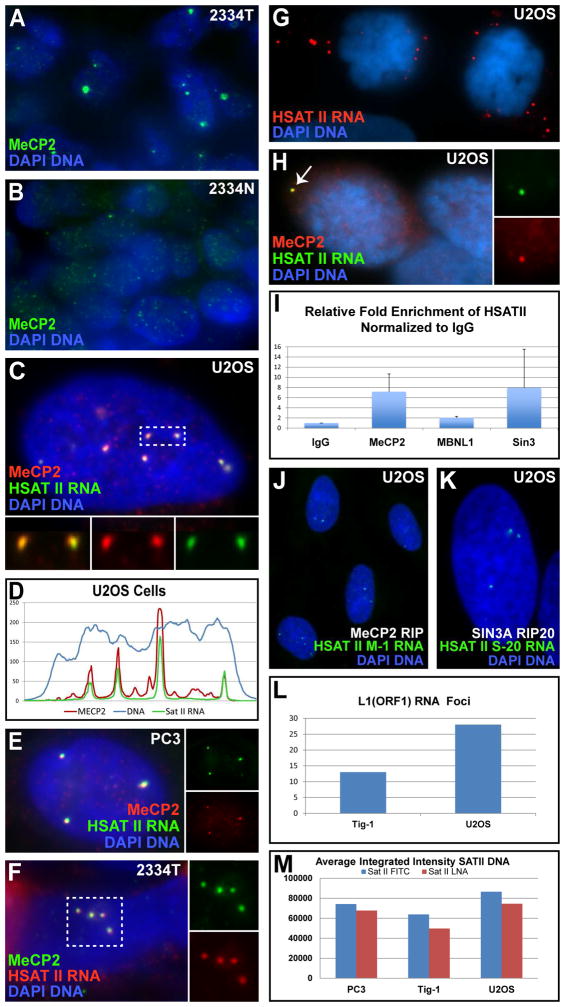
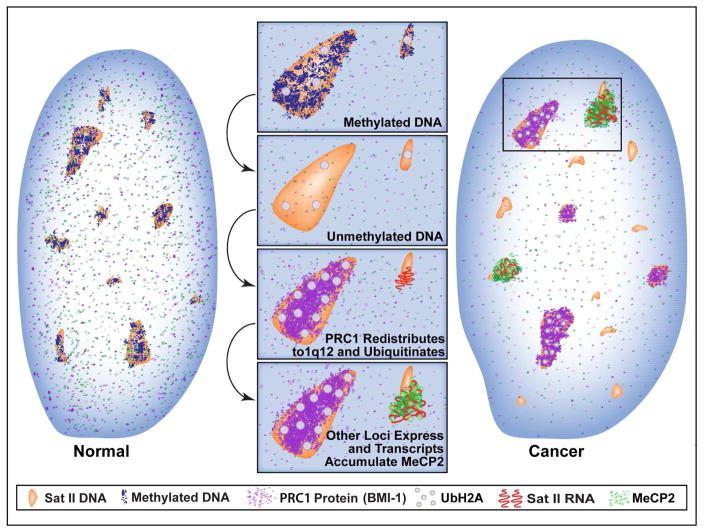
This study reveals that high-copy satellite II (HSATII) sequences in the human genome can bind and impact distribution of chromatin regulatory proteins and that this goes awry in cancer. In many cancers, master regulatory proteins form two types of cancer-specific nuclear bodies, caused by locus-specific deregulation of HSATII. DNA demethylation at the 1q12 mega-satellite, common in cancer, causes PRC1 aggregation into prominent Cancer-Associated Polycomb (CAP) bodies. These loci remain silent, whereas HSATII loci with reduced PRC1 become derepressed, reflecting imbalanced distribution of UbH2A on these and other PcG-regulated loci. Large nuclear foci of HSATII RNA form and sequester copious MeCP2 into Cancer-Associated Satellite Transcript (CAST) bodies. Hence, HSATII DNA and RNA have an exceptional capacity to act as molecular sponges and sequester chromatin regulatory proteins into abnormal nuclear bodies in cancer. The compartmentalization of regulatory proteins within nuclear structure, triggered by demethylation of "junk" repeats, raises the possibility that this contributes to further compromise of the epigenome and neoplastic progression.

Keywords: DNA methylation; breast cancer; cancer biomarkers; cancer epigenetics; centromere; nuclear structure; polycomb proteins; satellite heterochromatin.


Figures

Fig 1
Fig 1. Cancer cells contain bright nuclear HSATII RNA foci, not normal cells
A) Primary fibroblasts with normal nucleoplasmic CoT-1 RNA signal. B–C) Cancer nuclei with large CoT-1 RNA foci. (A–B same scale. Bar 10μm). D) Cot-1 RNA foci versus the XIST RNA territory. E) HSATII RNA overlaps Cot-1 RNA foci. Scale bar 10μm. Red and green channel separated at right. F) H&E stain of breast tumor #2334T. G) HSATII RNA foci in cancerous cells of breast tumor #2334T. Inserts: DNA channel and close-up of region in (G). H) Mutant-P53 staining labels cancerous cells in #2334T tissue. DNA channel separated at right. I–K) Cancer cells (I–J) have aberrant HSATII RNA foci, normal cells (K) do not. Green channel for boxed regions separated at right. Exposure, magnification & scale bar (10um) same for all images. L) Single brightest pixel in 50 cells of two cell lines (IMR90/normal & U2OS/cancer). Threshold for each is 3X average minimum pixel intensity. Most normal cells fall below threshold, but few cancer cells. M) Linescans through three cancer (HCC-1937, MCF-7 & PC3), and two normal nuclei (Tig-1 & WS1) show the size (width) and intensity (height) of HSATII RNA foci. N) Total HSATII RNA signal above threshold for cancer (U2OS) and normal (IMR90) nuclei were quantified (integrated intensity) and the average plotted.
Fig 2
Fig 2. BMI-1 aggregates in large aberrant foci, forming bodies
A–B) BMI-1 protein accumulates into bodies in cancer cells. C–D) Normal fibroblasts only have faint punctate nucleoplasmic signal. Red channel enhanced at right. Exposures the same for A–C. E) Cancer cell lines contain BMI-1 bodies while non-cancer lines do not. F) Normal human tissue with uniform punctate distribution of BMI-1. G) The matched tumor sample contains BMI-1bodies. H–J) Low nucleoplasmic BMI-1 in fibroblasts (H), slightly higher levels in telomerase immortalized RPE cells (I), and large accumulations in cancer cells (J), with concomitant reduction in nucleoplasmic signal. (H–J same scale). K–L) BMI-1 linescans of the same cells in (H–J).
Fig 3
Fig 3. PRC1 aggregates on HSATII DNA at 1q12 maintaining repression while other loci become de-repressed
A) The pUC1.77 probe labels HSATII on Chr1 and some on Chr16 (arrows), and correlates with BMI-1 “CAP” bodies. Channels from outlined region are separated at right. B–C) CAP bodies and HSATII RNA are mutually exclusive. Red and green channels of image B at right. D) CAP bodies and HSATII RNA foci in breast tumor tissue. E) HSATII RNA is expressed from small HSATII loci and not from the large 1q12 loci. Small loci are visible when DNA signal (of outlined region) is separated and enhanced at right. HSATII RNA accumulates adjacent to DNA loci (arrows). F–G) Sat2-7 probe labels only 1–2 RNA foci in U2OS cells (F) or in breast tumor #2334T (G). H) Chr7 specific centromere probe verifies Sat2-7 RNA is expressed from Chr7.
Fig 4
Fig 4. CAP bodies are induced by DNA de-methylation and PRC2 activity
A–B) Fibroblasts treated with 5aza-d form CAP bodies. Red channel separated in (B). C) CAP bodies form over 1q12 in demethylated fibroblasts. Inserts: Colors separated for top body. D) HSATII is expressed following longer 5aza-d treatment. Insert: green channel of outlined region. E) CAP bodies are present in ICF cell nuclei. Inserts: Color channels separated for CAP body. F) EZH2 (PRC2) does not aggregate in CAP bodies following 5-aza. G) Low level H3K27me in controls, with enrichment on the inactive X-chromosome. H) Increased H3K27me following 5-aza treatment. I) H3K27me levels reduced with simultaneous treatment with EZH2-inhibitor and 5-aza. Equal exposures for G–I. J) Number of cells with CAP bodies on Day 3 and Day 5 following treatment with 5-aza (D3-A & D5-A) or 5-aza and EZH2-inhibitor (D3-A/Ei & D5-A/Ei).
Fig 5
Fig 5. CAP bodies sequester PRC1 affecting genomic distribution of UbH2A
A) Low mag (10X) view of BMI-1 in tumor tissue. B) Magnification of area in box of Image A, show cells with CAP bodies (arrows) and reduced nucleoplasmic BMI-1. C–E) Tumor cells with CAP bodies have reduced nucleoplasmic BMI-1 compared to neighboring cells lacking CAP bodies. Green channel separated in (D), and linescan of cell 1 and 2 (E). F) ChIP-seq: Total HSATII reads with UbH2A in cancer versus normal cells. G) ChIP-seq: UbH2A levels on expressed (Sat2-7) versus repressed (1q12) HSAT II sequences in normal and cancer cells (total reads FigS3E). H–I) ChIP-seq: distribution of UbH2A across the genome in normal (H), and cancer (I) cells. J) ChIP-PCR: UbH2A enrichment on 1q12, HoxC5 and β-actin loci before and after 5aza treatment. K) RING1B/RNF2 on the EGLN3 gene (involved in hereditary breast and ovarian cancer) in cancer cells and normal foreskin and breast fibroblasts.
Fig 6
Fig 6. MeCP2 accumulates with HSATII RNA into CAST bodies
A–B) MeCP2 bodies in breast cancer (A), and matched normal samples (B). C) MeCP2 bodies are coincident with HSATII RNA foci. Inserts: colors separated for box. D) Linescan of nucleus in image (C). E–F) MeCP2 and HSATII RNA in cultured cancer cells (E) and tumor tissue (F). Inserts: colors separated for image or outlined region. G–H) HSATII RNA foci released to cytoplasm in mitotic cells (G), are still associated with MeCP2 (H). Inserts: colors separated for CAST body (arrow). I) RNA-IP: HSATII RNA is pulled down with MeCP2 & SIN3A, but not MBNL1. J–K) HSATII probes made from MeCP2 (J) or SIN3A (K) RIP labels same HSATII RNA foci in cancer nuclei. L) Average number of L1 RNA foci per nucleus in cancer and normal cells. M) Average integrated intensity of HSATII DNA FISH signal in normal (Tig-1) and cancer (U2OS & PC3) cells using two different probes (“SatII Fitc” = Sat2-59nt probe & “SatII LNA” = Sat2-24nt LNA probe).
Fig 7
Fig 7. Demethylated HSATII DNA and aberrant HSATII RNA foci can sequester copious epigenetic factors and impact the genomic balance of heterochromatin marks
HSATII DNA loci in normal cells are methylated, ubiquitinated and repressed. When HSATII DNA becomes de-methylated, PRC1 proteins aggregate specifically at HSATII mega-satellite on 1q12 (and sometimes 16q11), where it increases UbH2A levels and maintains repression. Meanwhile, other HSATII loci in the nucleoplasm lower in PRC1 become de-repressed and begin to express HSATII RNA, which in turn binds large amounts of MeCP2. Thus, high copy HSATII DNA and RNA can accumulate large amounts of epigenetic factors into cancer-associated PcG (CAP) bodies and cancer-associated satellite transcript (CAST) bodies, and impact their accessibility in the cancer epigenome.

References

    1. Bantignies F, Cavalli G. Polycomb group proteins: repression in 3D. Trends Genet. 2011;27:454–464. - PubMed
    1. Bersani F, Lee E, Kharchenko PV, Xu AW, Liu M, Xega K, MacKenzie OC, Brannigan BW, Wittner BS, Jung H, et al. Pericentromeric satellite repeat expansions through RNA-derived DNA intermediates in cancer. Proc Natl Acad Sci U S A. 2015;112:15148–15153. - PMC - PubMed
    1. Bhatnagar S, Gazin C, Chamberlain L, Ou J, Zhu X, Tushir JS, Virbasius CM, Lin L, Zhu LJ, Wajapeyee N, et al. TRIM37 is a new histone H2A ubiquitin ligase and breast cancer oncoprotein. Nature. 2014;516:116–120. - PMC - PubMed
    1. Biamonti G, Vourc’h C. Nuclear stress bodies. Cold Spring Harb Perspect Biol. 2010;2:a000695. - PMC - PubMed
    1. Bierhoff H, Postepska-Igielska A, Grummt I. Noisy silence: non-coding RNA and heterochromatin formation at repetitive elements. Epigenetics. 2014;9:53–61. - PMC - PubMed

Publication types