. 2017 Mar 21;18(12):3005-3017.
doi: 10.1016/j.celrep.2017.02.079.

Myocardial Infarction Primes Autoreactive T Cells through Activation of Dendritic Cells

Affiliations

Myocardial Infarction Primes Autoreactive T Cells through Activation of Dendritic Cells

Katrien Van der Borght et al. Cell Rep. .

Abstract

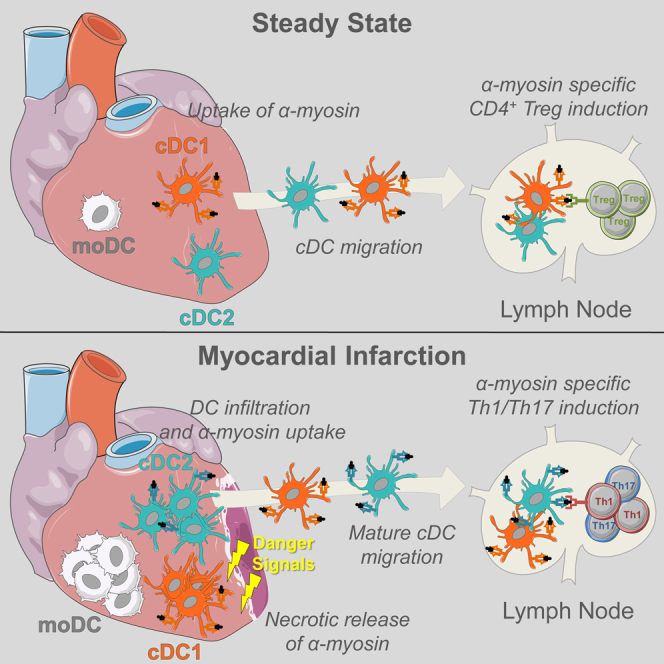
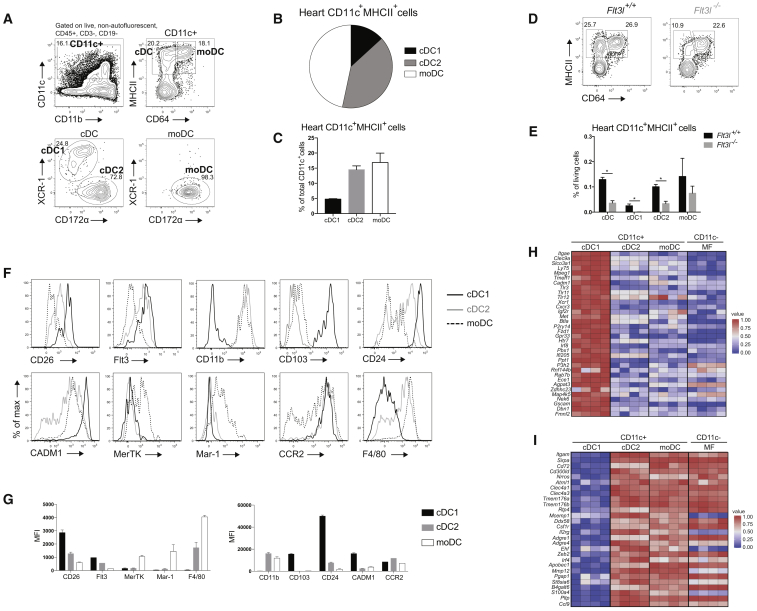
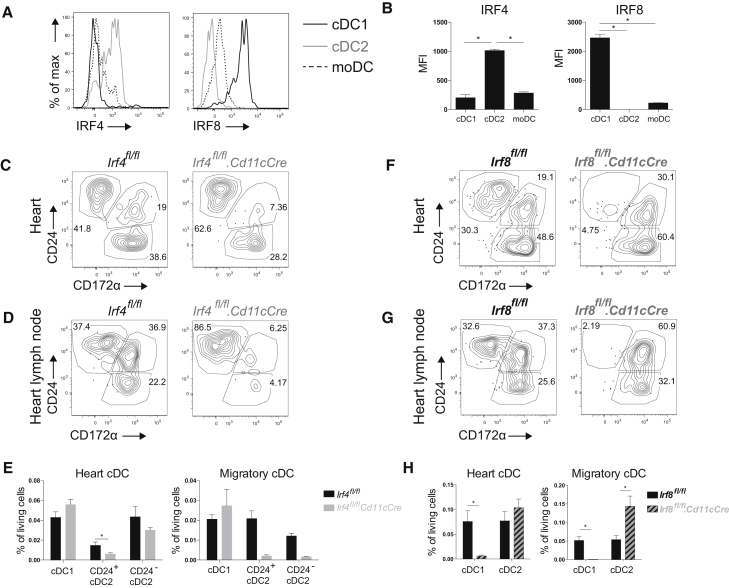
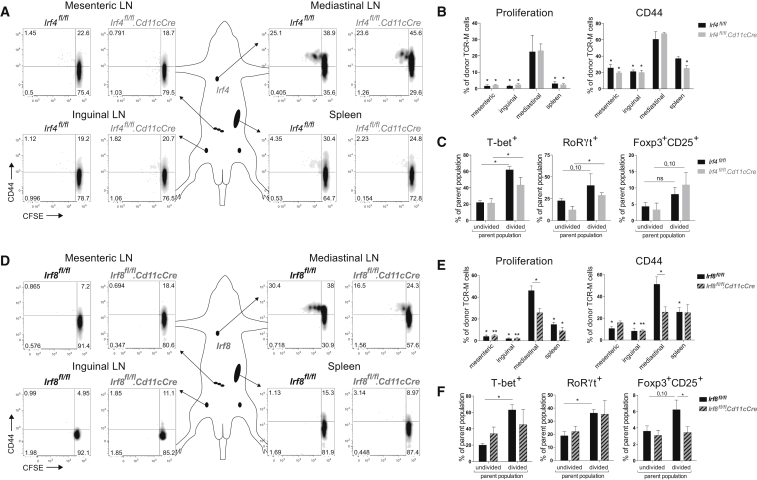
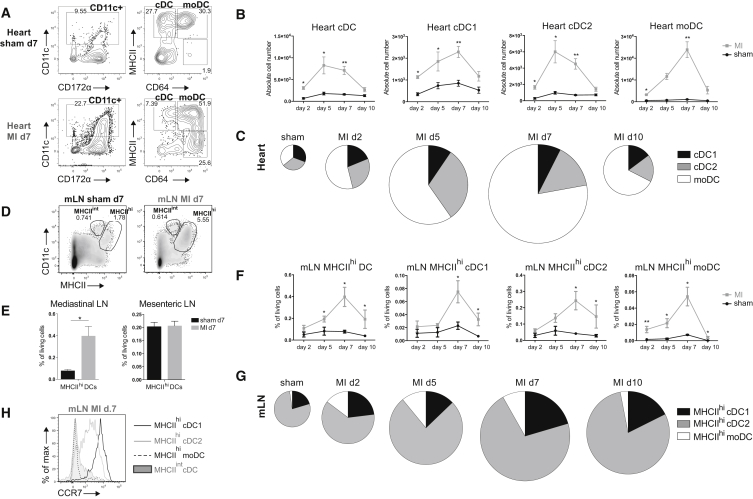
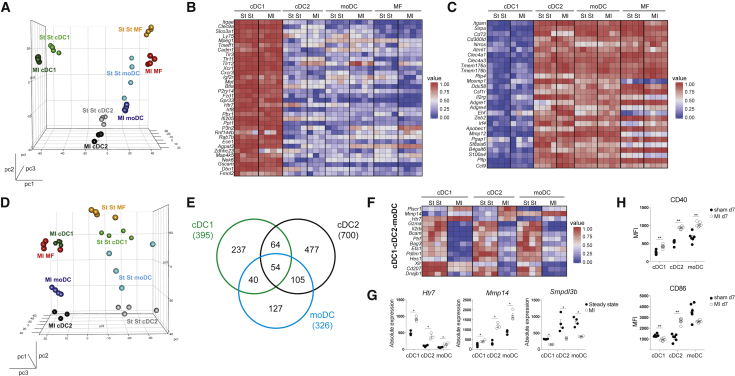
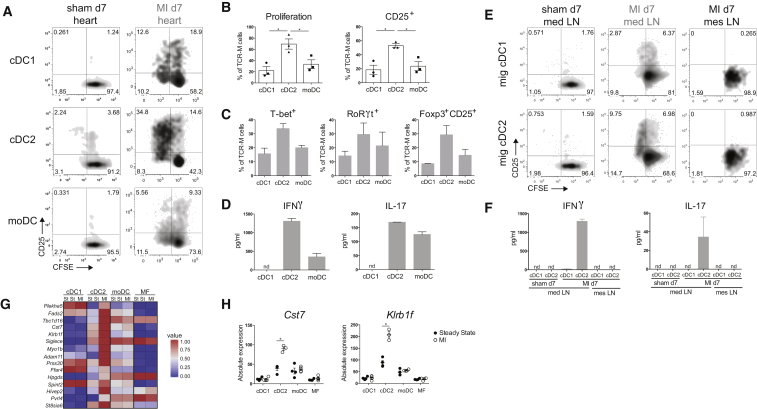
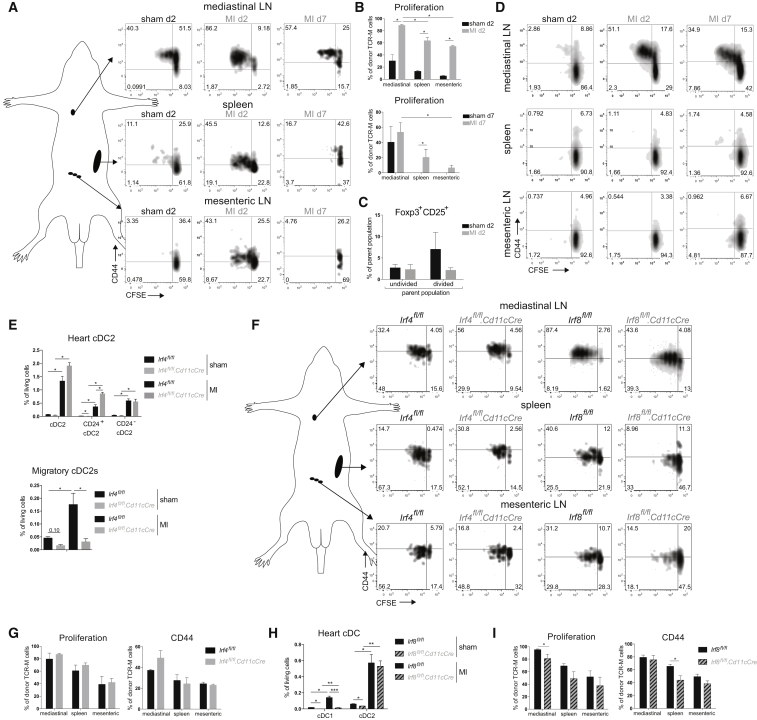
Peripheral tolerance is crucial for avoiding activation of self-reactive T cells to tissue-restricted antigens. Sterile tissue injury can break peripheral tolerance, but it is unclear how autoreactive T cells get activated in response to self. An example of a sterile injury is myocardial infarction (MI). We hypothesized that tissue necrosis is an activator of dendritic cells (DCs), which control tolerance to self-antigens. DC subsets of a murine healthy heart consisted of IRF8-dependent conventional (c)DC1, IRF4-dependent cDC2, and monocyte-derived DCs. In steady state, cardiac self-antigen α-myosin was presented in the heart-draining mediastinal lymph node (mLN) by cDC1s, driving the proliferation of antigen-specific CD4+ TCR-M T cells and their differentiation into regulatory cells (Tregs). Following MI, all DC subsets infiltrated the heart, whereas only cDCs migrated to the mLN. Here, cDC2s induced TCR-M proliferation and differentiation into interleukin-(IL)-17/interferon-(IFN)γ-producing effector cells. Thus, cardiac-specific autoreactive T cells get activated by mature DCs following myocardial infarction.

Keywords: IRF4; IRF8; autoimmunity; cardiac myosin; dendritic cell; gene expression; heart; myocardial infarction; tissue necrosis; tolerance.


Figures

None
Graphical abstract
Figure 1
Figure 1
CD11c-Expressing Cells in the Heart Can Be Subdivided into cDC1s, cDC2s, and moDCs (A) Flow cytometry gating strategy for DC subsets in steady-state heart of WT mice. (B) Pie chart representing the distribution of DC subsets in naive murine WT heart. (C) DC subset percentages of total CD11c+ cells in naive heart of WT mice. (D) Expression of MHCII and CD64 in CD45+LineageCD11c+ cells from naive heart in Flt3l+/+ and Flt3l−/− mice. (E) Total cDC, cDC1, cDC2, and moDC percentages of total living cells in naive heart of Flt3l+/+ and Fltl3−/− mice. (F) Representative histograms of CD26, Flt3, CD11b, CD103, CD24, CADM1, MerTK, Mar-1, CCR2, and F4/80 expression in steady-state WT heart cDC1s, cDC2s, and moDCs (n = 3). (G) MFI of marker expression on steady-state WT heart DC subsets shown in (F). (H and I) Heat map of relative expression of (H) hallmark cDC1 genes and (I) hallmark cDC2 genes in cDC1s, cDC2s, moDCs, and MFs sorted from naive WT hearts acquired by RNA-seq. All data in Figure 1 represent at least two independent experiments, and all bar graphs show data as mean ± SEM (p ≤ 0.05).
Figure 2
Figure 2
Transcription Factor Dependency of Cardiac cDC Subsets (A) Representative histogram of IRF4 and IRF8 expression of steady-state WT heart cDC1s, cDC2s, and moDCs. (B) MFI of IRF4 and IRF8 expression on naive WT heart DC subsets shown in (A). (C and D) MHCII+CD11c+CD64 cDCs are divided into CD24+CD172α cDC1s, CD24+CD172α+ cDC2s, and CD24CD172α+ cDC2s in Irf4fl/fl and Irf4fl/fl.Cd11cCre steady-state heart (C) and mediastinal LN (D). (E) Percentage of living cells of cDCs in Irf4fl/fl and Irf4fl/fl.Cd11cCre naive heart and mLN. (F and G) MHCII+CD11c+CD64 cDCs are divided into CD24+CD172α cDC1s, CD24+CD172α+ cDC2s, and CD24CD172α+ cDC2s in Irf8fl/fl and Irf8fl/fl.Cd11cCre steady-state heart (F) and mLN (G). (H) Percentage of living cells of cDCs in Irf8fl/fl and Irf8fl/fl.Cd11cCre steady-state heart and mLN. All data in Figure 2 represent at least two independent experiments, and all bar graphs show data as mean ± SEM (p ≤ 0.05).
Figure 3
Figure 3
IRF8-Dependent cDC1s Generate Myosin-Specific Tregs in Heart-Draining Lymph Node (A) Depicted LNs and spleen were isolated from TCR-M acceptor Irf4fl/fl and Irf4fl/fl.Cd11cCre mice 3 days after naive TCR-M transfer. CFSE dilution and CD44 expression of donor TCR-M cells was analyzed by flow cytometry. (B) Percentage of proliferation and CD44 expression of donor TCR-M cells in LNs and spleen from the experiment described in (A) (n = 4). (C) Percentage of T-bet, RoRγt, and Foxp3/CD25 expression on undivided and divided donor TCR-M cells isolated from mLN in Irf4fl/fl and Irf4fl/fl.Cd11cCre steady-state mice (n = 4). (D) 3 days after naive TCR-M injection, depicted LNs and spleen were isolated from TCR-M acceptor Irf8fl/fl and Irf8fl/fl.Cd11cCre mice. CFSE dilution and CD44 expression of donor TCR-M cells was analyzed by flow cytometry. (E) Percentage of proliferation and CD44 expression of donor TCR-M cells in LNs and spleen from the experiment described in (D) (n = 5). (F) Percentage of T-bet, RoRγt, and Foxp3/CD25 expression on undivided and divided donor TCR-M cells isolated from mLN in Irf8fl/fl and Irf8fl/fl.Cd11cCre steady-state mice (n = 5). All data in Figure 3 represent at least three independent experiments, and bar graphs show data as mean ± SEM (p ≤ 0.05).
Figure 4
Figure 4
DCs Infiltrate the Heart and Migrate to Mediastinal Nodes Following MI (A) Representative gating strategy for DC subsets in the heart of sham-operated and infarcted WT mice on day 7 post-surgery. (B) Absolute cell numbers of DC subsets in the heart of sham-operated and infarcted mice on day 2, 5, 7, and 10 post-surgery (n = 3–6). (C) Pie charts depicting the distribution of DC subsets in the sham-operated heart (pooled data from day 2-5-7-10 post-surgery) and infarcted heart on day 2, 5, 7, and 10 post-MI. Pie chart sizes are proportional to total cardiac DC percentages. (D) Representative gating strategy for MHCIIint and MHCIIhi DCs in mediastinal LN of sham-operated and infarcted WT mice on day 7 post-surgery. (E) MHCIIhi DC percentages of total living cells in mediastinal and mesenteric LN in sham-operated and infarcted mice at day 7 post-surgery (n = 6). (F) MHCIIhi DC subset percentages of total living cells in mediastinal LN of sham-operated and infarcted mice on day 2, 5, 7, and 10 post-surgery (n = 3–6). (G) Pie chart illustrating distribution of cDC1s, cDC2s, and moDCs among total MHCIIhi DC population in mLN in sham-operated and infarcted mice at day 2, 5, 7, and 10 post-surgery. Pie chart sizes are proportional to total MHCIIhi DCs in mLN. (H) Representative histogram of CCR7 expression of MHCIIhi cDC1s, MHCIIhi cDC2s, MHCIIhi moDCs, and MHCIIint cDCs from mLN on day 7. All bar graphs in Figure 4 show data as mean ± SEM (p ≤ 0.05; ∗∗p ≤ 0.01), and all data are representative of two independent experiments.
Figure 5
Figure 5
DCs from Infarcted Heart Have an Activated Phenotype (A) Front view of PCA of RNA-seq data from cDC1s, cDC2s, moDCs, and MFs in the steady-state (St St) and the infarcted (MI d7) heart. PCA was calculated using the top 15% most varying genes between cell subsets. Each dot symbolizes one independently sorted replicate of the indicated cell population, and four independent sorts were performed per subset. (B and C) Heat map of relative expression of hallmark cDC1 genes (B) and hallmark cDC2 genes (C) in cDC1s, cDC2s, moDCs, and MFs sorted from steady-state and infarcted hearts. (D) Side view of PCA of RNA-seq data from cDC1s, cDC2s, moDCs, and MFs in the steady-state and infarcted heart. (E) Venn diagram showing numbers and overlap of DEGs in cDC1s, cDC2s, and moDCs sorted from MI d7 compared to steady-state hearts. (F) Heat map of relative expression of top-shared DEGs between DC subsets from MI d7 hearts compared to corresponding subsets isolated from the steady-state heart. To calculate top DEGs, a threshold of a minimum 1.5 Log2 fold change was used. As an exception, no threshold was set on shared upregulated genes of cDC1s, cDC2s, and moDCs. (G) Bar graphs representing absolute expression of DEGs among cDC1s, cDC2s, and moDCs sorted from steady-state and infarcted hearts. (H) MFI of CD40 and CD86 expression (day 7 post-surgery) on heart DC subsets in sham-operated compared to the infarcted heart (n = 6). All bar graphs in Figure 5 show data as mean ± SEM (p ≤ 0.05; ∗∗p ≤ 0.01), and all data are representative of four independent experiments. See also Figure S1 and Tables S1–S7.
Figure 6
Figure 6
cDC2s Are the Main Presenters of αMyHC to Effector Autoreactive CD4+ T Cells Ex Vivo (A) CFSE dilution and CD25 expression of TCR-M cells in co-culture with sorted heart DC subsets from sham-operated versus MI d7 mice. Data are representative of three independent experiments (n = 12). (B) Quantification of percentages of proliferated and CD25-expressing TCR-M cells from co-cultures plotted in (A). Individual dots represent the value of one independent experiment (mean ± SEM; p ≤ 0.05). (C) Percentage of T-bet, RoRγt, and Foxp3/CD25 expression on TCR-M cells co-cultured with sorted heart DC subsets from MI day 7 hearts (mean ± SEM). (D) In supernatants of co-cultures plotted in (A), cytokines produced by TCR-M cells were detected by ELISA. Mean is calculated from values of technical replicates from one experiment (nd, not detectable) (mean ± SD). (E) CFSE dilution and CD25 expression of TCR-M cells co-cultured with sorted migratory cDC1s and cDC2s from mLNs of sham-operated and MI mice and from mesenteric LNs of MI mice. (F) After 3 days of co-culture (plotted in E), cytokines were measured in supernatants by ELISA. Mean is calculated from values of technical replicates from one experiment (nd, not detectable) (mean ± SD). (G) Heat map of relative expression of cDC2 genes exclusively upregulated in cDC2s from the infarcted heart compared to steady state. (H) Bar graphs representing absolute expression of interesting unique cDC2 DEGs (mean ± SEM; p ≤ 0.05). See also Table S8.
Figure 7
Figure 7
Myocardial Infarction Activates Autoreactive CD4+ T Cells In Vivo (A) TCR-M cells were injected into sham or MI mice on day 2 or day 7 post-surgery. CFSE dilution and CD44 expression of donor TCR-M cells is shown. (B) Proliferation of donor TCR-M cells in lymphoid organs from the experiment described in (A). (C) Percentage of Foxp3/CD25 expression on undivided and divided donor TCR-M cells isolated from mLN in sham and MI mice at day 2 post-surgery. (D) CFSE dilution and CD44 expression of naive TCR-M cells in ex vivo co-culture with bulk mediastinal LN, spleen, and mesenteric LN cells isolated from sham and MI mice on day 2 and day 7 post-surgery. (E) Heart cDC2 and migratory cDC2 percentages in mLN of sham and MI Irf4fl/fl and Irf4fl/fl.Cd11cCre mice at day 7 post-surgery. (F) Irf4fl/fl, Irf4fl/fl.Cd11cCre, Irf8fl/fl and Irf8fl/fl.Cd11cCre mice were injected with TCR-M cells at day 2 post MI. CFSE dilution and CD44 expression of donor TCR-M cells is shown. (G) Proliferation and CD44 expression of donor TCR-M cells in LNs and spleen from Irf4fl/fl and Irf4fl/fl.Cd11cCre mice from the experiment described in (F). (H) Heart cDC percentages of sham and MI Irf8fl/fl and Irf8fl/fl.Cd11cCre mice at day 7 post-surgery. (I) Proliferation and CD44 expression of donor TCR-M cells in LNs and spleen from Irf8fl/fl and Irf8fl/fl.Cd11cCre mice from the experiment described in (F). All bar graphs in Figure 7 show data as mean ± SEM (p ≤ 0.05; ∗∗p ≤ 0.01; ∗∗∗p ≤ 0.001), and all data are representative of two independent experiments.

References

    1. Anzai A., Anzai T., Nagai S., Maekawa Y., Naito K., Kaneko H., Sugano Y., Takahashi T., Abe H., Mochizuki S. Regulatory role of dendritic cells in postinfarction healing and left ventricular remodeling. Circulation. 2012;125:1234–1245. - PubMed
    1. Ardouin L., Luche H., Chelbi R., Carpentier S., Shawket A., Montanana Sanchis F., Santa Maria C., Grenot P., Alexandre Y., Grégoire C. Broad and largely concordant molecular changes characterize tolerogenic and immunogenic dendritic cell maturation in thymus and periphery. Immunity. 2016;45:305–318. - PubMed
    1. Bajaña S., Roach K., Turner S., Paul J., Kovats S. IRF4 promotes cutaneous dendritic cell migration to lymph nodes during homeostasis and inflammation. J. Immunol. 2012;189:3368–3377. - PMC - PubMed
    1. Bajaña S., Turner S., Paul J., Ainsua-Enrich E., Kovats S. IRF4 and IRF8 act in CD11c+ cells to regulate terminal differentiation of lung tissue dendritic cells. J. Immunol. 2016;196:1666–1677. - PMC - PubMed
    1. Caton M.L., Smith-Raska M.R., Reizis B. Notch-RBP-J signaling controls the homeostasis of CD8- dendritic cells in the spleen. J. Exp. Med. 2007;204:1653–1664. - PMC - PubMed

Publication types

LinkOut - more resources