. 2017 Mar 21;46(3):504-515.
doi: 10.1016/j.immuni.2017.02.019.

Dendritic Cells Display Subset and Tissue-Specific Maturation Dynamics over Human Life

Affiliations

Dendritic Cells Display Subset and Tissue-Specific Maturation Dynamics over Human Life

Tomer Granot et al. Immunity. .

Abstract

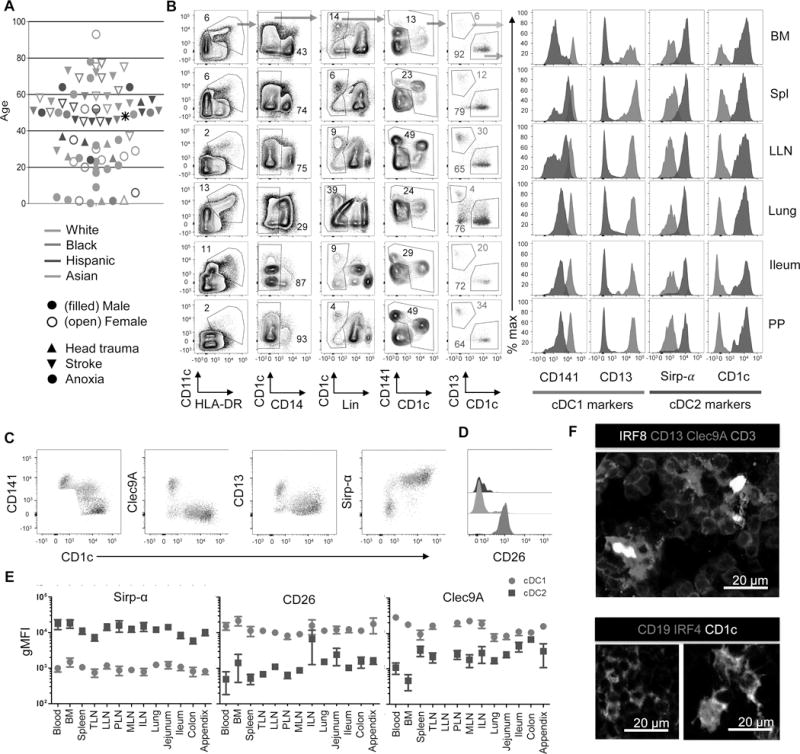
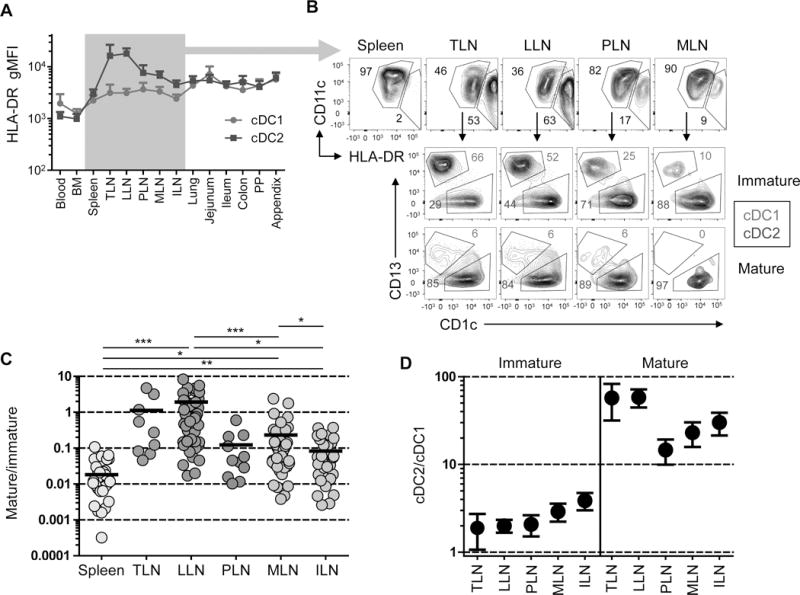
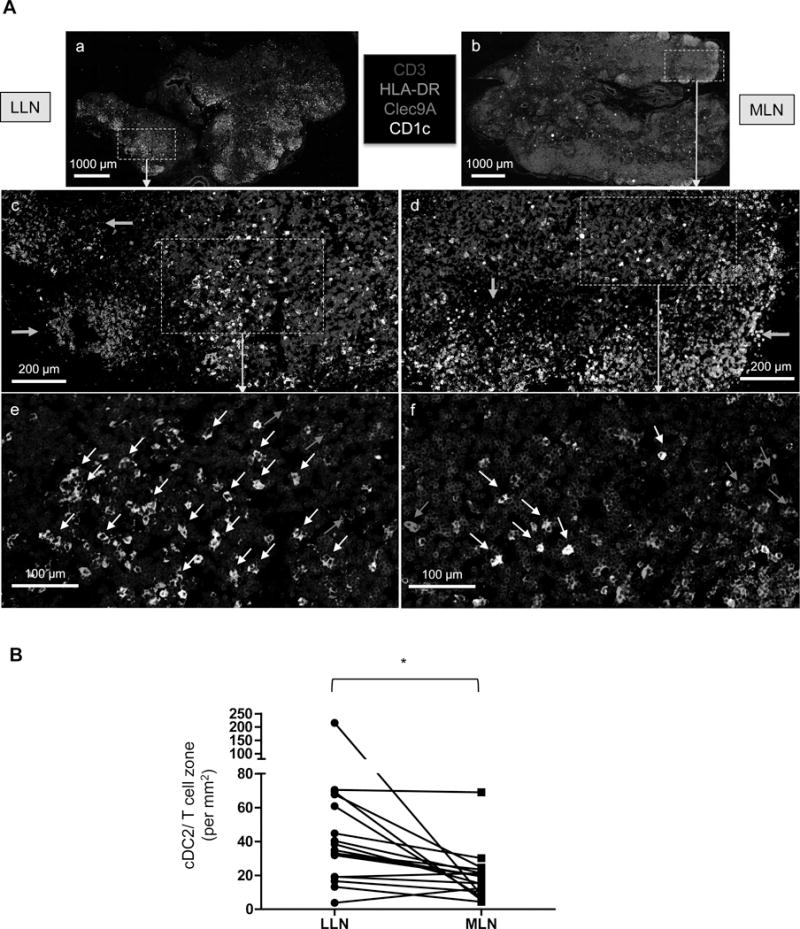
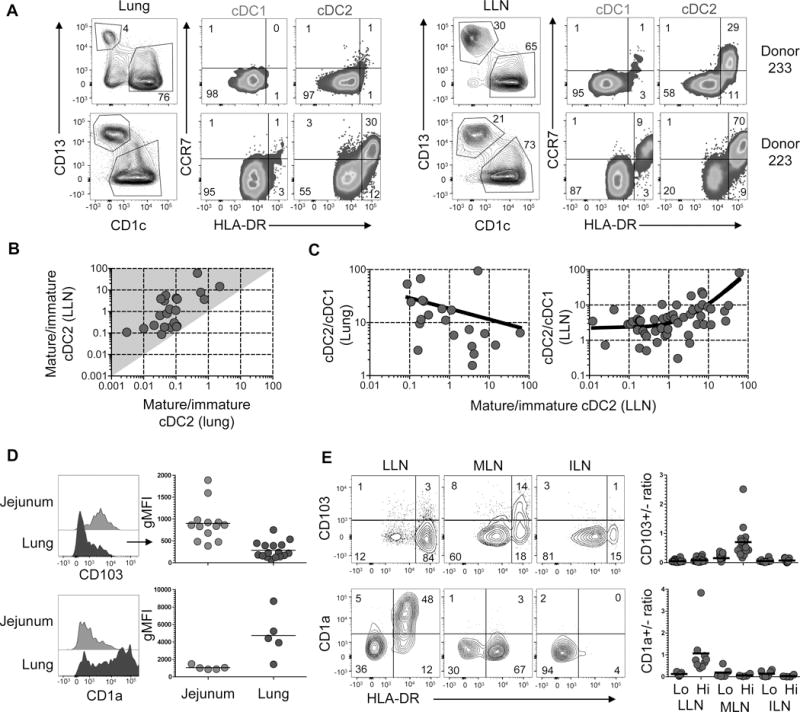
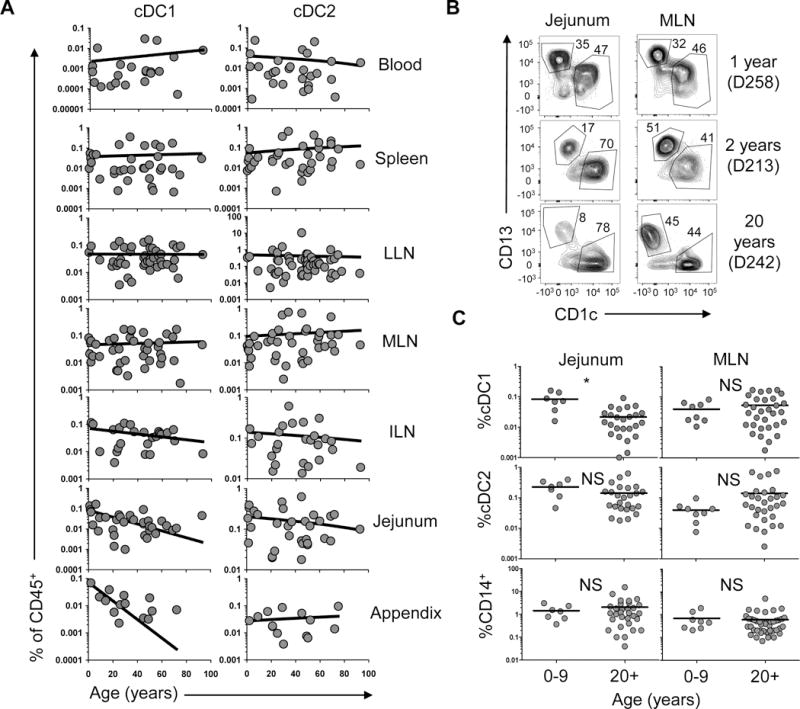
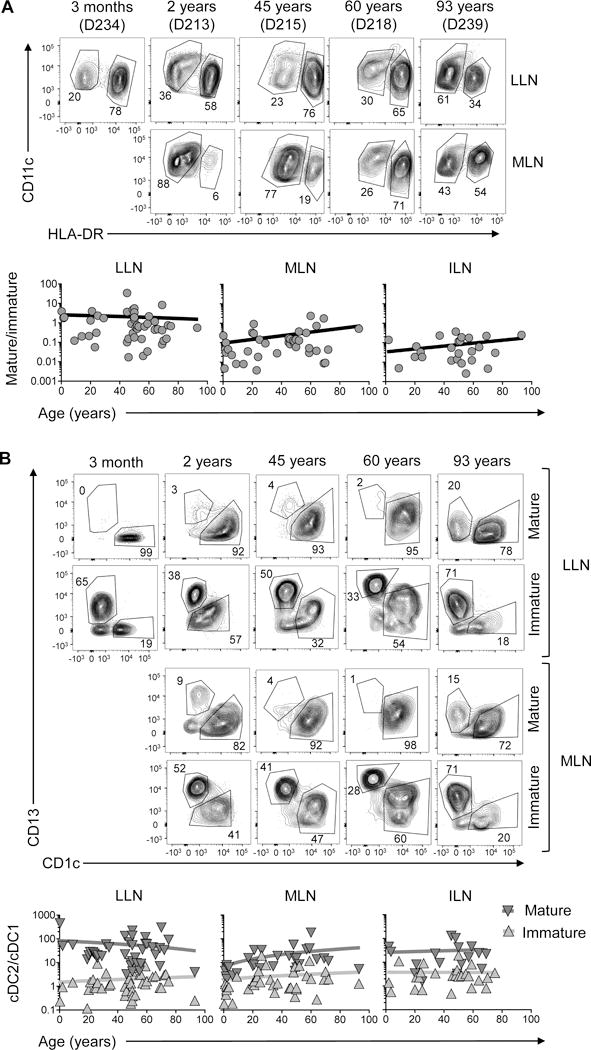
Maturation and migration to lymph nodes (LNs) constitutes a central paradigm in conventional dendritic cell (cDC) biology but remains poorly defined in humans. Using our organ donor tissue resource, we analyzed cDC subset distribution, maturation, and migration in mucosal tissues (lungs, intestines), associated lymph nodes (LNs), and other lymphoid sites from 78 individuals ranging from less than 1 year to 93 years of age. The distribution of cDC1 (CD141hiCD13hi) and cDC2 (Sirp-α+CD1c+) subsets was a function of tissue site and was conserved between donors. We identified cDC2 as the major mature (HLA-DRhi) subset in LNs with the highest frequency in lung-draining LNs. Mature cDC2 in mucosal-draining LNs expressed tissue-specific markers derived from the paired mucosal site, reflecting their tissue-migratory origin. These distribution and maturation patterns were largely maintained throughout life, with site-specific variations. Our findings provide evidence for localized DC tissue surveillance and reveal a lifelong division of labor between DC subsets, with cDC2 functioning as guardians of the mucosa.

Keywords: dendritic cells; human immunology; mucosal immunity; tissue immunity.


Figures

Figure 1
Figure 1. Identification of cDC subsets in diverse human tissue sites
A. Top: Schematic showing the 14 tissue sites obtained for this study. Bld = blood; Spl = spleen; TLN = tracheal LN; LLN = lung LN; PLN = pancreatic LN; ILN = iliac LN; MLN = mesenteric LN; PP = Peyer’s Patches; App = appendix; BM = bone marrow; Col = colon; Ile = ileum; Jej = jejunum, Lng = lung; Bottom: Each of the 78 donors used in this study is designated by an individual symbol with the following characteristics indicated: Gender (filled symbol, male; open symbol, female), race (green, Caucasian/White; red, African American/Black; blue, Hispanic; and orange, Asian), and cause of death (upward triangle, head trauma; downward triangle, stroke; circle, anoxia). Asterisk indicates male donor from which no other information was available. B. Gating strategy for the identification of cDC1 and cDC2 in multiple tissues obtained from human organ donors (left). Cells were initially gated on live (DAPIlo) CD45+ singlets (not shown), then on CD11c+HLA-DR+CD14, lineage (Lin)-neg (Lin = CD3, CD15, CD19, CD20, CD56.) and CD1c+ or CD141+ to identify cDC populations and further subdivided by CD141+CD13+ and CD1c+ to delineate cDC1 and cDC2, respectively. Right: Expression of key cDC markers CD141, CD13, Sirp-α and CD1c, by cDC1 (red) and cDC2 (blue) subsets. Data derive from Donor 233. C. Plots show expression of different markers (y axis) on cDC1 (red), cDC2 (blue) and CD141+ CD1c+ (tan) cells. D. Histograms show expression of CD26 on the subsets designated in C. E. Compiled Clec9a, CD26 and Sirp-α expression by cDC1 and cDC2 delineated as in (B) expressed as geometric mean fluorescence intensity (gMFI) ±SEM from 7–29 donors for each tissue. F. Fluorescence staining of LLN sections from a single donor showing nuclear IRF8 staining on CD13+Clec9A+ cells displaying a DC morphology in the T cell zone (green) (upper image), and nuclear IRF4 staining by CD1c+ cells with a DC morphology (lower right). Shown in lower left is control staining for CD1c expression on CD19+ B cells (Blue) which lack IRF4 expression. Images are shown at 200X magnification. Scale bar: 20 μm.
Figure 2
Figure 2. Tissue distribution of monocytic cells and DC subsets in the human body
A. Compiled frequencies (mean ± SEM) of cDC1, cDC2, pDCs and CD14+ cells gated as in Figure 1 and S1, expressed as %CD45+ cells, compiled from 10–50 donors for each tissue site. Secondary lymphoid tissues are shaded in purple, mucosal tissues in tan; blood-rich sites are highlighted in grey. B. Compiled pie charts depict the ratios (mean from each site) of DC subsets and monocytes analyzed in 14 different tissues, with the perimeter of the circle denoting each tissue grouping: blood-rich tissues (grey arc), secondary lymphoid tissues (purple arc), and mucosal tissues (tan arc). The proportions of each subset are denoted by different colors: CD14+ monocytes (green), pDCs (orange), and cDCs (dark blue) which are further subdivided into cDC2 (light blue) and cDC1 (red). C. Graphical representation of cDC distribution plotted as cDC1 frequency (%CD45+ cells, y axis) versus cDC2/cDC1 ratio (x axis) for each tissue. Five tissue groupings are delineated by shaded circles into circulatory, lymphoid tissue (subdivided into peripheral lymphoid sites and gut-associated lymphoid tissues (GALT, appendix and Peyer’s Patch), mucosal tissues and lung and lung-draining LN (see text).
Figure 3
Figure 3. Subset and regional differences in cDC maturation in secondary lymphoid organs
A. HLA-DR expression (gMFI± SEM) on cDC1 and cDC2 from 14 different tissues compiled from 10–30 donors per tissue. B. Top: Differential HLA-DR expression by LN cDCs delineating immature (HLA-DRlo) and mature (HLA-DRhi) populations. Bottom: cDC subset delineation of immature (tan) versus mature (teal blue) populations. Representative data from Donor 223. C. Ratio of mature to immature cDCs in spleen and five different LNs with TLN (tracheal LN); LLN (lung LN); PLN (pancreatic LN); MLN (mesenteric LN), ILN (iliac LN). Significance was determined using paired t tests. D. cDC2/cDC1 ratio of immature versus mature cDCs in LNs shown in (C). *p< 0.05, **p<0.01, ***p<0.001.
Figure 4
Figure 4. Differential clustering and density of cDC subsets in lung-draining and mesenteric LNs
A. Visualization of cDC subsets in human LNs from a single representative donor (Donor 250). Fixed human LLN and MLN were stained for CD3(blue), HLA-DR(green), Clec9A(red) and CD1c(white). Images (a and b) show whole LN at 10X magnification with the boxed regions shown below in images c–f at 20X magnification. Green arrows indicate B cell follicles (c and d); red arrows indicate cDC1 and white arrows indicate cDC2 (e and f). Images are representative of at least five different donors. Scale bars: (a and b) 1000 μm; (c and d) 200 μm; (e and f) 100 μm. B. Quantification of cDC2 density in T cell zones of LLN and MLN obtained from 17 donors calculated by dividing the number of cDC2 (using Imaris software) by the T cell zone area, defined using ImageJ software (see methods). *P<0.05, as calculated by a paired t test.
Figure 5
Figure 5. LN mature cDCs display characteristics of tissue migratory cells
A. HLA-DR and CCR7 expression by lung (left panels) and LLN (right panels) cDC1 and cDC2 of two donors (233 and 223). B. Graph shows the ratio of mature:immature cDC2 in the LLN plotted versus the ratio of mature:immature cDC in the lung compiled from 20 donors. Shaded area (grey) delineates region of greater maturation in the LLN compared to the lung. C. Graphs show ratios of cDC2:cDC1 in the lung (left) and LLN (right) as a function of LLN cDC2 mature:immature ratios compiled from 20 (left) and 53 (right) donors. D. CD103 and CD1a expression by cDC2 in the jejunum (light blue) and lung (dark blue) shown in representative flow cytometry plots (left) and compiled gMFI from 5–16 donors (right). E. CD103 and CD1a expression by HLA-DRlo and HLA-DRhi cDC2 in three different LNs shown in representative flow cytometry plots (left) from individual donors (Donor 215, top; Donor 297, bottom) and compiled results calculating the ratio of CD103+/CD103 (top) or CD1a+/CD1a (bottom) cDC2 from 4–22 donors (right). Lung sections were taken from the lateral basal region for each donor. *p< 0.05, **p<0.01, ***p<0.001.
Figure 6
Figure 6. cDC subset frequency in tissues over the human lifespan
A. Graphs show compiled frequencies of cDC1 (left) and cDC2 (right) subsets (% CD45+ cells) in blood and seven different tissues as a function of age. Line shows linear regression. B. Representative flow cytometry plots showing cDC1 and cDC2 in the jejunum and MLN of two pediatric and one young adult donor as indicated. C. Compiled frequencies of cDC1, cDC2 and CD14+ cells from jejunal and MLN samples of 7–8 children and 25–31 adults.
Figure 7
Figure 7. cDC2 maturation dominance emerges at infancy and is retained over life
A. Top: representative flow cytometry plots show frequency of mature (HLA-DRhi) and immature (HLA-DRlo) CD11c+ cDCs in LLN and MLN of individual donors from 3 months to 93 years of age. Bottom: Graphs show ratio of mature:immature cDCs in LNs plotted as a function of age with line indicating linear regression. B. Top: representative flow cytometry plots show frequency of cDC1 and cDC2 in the mature and immature cDC fraction in the LLN and MLN of individual donors of indicated ages. Bottom: Ratio of cDC2:cDC1 in the mature and immature compartments of different LNs plotted as a function of age with line indicating linear regression. *p<0.05.

Comment in

References

    1. Aliberti J, Schulz O, Pennington DJ, Tsujimura H, Sousa CRE, Ozato K, Sher A. Essential role for ICSBP in the in vivo development of murine CD8 alpha(+) dendritic cells. Blood. 2003;101:305–310. - PubMed
    1. Allan RS, Smith CM, Belz GT, van Lint AL, Wakim LM, Heath WR, Carbone FR. Epidermal viral immunity induced by CD8alpha+ dendritic cells but not by Langerhans cells. Science. 2003;301:1925–1928. - PubMed
    1. Bachem A, Guttler S, Hartung E, Ebstein F, Schaefer M, Tannert A, Salama A, Movassaghi K, Opitz C, Mages HW, et al. Superior antigen cross-presentation and XCR1 expression define human CD11c+CD141+ cells as homologues of mouse CD8+ dendritic cells. J Exp Med. 2010;207:1273–1281. - PMC - PubMed
    1. Bajana S, Turner S, Paul J, Ainsua-Enrich E, Kovats S. IRF4 and IRF8 Act in CD11c(+) Cells To Regulate Terminal Differentiation of Lung Tissue Dendritic Cells. Journal of Immunology. 2016;196:1666–1677. - PMC - PubMed
    1. Banchereau J, Steinman RM. Dendritic cells and the control of immunity. Nature. 1998;392:245–252. - PubMed

Publication types