. 2017 Mar 30;543(7647):681-686.
doi: 10.1038/nature21408. Epub 2017 Mar 22.

LACTB is a tumour suppressor that modulates lipid metabolism and cell state

Affiliations

LACTB is a tumour suppressor that modulates lipid metabolism and cell state

Zuzana Keckesova et al. Nature. .

Abstract

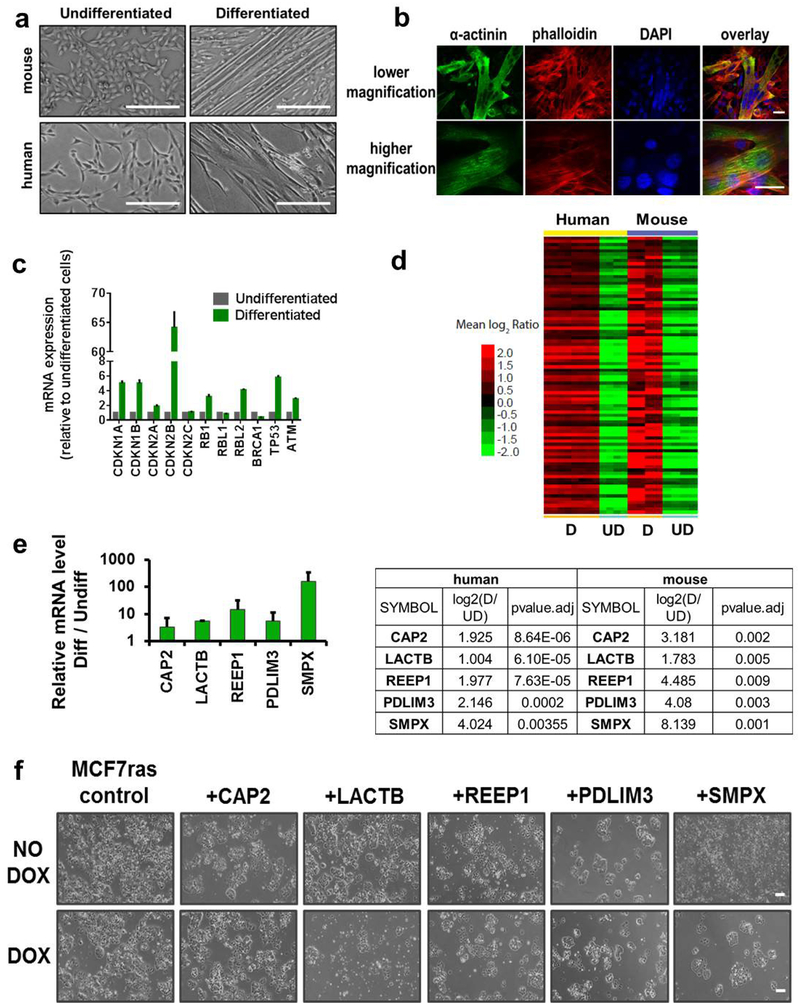
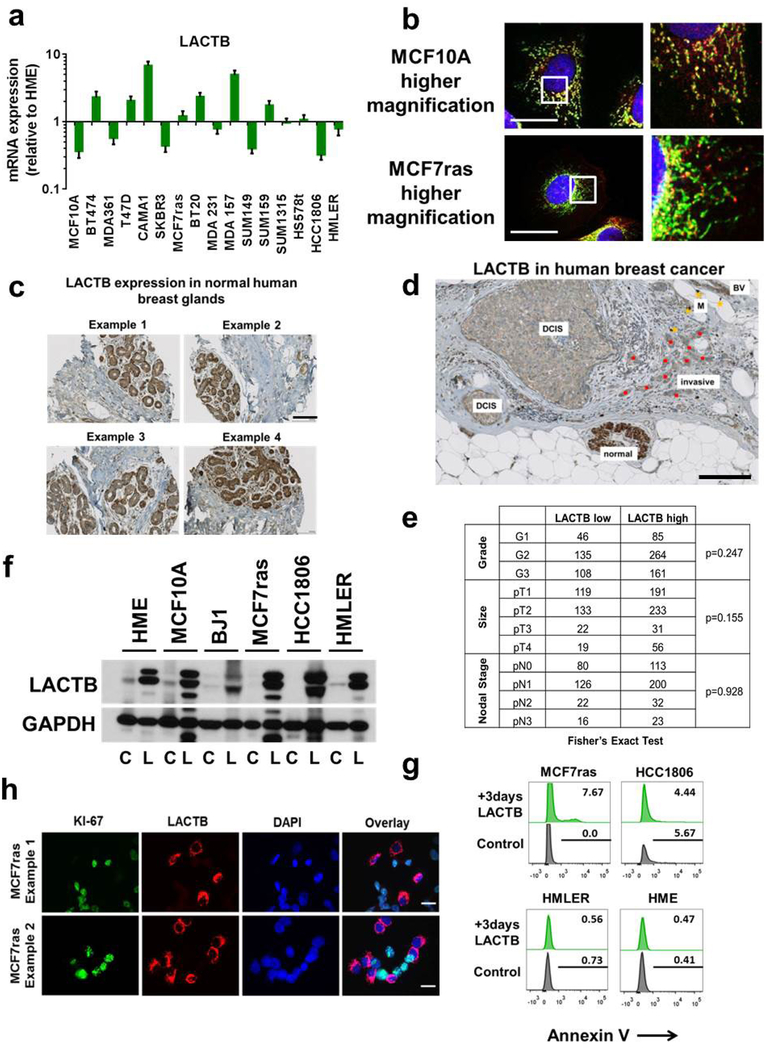
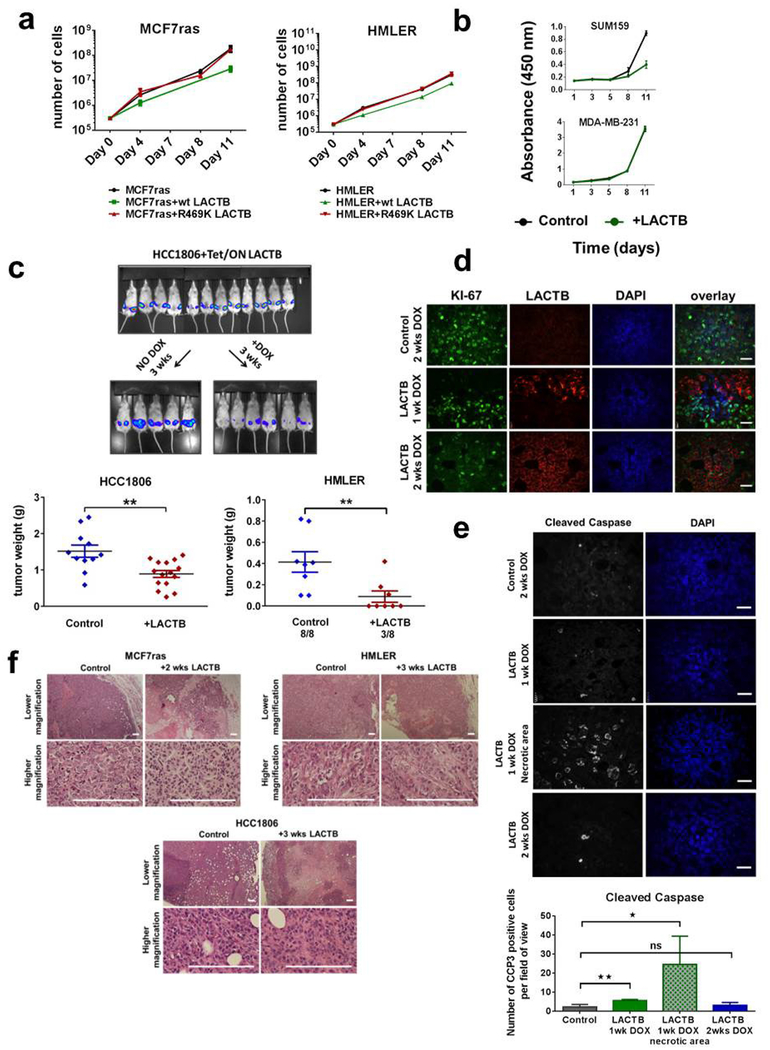
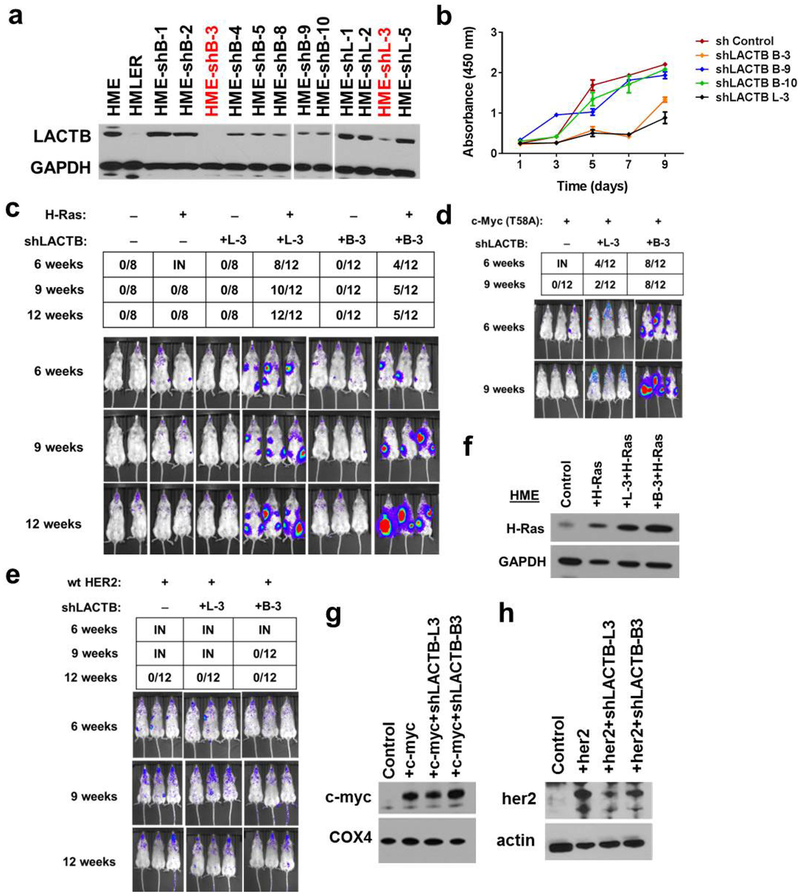
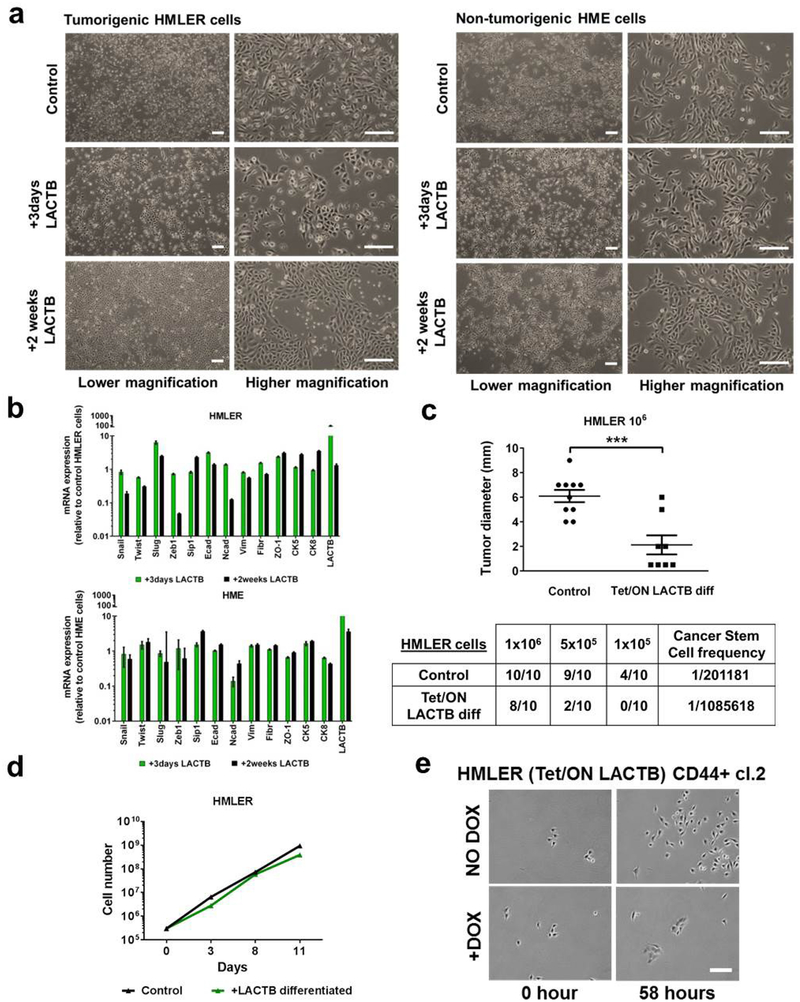
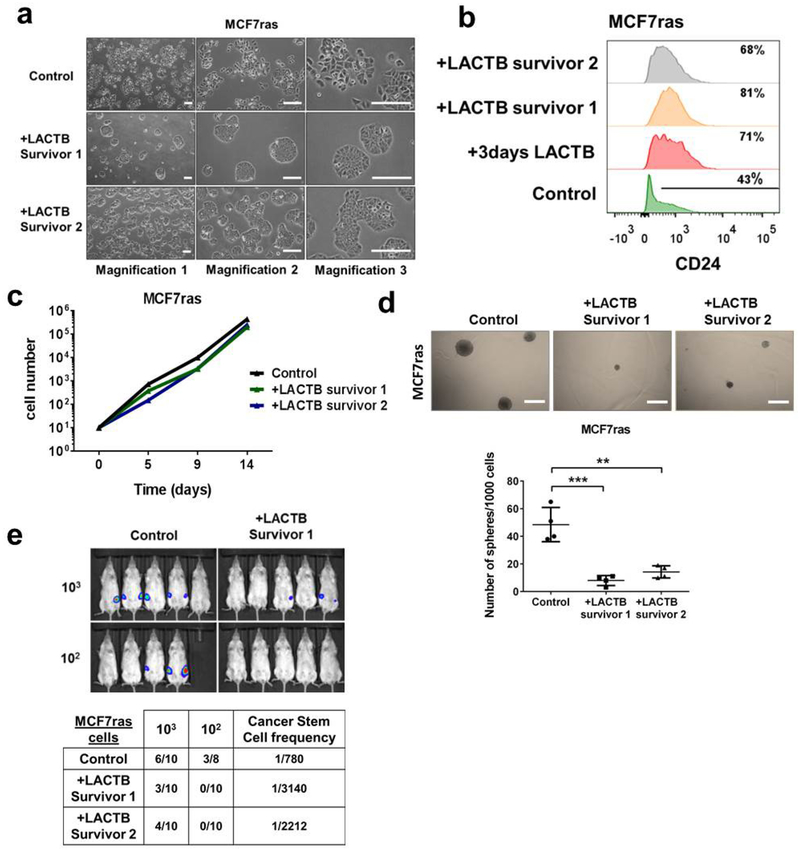
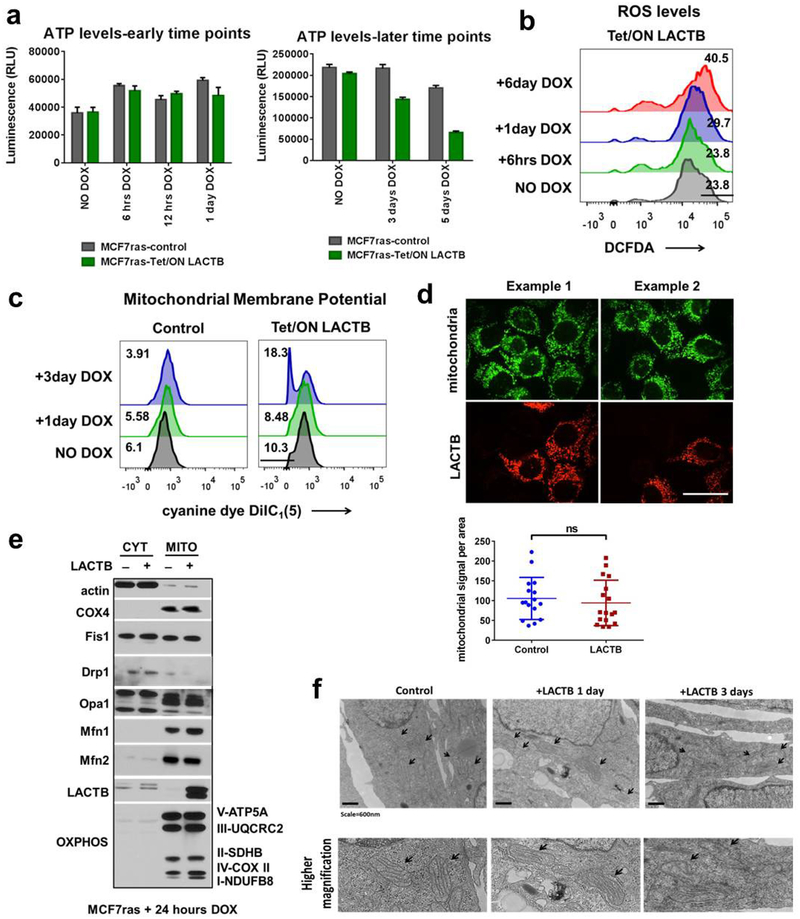
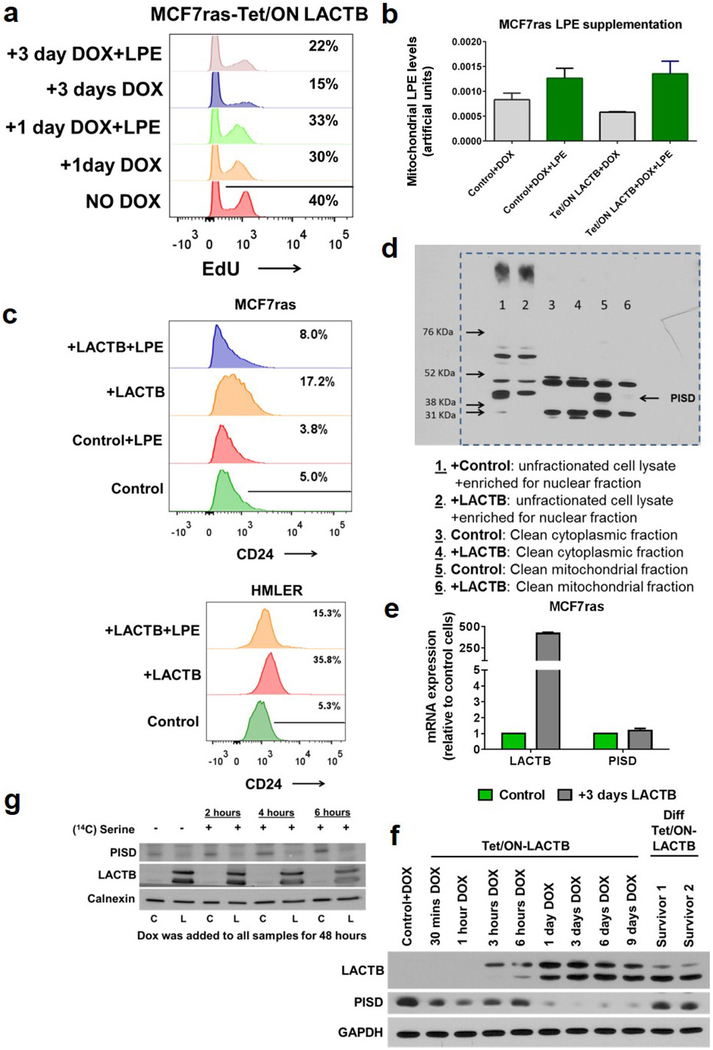
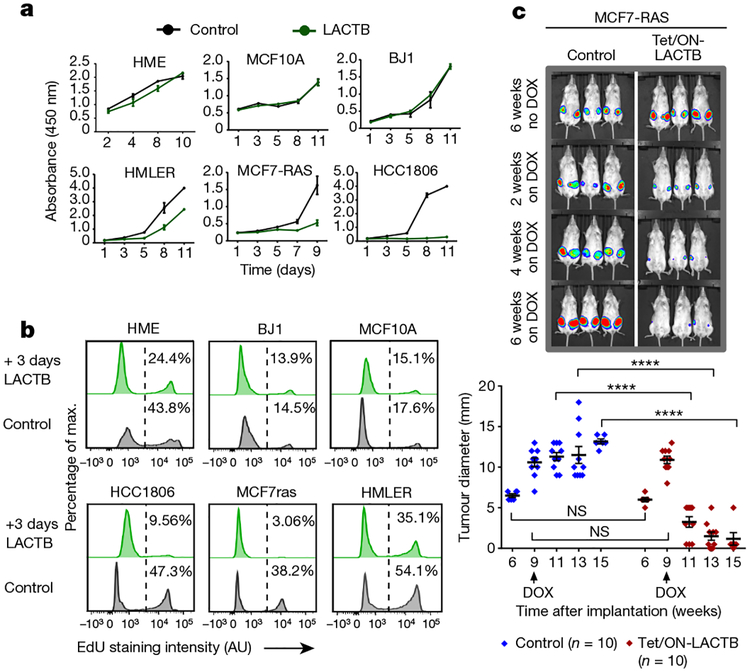
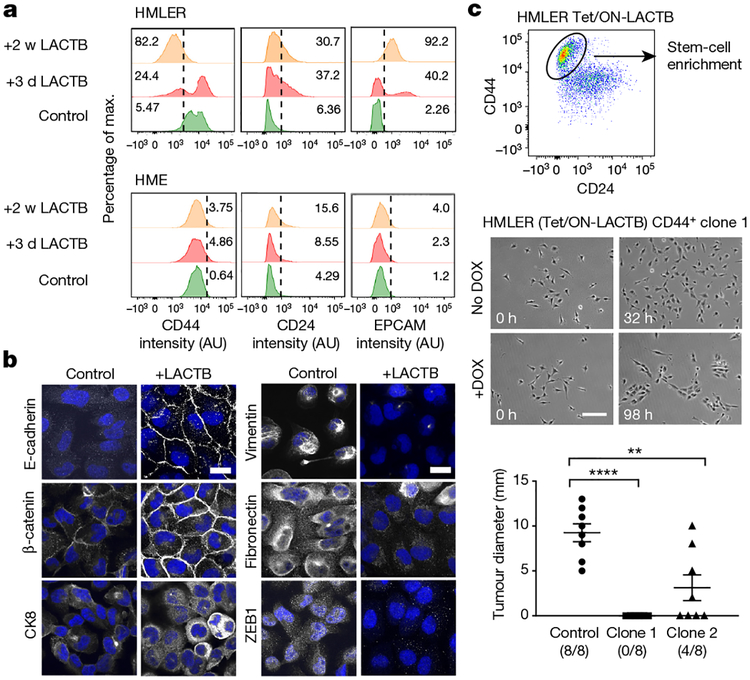
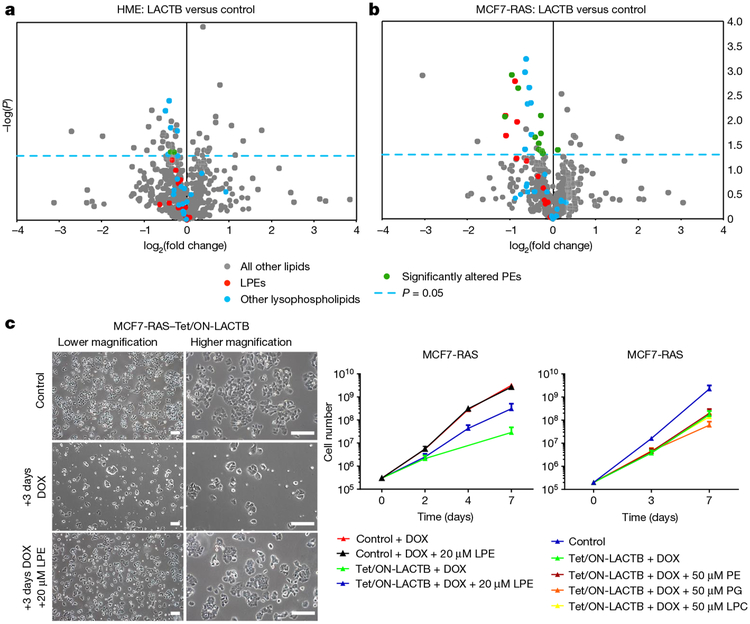
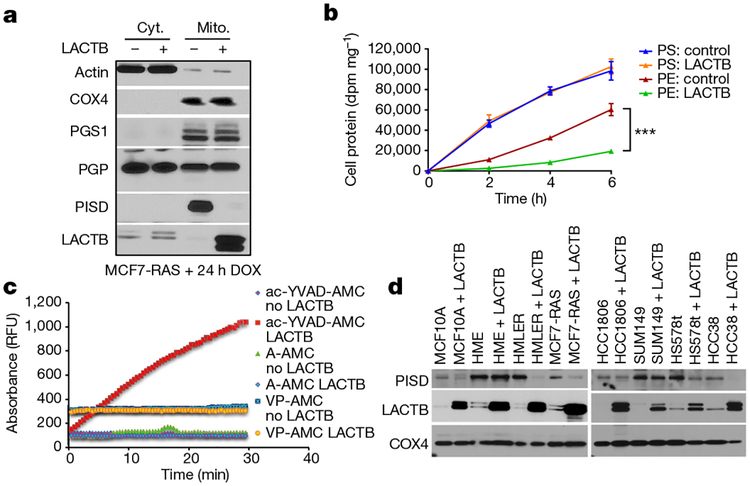
Post-mitotic, differentiated cells exhibit a variety of characteristics that contrast with those of actively growing neoplastic cells, such as the expression of cell-cycle inhibitors and differentiation factors. We hypothesized that the gene expression profiles of these differentiated cells could reveal the identities of genes that may function as tumour suppressors. Here we show, using in vitro and in vivo studies in mice and humans, that the mitochondrial protein LACTB potently inhibits the proliferation of breast cancer cells. Its mechanism of action involves alteration of mitochondrial lipid metabolism and differentiation of breast cancer cells. This is achieved, at least in part, through reduction of the levels of mitochondrial phosphatidylserine decarboxylase, which is involved in the synthesis of mitochondrial phosphatidylethanolamine. These observations uncover a novel mitochondrial tumour suppressor and demonstrate a connection between mitochondrial lipid metabolism and the differentiation program of breast cancer cells, thereby revealing a previously undescribed mechanism of tumour suppression.


Figures

Extended Data Figure 1 |
Extended Data Figure 1 |. Identification of potential tumour suppressors.
a, Light-microscopy images of undifferentiated and differentiated human muscle progenitor cells and mouse C2C12 muscle progenitor cells. Scale bars, 200 μm. b, Immunofluorescence analysis of mouse C2C12 cells undergoing differentiation. Cells were stained with the marker of skeletal muscle differentiation α-actinin (green), the actin-staining agent phalloidin (red) and DAPI (blue). Scale bars, 30 μm. c, Qrt–PCR analysis of expression levels of several known tumour suppressors and cell-cycle inhibitors in differentiated human skeletal muscle cells confirming that these cells abundantly expressed a variety of tumour suppressors. All the values are relative to undifferentiated cells. GAPDH expression was used as a normalization control. Experiment was performed in duplicate. d, Microarray analysis of undifferentiated (UD) and differentiated (D) skeletal muscle cells of human and mouse origin (87 genes, P < 0.01, fold change >2). e, qRT–PCR analysis of mRNA levels of five candidate genes. Values are relative to undifferentiated human skeletal muscle progenitor cells. GAPDH expression was used as a normalization control. Experiment was performed in duplicate. f, Light-microscopy images of MCF7-RAS cells transduced with five DOX-inducible factors in the absence or presence of DOX. Images were taken after 12 days of DOX treatment in all groups except for the LACTB cells which were treated for 6 days with DOX. Scale bars, 200 μm. Data are mean ± s.e.m. (c, e).
Extended Data Figure 2 |
Extended Data Figure 2 |. LACTB expression in normal and neoplastic cells.
a, qRT–PCR analysis of endogenous LACTB mRNA levels in non-tumorigenic (HME, MCF10A) and neoplastic breast cell lines. All values are relative to those in the non-tumorigenic HME cells. GAPDH expression was used as a normalization control. Experiment was performed in duplicate. Data are mean ± s.e.m. b, Immunofluorescence staining of LACTB in non-tumorigenic (MCF10A) and tumorigenic (MCF7-RAS) cell lines. Cells were stained with a mitochondrial marker (green), a LACTB marker (red) and DAPI (blue). See Supplementary Table 5 for details on antibodies. The experiment was performed in triplicate. c, Immunohistochemistry of LACTB protein levels (brown) in normal human mammary glands. d, Immunohistochemistry of endogenous LACTB expression levels (brown) in human breast cancer tissue sections. Shown is the amount of LACTB in a normal mammary gland and in the adjacent neoplastic mammary gland. BV, blood vessel; DCIS, ductal carcinoma in situ; invasive, invasive carcinoma (red dots), M, macrophages (yellow dots). e, Stratification of low and high levels of LACTB in human breast cancer clinical samples of different grade, size and nodal stage. f, Immunoblotting of exogenous LACTB protein in control cells (C) and cells in which LACTB was induced by DOX for 2 days (L). g, Annexin-V staining in non-tumorigenic (HME) and tumorigenic (HMLER, MCF7-RAS, HCC1806) cell lines upon LACTB induction. Numbers within the graphs represent percentages of gated cells. h, Immunofluorescence analysis of control MCF7-RAS cells mixed with MCF7-RAS–Tet/ON-LACTB cells, in which LACTB was induced for 3 days. Proliferation marker Ki-67 (green), LACTB (red) and DAPI (blue). Note the mutually exclusive Ki-67 and LACTB staining in these cells. Scale bars, 30 μm (b, h) and 100 μm (c, d).
Extended Data Figure 3 |
Extended Data Figure 3 |. LACTB-induced effects on proliferation of breast cancer cells.
a, Proliferation curves of MCF7-RAS and HMLER cells that overexpressed wild-type (WT) LACTB and LACTB(R469K). b, Proliferation curves of SUM159 and MDA-MB-231 cells upon LACTB induction. c, Tet/ON-LACTB cells were injected (105 cells per injection for HCC1806 cells and 106 cells per injection for HMLER cells) into fat pads of female NOD/SCID mice. HCC1806 control tumours (n = 11), HCC1806 + LACTB tumours (n = 15). When the tumours reached approximately 5 mm in diameter, mice were randomly divided into two groups and DOX was added to one group. In vivo whole-mouse images are shown for HCC1806 tumours. Tumour weight and number of resulting tumours was measured at 3 weeks of DOX treatment. **P <0.01. d, Immunofluorescence analysis of tissue sections of control (MCF7-RAS) and MCF7-RAS–Tet/ON-LACTB tumours with 1 week (MCF7-RAS–Tet/ON-LACTB) or two weeks (control and MCF7-RAS–Tet/ON-LACTB) of DOX treatment. Tissues were stained for the cell-proliferation marker Ki-67 (green), LACTB (red) and with DAPI (blue). Note the mutually exclusive effects of LACTB induction on Ki-67 staining in the middle panel. Scale bars, 30 μm. e, Immunofluorescence analysis of tissue sections of MCF7-RAS and MCF7-RAS–Tet/ON-LACTB tumours in which DOX was added to both groups for 1 or 2 weeks. Tissues were stained with antibodies against a marker of apoptosis (cleaved caspase, white) and with DAPI (blue). Staining was quantified in 8–15 images for each group. *P > 0.05, **P < 0.01; NS, not significant. Scale bars, 30 μm. f, Haematoxylin and eosin staining of MCF7-RAS, HCC1806, and HMLER tumours without or with 2 or 3 weeks of in vivo LACTB induction. Scale bars, 200 μm. Data are mean ± s.e.m. (a–c, e).
Extended Data Figure 4 |
Extended Data Figure 4 |. Collaboration between downregulated LACTB and oncogene expression in cellular transformation.
a, Immunoblotting of endogenous LACTB protein in HME cells transduced with different shRNA vectors directed against LACTB. Non-tumorigenic HME cells are included as a positive control and tumorigenic HMLER cells as a negative control for LACTB expression. Highlighted in red are the two LACTB shRNAs chosen for further study. b, Proliferation rates of HME cells transduced with different LACTB shRNAs. Data are mean ± s.e.m. c-e, Tumour incidence was monitored, by in vivo imaging, in non-tumorigenic HME cells and in HME cells transduced with shLACTB vectors (L-3 or B-3) with or without concominant expression of HRASG12V (c), MYCT58A (d) or the wild-type human HER2 oncogene (e). Mice were monitored at 6, 9 and 12 weeks after injection. IN, small indolent tumours that spontaneously regressed. f, g, h, Western blot analyses of RAS, MYC and wild-type HER2 expression levels in HME-derived cell lines compared to control HME cells.
Extended Data Figure 5 |
Extended Data Figure 5 |. LACTB-induced effects on HMLER differentiation.
a, Light-microscopy images of HMLER and HME cells upon LACTB induction. Scale bars, 200 μm. b, qRT–PCR analysis of relative mRNA levels of mesenchymal, stem-cell and epithelial markers in tumorigenic HMLER and non-tumorigenic HME cells upon LACTB induction. All values are relative to control HMLER or HME cells in which LACTB was not induced. GAPDH expression was used as a normalization control. c, Frequency of cancer stem cells in control HMLER cells and in differentiated HMLER cells where LACTB was induced in vitro for two weeks. Cells were injected at limiting dilutions (1 × 10⁶, 5 × 10⁵, 1 × 10⁵) into fat pads of female NOD/SCID mice. Mice were euthanized 8 weeks after injection and tumour frequency and tumour diameter were calculated and measured. Diameters of tumours arising from the group injected with 1 × 10⁶ cells are shown. ***P<0.001. d, Proliferation curves of control HMLER cells and differentiated HMLER cells. e, Time-lapse images of HMLER–Tet/ON-LACTB CD44highCD24low single-cell clone 2 with (+DOX) or without (no DOX) LACTB induction. Scale bar, 200 μm. Videos of clones 1 and 2 can be found in the Supplementary Information. Data are mean ± s.e.m. (b, c).
Extended Data Figure 6 |
Extended Data Figure 6 |. LACTB-induced effects on MCF7-RAS differentiation.
a, Light-microscopy images of control MCF7-RAS cells and two independently derived MCF7-RAS bulk populations that survived for 2 weeks with LACTB treatment and re-entered the proliferation cycle (LACTB survivor 1 and 2). LACTB survivor cells displayed more epithelial-like, differentiated morphology, characterized by tight cobblestone epithelial features. Scale bars, 200 μm. b, Flow cytometry analysis of levels of the epithelial differentiation marker (CD24) in control MCF7-RAS cells, MCF7-RAS cells in which LACTB was induced for 3 days and two independently derived MCF7-RAS bulk populations that survived for 2 weeks after LACTB treatment and re-entered the proliferation cycle (LACTB survivor 1 and 2). c, Proliferation curves of control MCF7-RAS cells and two independently derived MCF7-RAS bulk populations that survived for 2 weeks after LACTB induction and re-entered the proliferation cycle (LACTB survivor 1 and 2). d, Quantification of in vitro tumour sphere formation of control MCF7-RAS cells and two independently derived MCF7-RAS–LACTB survivor populations. Experiment was repeated twice. **P < 0.01; ***P < 0.001. Scale bars, 200 μm; data are mean ± s.e.m. e, In vivo tumorigenicity and cancer stem cell frequency of control MCF7-RAS cells and two independently derived MCF7-RAS–LACTB survivor populations. Cells were injected at limiting dilutions (1 × 10³, 1 × 10²) into fat pads of female NOD/SCID mice and tumour formation was monitored by in vivo imaging 8 weeks after injection.
Extended Data Figure 7 |
Extended Data Figure 7 |. LACTB-induced effects on mitochondrial function.
a, Measurements of ATP levels in MCF7-RAS cells upon LACTB induction. b, Measurements of ROS levels in MCF7-RAS cells upon LACTB induction. Numbers within the graphs represent percentages of gated cells. c, Measurements of mitochondrial membrane potential, through incorporation of the cyanine dye DiIC1(5), by flow cytometry in MCF7-RAS cells upon LACTB induction. Numbers within the graphs represent percentages of gated cells. d, Immunofluorescence analysis of control MCF7-RAS cells mixed with MCF7-RAS–Tet/ON-LACTB cells, where LACTB was induced by addition of DOX for 1 day. Cells were stained with a mitochondrial marker (green), a LACTB marker (red) and DAPI (blue). Mitochondrial signal per area in control cells (n = 16) and in LACTB-expressing cells (n = 17) was calculated using ImageJ software. NS, not significant (P > 0.05). Scale bar 30 μm. e, Western blot analysis of sub-fractionated control MCF7-RAS cells and MCF7-RAS–Tet/ON-LACTB-expressing cells with 24 h of DOX treatment. CYT, cytosolic fraction, MITO, mitochondrial fraction. Membranes were probed for proteins involved in mitochondrial fusion (OPA1, MFN1, MFN2), fission (FISI, DRP1), composition of respiratory chain (individual OXPHOS components) and control antibodies: LACTB (to show the proper induction and localization of LACTB), actin (cytosolic marker) and COX4 (mitochondrial marker). The membrane presented here was also used in Fig. 5a, where it was probed with a different set of antibodies. Therefore the signal for the control antibodies is shared between these two figures. f, Electron microscopy images of mitochondria in control MCF7-RAS cells or MCF7-RAS cells where LACTB was induced for 1 or 3 days. Arrows indicate mitochondria. Scale bars, 600 nm. Data are mean ± s.e.m. (a, d).
Extended Data Figure 8 |
Extended Data Figure 8 |. The role of PISD in LACTB mechanism.
a, Measurement of DNA synthesis (through EdU incorporation) in MCF7-RAS–Tet/ON-LACTB cells upon LACTB induction with or without supplementation of growth medium with 20 μM LPE. b, LC–MS/MS analysis of mitochondrial LPE levels upon supplementation of MCF7-RAS cells with 20 μM LPE for 24 h. c, Expression levels of the differentiation marker CD24 in MCF7-RAS and HMLER cells upon LACTB induction for 6 and 9 days, respectively, with or without supplementation of growth medium with 20 μM LPE. d, Raw western blot image showing PISD subcellular location and levels in sub-fractionated MCF7-RAS and MCF7-RAS–Tet/ON-LACTB cells (related to Fig. 5a). DOX was added to both cell lines for 24 h. e, qRT–PCR analysis of mRNA levels of LACTB and PISD in control MCF7-RAS cells and MCF7-RAS cells in which LACTB was induced for 3 days. GAPDH expression was used as a normalization control. f, Time-course analysis of levels of LACTB and PISD in control MCF7-RAS and MCF7-RAS–Tet/ON-LACTB cells in which LACTB was induced by addition of DOX for the indicated times. In control MCF7-RAS cells DOX was added for 3 days. Also shown are the PISD and LACTB levels in MCF7-RAS–Tet/ON-LACTB differentiated survivor cell populations 1 and 2 where DOX was added for 24 h. g, Related to Fig. 5b. MCF7-RAS cells (C) and MCF7-RAS–Tet/ON-LACTB cells (L) were incubated with DOX for 48 h. [3H]serine-containing medium was then added for 2, 4 or 6 h. A portion of cell lysate was analysed by immunoblotting to confirm expression of LACTB, downregulation of PISD and equal protein levels in the samples (by calnexin). Data are mean ±s.e.m. (b, e).
Extended Data Figure 9 |
Extended Data Figure 9 |. The role of PISD in LACTB mechanism.
a, Western blot analysis of control MCF7-RAS cells and MCF7-RAS cells transfected for 48 h with four different PISD siRNAs. b, The proliferation ability of MCF7-RAS cells transfected with different PISD siRNAs was measured by EdU staining using fluorescence-activated cell sorting. c, Control MCF7-RAS and MCF7-RAS–Tet/ON-LACTB cells were treated with DOX for two days with or without concominant transfection with four different PISD siRNAs. The proliferation ability of the cells was measured by EdU staining using fluorescence-activated cell sorting. The rectangle represents the gate containing proliferative cells. d, LACTB and PISD protein levels in mitochondrial fractions of control MCF7-RAS cells and MCF7-RAS cells with one day of wild-type LACTB or LACTB(R469K) induction. e, LC–MS/MS analysis of mitochondrial PE and LPE species (that were shown to be downregulated upon wild-type LACTB induction) in control MCF7-RAS cells and MCF7-RAS cells where the LACTBR469K mutant was induced for 24 h. Values are shown in Supplementary Table 2. f, Proliferation curves of HMLER and HCC1806 cells upon addition of 0.05 μg ml−1 DOX. g, LACTB and PISD levels in non-tumorigenic HME and tumorigenic HMLER and HCC1806 cells upon addition of 0.05 μg ml−1 DOX. h, LC–MS/MS analysis of mitochondrial PE, LPE and cardiolipin (CL) species in control HMLER cells and HMLER cells where lower levels of LACTB were induced, by addition of 05 μg ml−1 DOX for 24 h. Values are shown in Supplementary Table 2. i, Fluorescence-activated cell sorting analysis of CD44 levels in HMLER and HMLER-Tet/ON-LACTB upon addition of 0.05 μg ml−1 DOX for 14 days.
Extended Data Figure 10 |
Extended Data Figure 10 |. LACTB mutagenesis.
a, Related to Fig. 5c. Velocity of the ac-YVAD-AMC enzymatic reaction in relation to substrate concentration for wild-type LACTB and mutant LACTB(R469K). b, Comparison of amino acid sequence of wild-type (WT) LACTB, LACTB(S164I) (catalytic site LACTB mutant, where an essential serine residue was replaced by an isoleucine, labelled in image as dS LACTB) and LACTB(Δ1−97) (mitochondrial localization mutant, labelled in the image as d1–97LACTB. as described in ref. 8). Only a partial sequence of LACTB is shown. The points of the mutation of LACTB(S164I) and LACTB(Δ1–97) are highlighted in red and marked by a red star symbol. The blue star symbol marks the site of the R469K mutation in endogenous LACTB from MCF7-RAS and SUM159 cells. The green star symbol marks the site of a notable substrate docking site in LACTB. c, Immunofluorescence analysis of MCF7-RAS–Tet/ON-LACTB(S164I) and MCF7-RAS–Tet/ON-LACTB(Δ1−97) cells, where DOX was added for 24 h. Cells were stained with mitochondrial marker (green), a LACTB marker (red) and DAPI (blue). Scale bars, 30 μm. d, Western blot analysis of expression levels of LACTB in control MCF7-RAS cells and MCF7-RAS–Tet/ON-LACTB (wild-type LACTB, LACTB(S164I), LACTB(Δ1−97), LACTB(ΔSISK)) cells where DOX was added for 24 h. The LACTB(ΔSISK) mutant contains a deletion of 4 amino acid residues in catalytic site of LACTB. The expression level of this mutant was unstable, therefore we did not include this mutant in our study. e, Proliferation rates of control MCF7-RAS cells and MCF7-RAS–Tet/ON-LACTB (wild-type LACTB, LACTB(S164I), LACTB(Δ1−97)) cells upon addition of DOX for the indicated number of days. Pictures were taken at six days of DOX induction. Scale bars, 200 μm. f, Western blot analysis of PISD expression in mitochondria isolated from MCF7-RAS and MCF7-RAS–Tet/ON-LACTB (wild-type LACTB and LACTB(S164I)) cells where DOX was added for 24 h to all groups. g, Western blot analysis of PISD levels after in vitro incubation of permeabilized mitochondria (isolated from MCF7-RAS cells) with or without addition of recombinant LACTB (isolated from HEK293T cells). h, Graphical abstract. LACTB induction leads to a change in cancer cell state. As such, a proliferative, less differentiated cancer cell turns into a non-tumorigenic differentiated cancer cell upon LACTB induction. This is characterized by an initial disappearance of the proliferation marker Ki-67, followed by downregulation of the stem-cell marker CD44 and increased expression of the differentiated epithelial markers CD24 and EPCAM. This is achieved through the ability of LACTB to decrease the protein expression levels of the mitochondrial enzyme PISD and subsequent changes in mitochondrial PE and/or LPE levels.
Figure 1 |
Figure 1 |. LACTB downregulation in cancer cells.
a, Western blot of endogenous LACTB protein levels in a panel of non-tumorigenic and breast cancer cell lines. Note that LACTB is substantially decreased in many breast cancer cell lines, but it is never completely absent. Some LACTB is still present upon overexposure of the western blot membrane. NT, non-tumorigenic cells, BC-L, breast cancer luminal cells, BC-B, breast cancer basal cells. Diff. myotubes, differentiated myotubes; HUVEC, human umbilical vein endothelial cells. b, Representative immunohistochemistry images of endogenous LACTB protein levels (brown) in a panel of 714 clinically defined human breast cancer samples. Scores 2 and 3 represent LACTB staining that was considered normal (not downregulated), whereas scores 0 and 1 represent LACTB staining that was considered downregulated. Luminal A (n = 329), luminal B HER2 (luminal B, HER2-negative) (n = 197), luminal B HER2+ (luminal B, HER2-positive) (n = 60), HER2+ (non-luminal, HER2-positive) (n = 37), triple-negative ductal (n = 91) cancer. Scale bar, 50 μm.
Figure 2 |
Figure 2 |. LACTB-induced effects on proliferation of breast cancer cells.
a, Growth of cells upon LACTB induction. Absorbance is shown in arbitrary units. Three independent experiments were performed. b, DNA synthesis in non-tumorigenic and tumorigenic cell lines upon LACTB induction. Numbers within the graphs represent percentages of gated cells, the dashed line indicates the gate. AU, arbitrary units. The experiment was repeated twice. c, Tumour growth rate upon LACTB induction monitored in vivo by whole mouse imaging and tumour measurements. DOX, doxycycline treatment for the indicated time. Data are mean ± s.e.m. ****P< 0.0001; NS, not significant (P> 0.05). The experiment was repeated twice.
Figure 3 |
Figure 3 |. LACTB-induced effects on cancer cell differentiation.
a, Flow cytometry analysis of a marker of stem cells (CD44) and markers of epithelial differentiation (CD24, EPCAM) in tumorigenic HMLER and non-tumorigenic HME cells upon LACTB induction. Numbers within the graphs represent percentages of gated cells, the dashed line indicates the gate. b, Immunofluorescence staining of HMLER cells after LACTB induction for two weeks. Epithelial (E-cadherin, β-catenin, cytokeratin 8 (CK8)), mesenchymal (vimentin, fibronectin) and stem-cell (Zeb1) markers are shown in white, DAPI is shown in blue. Scale bars, 30 μm. Representative images of two independent experiments are shown. c, Gating strategy for single-cell clone generation (top). Growth, morphology and tumorigenicity of two single-cell clones after LACTB induction was monitored by live time-lapse imaging (growth and morphology analysis, middle) and orthotopic injections into mice (tumorigenicity analysis, bottom). Time-lapse videos of the growth of clones 1 and 2 can be found in the Supplementary Information. Scale bar, 200 μm. Data are mean ± s.e.m. **P < 0.01; ****P <0.0001.
Figure 4 |
Figure 4 |. LACTB-induced changes in mitochondrial phospholipids.
a, b, LC–MS/MS analysis of mitochondrial lipid content of LACTB- induced (24 h of induction) versus control-treated HME (a) and MCF7-RAS (b) cells. The blue, dashed line indicates a P value of 0.05. Dots above this line are significantly changed by LACTB treatment (P < 0.05). Each dot represents a different lipid type. The experiment was repeated twice. c, Proliferation rates of MCF7-RAS and MCF7-RAS–Tet/ON-LACTB cells in the presence of DOX with or without supplementation with LPE, PE, phosphatidylglycerol (PG), or lysophosphatidylcholine (LPC). Representative images are shown on the left. The experiment was repeated three times. Scale bars, 200 μm. Data are mean ± s.e.m. (c).
Figure 5 |
Figure 5 |. The role of PISD in mechanism of action of LACTB.
a, Western blot analysis of fractionated MCF7-RAS cells and MCF7-RAS–Tet/ON-LACTB-expressing cells after 24 h of DOX treatment. Cyt., cytosolic fraction; Mito., mitochondrial fraction. This membrane was also used in Extended Data Fig. 7e. The signal for the control antibodies is shared between these both Figures. b, Conversion of PS to PE in MCF7-RAS and MCF7-RAS–Tet/ON-LACTB cells treated with DOX for 48 h. The experiment was performed in triplicate. Data are mean ± s.e.m. ***P< 0.001. c, Fluorescent absorbance monitored over time as a measurement of active peptidase activity of LACTB. RFU, relative fluorescence units. d, Western blot analysis of PISD levels in mitochondria isolated from a panel of control and Tet/ON-LACTB non-tumorigenic (HME and MCF10A) and tumorigenic cell lines (all others) after addition of DOX for 24 h.

Comment in

References

    1. Seely S Possible reasons for the high resistance of muscle to cancer. Med. Hypotheses 6, 133–137 (1980). - PubMed
    1. Walsh K & Perlman H Cell cycle exit upon myogenic differentiation. Curr. Opin. Genet. Dev 7, 597–602 (1997). - PubMed
    1. Lassar AB, Skapek SX & Novitch B Regulatory mechanisms that coordinate skeletal muscle differentiation and cell cycle withdrawal. Curr. Opin. Cell Biol 6, 788–794 (1994). - PubMed
    1. Kasid A, Lippman ME, Papageorge AG, Lowy DR & Gelmann E P Transfection of v-rasH DNA into MCF-7 human breast cancer cells bypasses dependence on estrogen for tumorigenicity. Science 228, 725–728 (1985). - PubMed
    1. Smith TS et al. Identification, genomic organization, and mRNA expression of LACTB, encoding a serine β-lactamase-like protein with an amino-terminal transmembrane domain. Genomics 78, 12–14 (2001). - PubMed

Publication types

MeSH terms