. 2017 Mar 30;543(7647):714-718.
doi: 10.1038/nature21703. Epub 2017 Mar 22.

Somatic mutations reveal asymmetric cellular dynamics in the early human embryo

Affiliations

Somatic mutations reveal asymmetric cellular dynamics in the early human embryo

Young Seok Ju et al. Nature. .

Abstract

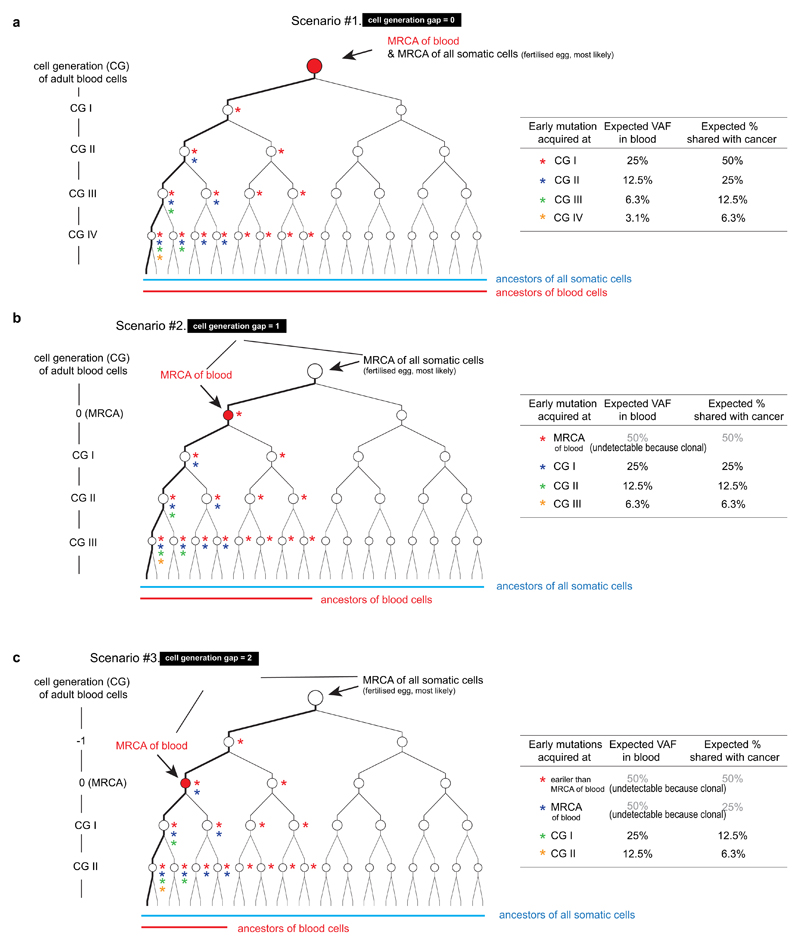
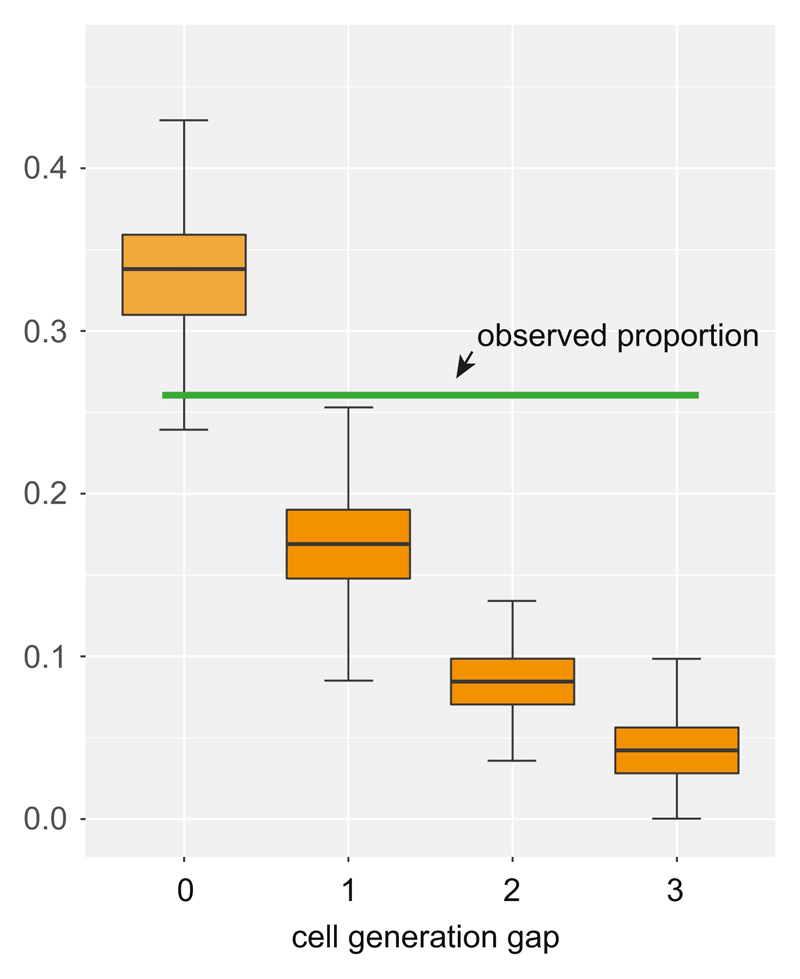
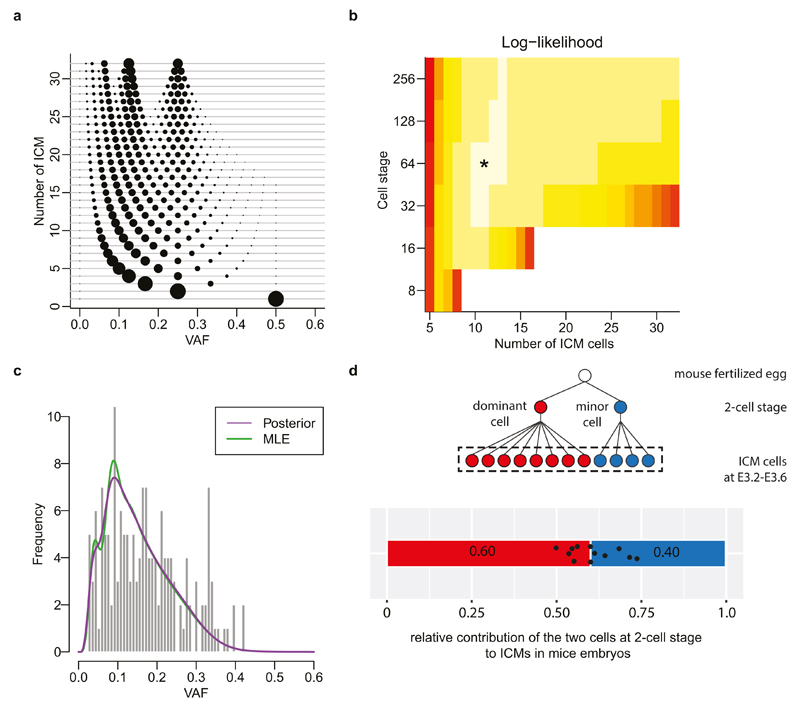
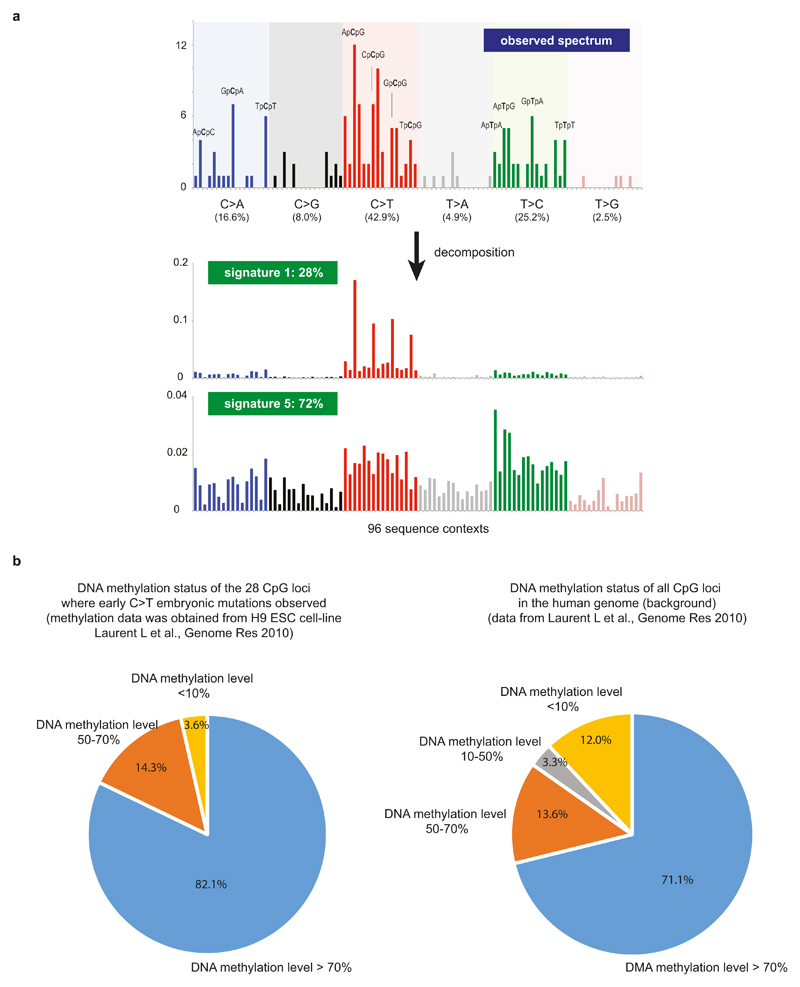
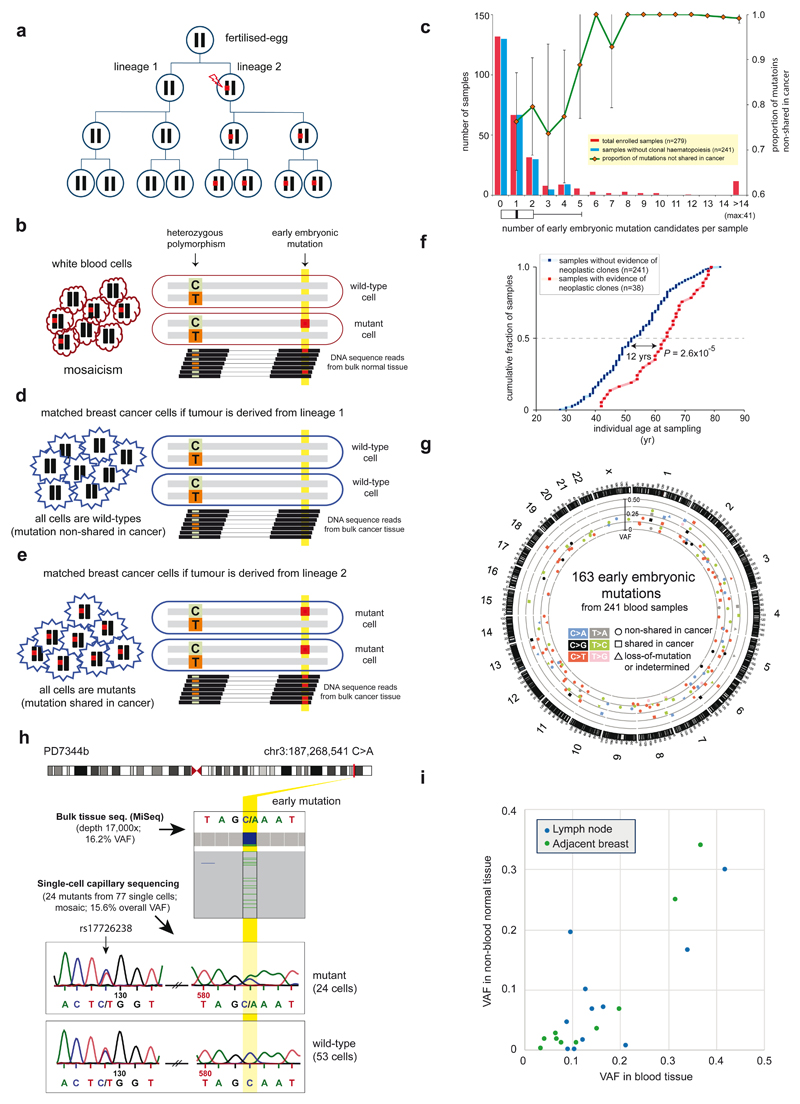
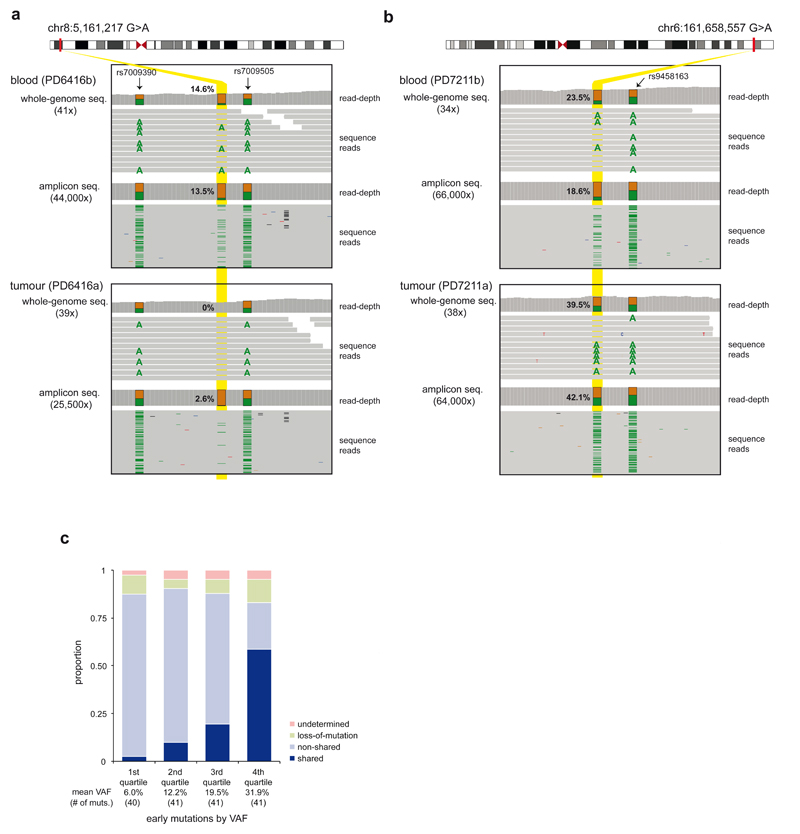
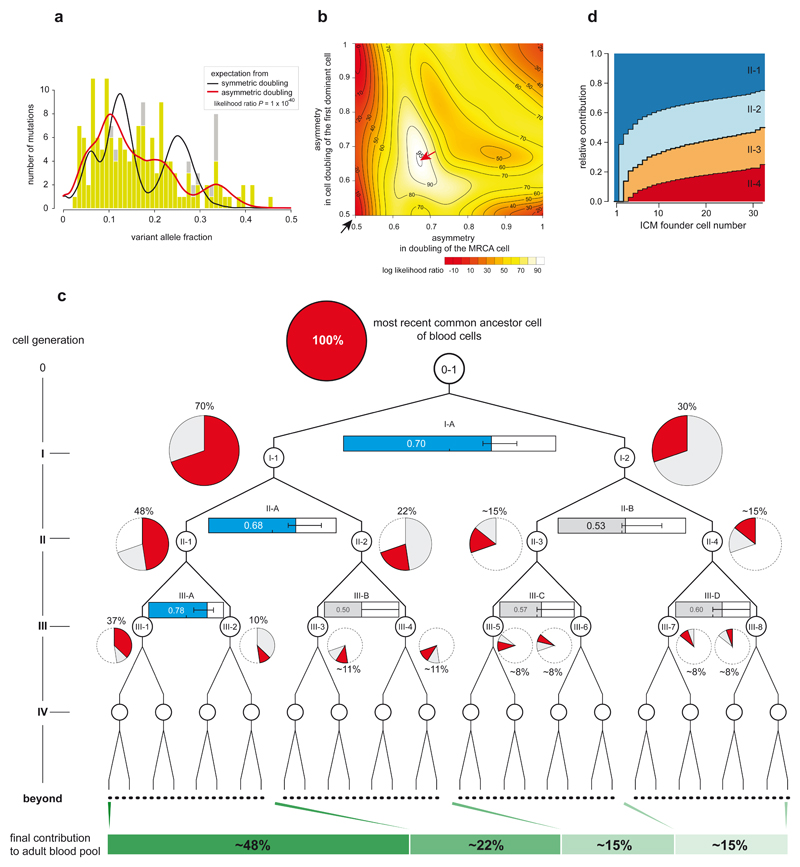
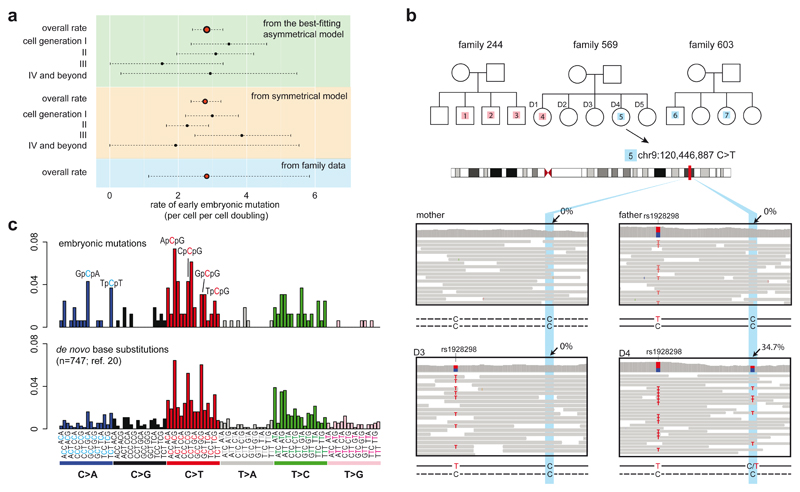
Somatic cells acquire mutations throughout the course of an individual's life. Mutations occurring early in embryogenesis are often present in a substantial proportion of, but not all, cells in postnatal humans and thus have particular characteristics and effects. Depending on their location in the genome and the proportion of cells they are present in, these mosaic mutations can cause a wide range of genetic disease syndromes and predispose carriers to cancer. They have a high chance of being transmitted to offspring as de novo germline mutations and, in principle, can provide insights into early human embryonic cell lineages and their contributions to adult tissues. Although it is known that gross chromosomal abnormalities are remarkably common in early human embryos, our understanding of early embryonic somatic mutations is very limited. Here we use whole-genome sequences of normal blood from 241 adults to identify 163 early embryonic mutations. We estimate that approximately three base substitution mutations occur per cell per cell-doubling event in early human embryogenesis and these are mainly attributable to two known mutational signatures. We used the mutations to reconstruct developmental lineages of adult cells and demonstrate that the two daughter cells of many early embryonic cell-doubling events contribute asymmetrically to adult blood at an approximately 2:1 ratio. This study therefore provides insights into the mutation rates, mutational processes and developmental outcomes of cell dynamics that operate during early human embryogenesis.


Conflict of interest statement

The authors declare no competing financial interests.

Figures

Extended Data Figure 1
Filters to exclude mutation candidates in regions with copy number variation. a, For every blood sample, we assessed the distribution of coverage of ~3M inherited SNP loci. Using this distribution, we determined a cutoff value that is used for inter-sample CNV filtering (see Methods). In the case of PD3989b shown in the figure, candidate mutation loci with >51x coverage were considered to be located on copy number gain thus removed. b, An example of inter-sample CNV filtering (see Methods). Normalized coverage for chr11:14,446,619 region of PD4116b is located in the normal copy number (CN=2) cluster. c, Copy number gain was identified in a candidate mutation locus (chr6:285,671) from PD4116b by the inter-sample CNV filtering method. Therefore, this mutation candidate was removed from further downstream analyses.
Extended Data Figure 2
Features of ultrahigh-depth targeted amplicon sequencing used for validation. a, Estimation of the impact of potential PCR allelic bias from targeted amplicon sequencing. Using inherited heterozygous SNP sites which were PCR amplified and ultra-deep sequenced, we assessed potential PCR bias (i.e. preferential amplification of one allele compared to the other): the distribution of VAFs was broader than expected from a binomial distribution (theoretical maximum), but the PCR bias was not substantial as a clear peak at VAF=0.5 was present. The estimated overdispersion level (theta value in beta-binomial distribution) was 223.88. The estimate was used in the simulation studies for assessment of cell doubling asymmetry in early embryogenesis (see Methods for more details). b, High precision of ultrahigh-depth amplicon sequencing in assessment of VAF of a mutation. For the 14 early embryonic mutations, we quantified their VAFs from the second blood samples using the same strategy (i.e. PCR amplification and deep sequencing). The VAF estimates from the first and the second sequencings were highly correlated. c, Background error rate of targeted amplicon sequencing (see Methods). The background mutation rate showed sequence context dependency. Error bars denote 2 * interquartile range. We used these background mutation rates in a filtering step.
Extended Data Figure 3
Features of a blood sample with a neoplastic clonal expansion in the blood. a, This hypothetical scenario illustrates the expectation in a normal blood sample when there is no obvious neoplastic clonal expansion. Each white-filled black circle represents an embryonic cell. White-filled red and red-filled circles are adult haematopoietic stem cells and adult blood cells, respectively. Here, for simplicity, we assumed a uniform mutation rate of 1 substitution per cell per cell doubling. Each mutation during cell doubling is represented by a number in a black-filled rectangle. Mutations accumulated in a specific early cell are shown with numbers next to the cell. The final mutations acquired at an early cell of cell generation IV (16-cell stage) and their expected relative contribution to adult blood tissues (1/16 or 6.6%) is summarized in the box below the cellular phylogenetic tree. We assumed that breast cancer (green-filled circles) cells are descendant of the embryonic cell of the leftmost lineage (which harbors mutations #1, #3, #7 and #15). In the circumstances, the expected features of early embryonic mutations (VAFs, chance to be shared with breast cancer) are summarized in the right table. b, An alternative scenario with a neoplastic clonal expansion in the blood (here we assumed a haematopoietic stem cell contributes 40% of all blood cells). We assumed that additional 100 somatic mutations were further acquired during late cell doublings. The expected features are summarized in the right table.
Extended Data Figure 4
Features of mutations in blood samples with neoplastic clonal expansions. Mutations from samples with evidence of neoplastic clonal expansions display more similar VAFs to (the right violin plot) each other compared to mutations from samples without neoplastic clonal expansions (the left violin plot).
Extended Data Figure 5
Features of the early embryonic mutations identified in this study. a, As expected for early embryonic mutations, we observe no relationship between the age of individuals and the number of mutations found in an individual. In case of late mutations, we find more mutations in the aged individuals (Fig. 1f). b, Features of mutations in the samples (n=7) with four early embryonic mutations suggest that these mutations are not likely to be related with a neoplastic clonal expansion: VAFs of mutations are diverse and a fraction of these mutations are shared with the matched cancer. The corresponding VAFs in the matched tumour tissues are shown in numbers above the bars. c, Samples with neoplastic clonal expansions (i.e. PD9568b, PD9752b and PD9569b) show different features: mutations show similar VAFs each other and are not shared by cancer cells. d, Enrichment of early mutations according to ENCODE dataset. We find higher mutation frequency in transcriptionally repressed (R) than active (T) regions, but the difference is nonsignificant in our study (chi-square test, df=1, P value = 0.4696), presumably due to the insufficient number of early embryonic mutations (n=163). R, repressed chromatin; T, transcribed chromatin; CTCF, CTCF-bound regions; E, enhancer related; TSS/PF, promoter related. e, From a simulation study using 1,000 in-silico embryonic mutations, we assessed the detection sensitivity of early embryonic mutations from 32x whole-genome sequencing (see Methods). This sensitivity was used in downstream analyses (for example, likelihood tests for understanding the asymmetry of cell doublings and tests for the calculation of the early embryonic mutation rates.
Extended Data Figure 6
Expected proportion of early embryonic mutations shared by cancer according to the cell generation gap between the MRCA cell of adult blood cells and the MRCA cell of all somatic cells. a, (see Supplementary Discussion 4) A scenario when there is no cell generation gap. Early mutations are represented by asterisks in colors. A summary of the expected proportion of mutations shared with cancer cells is shown in the table: the chance is twice the VAF of each early embryonic mutation. b, A scenario when the MRCA cell of adult blood cells is formed one cell generation later than the MRCA cell of all somatic cells. The chance is identical to the VAF of each early embryonic mutation. c, A scenario when the MRCA cell of adult blood cells is formed two cell generations later than the MRCA cell of all somatic cells. The chance is half the VAF of each early embryonic mutation.
Extended Data Figure 7
The MRCA cell of adult blood cells is the MRCA cell of all somatic cells (or the fertilized egg) (see Supplementary Discussion 4) Using the expected proportion of mutations shared with cancer (Extended Data Fig. 6), we estimated the timing when the MRCA cell of adult blood cells is formed. Thr four orange boxes show the expected proportions from four scenarios, when there are 0, 1, 2, and 3 cell generation gaps between the MRCA cells. The observed proportion (26%; green horizontal line) in this study is closest to the expectation from the model of 0 cell generation gap. Error bars by interquartile range x 2 (from the simulation study).
Extended Data Figure 8
The simulation study to understand potential stochasticity in the embryoblast formation. (see Methods, ‘A stochastic model of embryoblast formation’ for more details) a, The expected distribution of VAF of early embryonic mutations in a stochastic model in which n cells (y-axis) are randomly selected as epiblasts from the 32-cell stage embryo. The size of circle is proportional to the relative frequency of mutations at each VAF. b, The stochastic model estimates the number of founder epiblast cells and the timing (cell stage) of their commitment. The maximum likelihood is selection of 11 cells in 64-cell stage. c, The VAF distribution of early embryonic mutations expected from the maximum likelihood stochastic model. The maximum likelihood estimation (MLE) and the posterior probability by a Bayesian approach are shown by green and purple curves, respectively. Our observation of the 163 early embryonic mutations is represented by the histogram. d, Unequal contribution of the first two cells to ICM cells by direct observation of 12 mouse-embryos using inverted light-sheet microscope by Strnad et al., Nature Methods (2016) (ref. 19). Schematic diagram (cell phylogeny) is shown above the bar graph. We re-analysed their observation, counting the relative contribution to ICM (black dots indicate the observed asymmetry in each embryo). These unequal contribution levels ranged from 0.5:0.5 to 0.74:0.26 and the average was 0.6:0.4.
Extended Data Figure 9
Early embryonic mutations (n=7) identified from 3 large families. a-g, Sequencing reads (using IGV images) for the seven mutation loci are shown. All mutations are subclonal to a specific allele of a heterozygous SNP in the vicinity. As expected to early embryonic mutations, the VAFs of mutatnt alleles are lower than 0.5 and the mutant alleles are not found in the genomes of all the parents and the siblings. Three mutations (panels b, c and d) were possible to perform ultrahigh-depth targeted amplicon sequencing (by MiSeq), and all were successfully validated.
Extended Data Figure 10
Signatures of early embryonic mutations. a, The mutational spectrum for 163 early embryonic mutations is displayed according to the 96 substitution classes (defined by 6 substitution classes (C>A, C>G, C>T, T>A, T>C, T>G) and 16 sequence contexts (immediate 5` and 3` bases to the mutated pyrimidine bases; see Alexandrov et al., Nature (2013) for more details; ref. 7). The observed spectrum can be decomposed into two known mutational signatures (signatures #5 and #1), suggesting endogenous mutational processes are dominantly operative in early human embryogenesis (see Supplementary Discussion 6 for more details). b, The methylation status of 28 C>T early embryonic mutations occurred at NpCpG sequence contexts. Methylation levels were obtained from Laurent et al., Genome Research (2010). The vast majority of the 28 loci were methylated, which is higher than background (right).
Figure 1
Figure 1. Detection of somatic mutations acquired in early human embryogenesis.
(a) Transmission of an early embryonic mutation. Embryonic cells (circles), their diploid genomes (black bars), and an early mutation (red-square) are represented. (b) Early embryonic mutations appear as somatic mosaicism in normal polyclonal tissue (for example, blood). (c) Distribution of the numbers of early embryonic mutations per individual genome. The proportion of mutations non-shared with cancer is shown (green-line). Error bars denote 95% confidence intervals (binomial test). (d-e) Early embryonic mutations can appear as either absent (‘non-shared’; d) or fully clonally present (‘shared’; e) in cancer cells depending on the embryonic cell lineage from which the cancer is derived. (f) The median age of individuals with evidence of neoplastic expansion in blood is 12 years higher than individuals without it. P value from t-test. (g) A circos plot showing 163 early embryonic mutations identified from 241 individuals. (h) A mosaic mutation validated by single-cell sequencing. (i) Embryonic mutations (n=21) confirmed in non-blood normal tissues (breast or lymph node; n=13).
Figure 2
Figure 2. Features of early embryonic mutations.
(a) An example of an embryonic mutation non-shared with cancer. The minimal low VAF (2.6%) observed in the tumor ultrahigh-depth amplicon sequencing is consistent with a contaminating population of mutant non-neoplastic cells. (b) An example of an embryonic mutation shared with cancer. The high VAF (42.1%) in the tumour ultrahigh-depth amplicon sequencing is consistent with a clonal mutation in cancer cells and a contaminating population of wild-type non-neoplastic cells. (c) The proportion of shared mutations correlates with the VAF of mutations in blood.
Figure 3
Figure 3. Unequal contributions of early embryonic cells to adult somatic tissues.
(a) The VAF distribution of 163 early embryonic mutations in blood. Light green bars, VAFs from ultrahigh-depth amplicon sequencing; gray bars, VAFs from whole-genome sequencing (when ultrahigh-depth amplicon sequencing is not available). The expected distributions of VAFs (with adjustment for sensitivity of mutation detection) from symmetric (black-line) and best-fitting asymmetric cell doubling models (red-line). (b) A contour plot showing the optimization of asymmetries in cell doublings. The horizontal axis and vertical axis present the asymmetry levels for the first and the second dominant cell doublings (cell doubling of MRCA and I-1 cells (see Fig 3c), respectively). Compared to the symmetric model (black arrow), the maximum likelihood asymmetric model (red arrow) provides a much better fit to the data (P=1x10-40, Likelihood Ratio Test). (c) Maximum likelihood relative contributions of early cells to the adult blood cell pool (pie chart). The asymmetries of each cell doubling are shown using horizontal bar graphs (blue bar, significant asymmetry; grey bar, nonsignificant asymmetry). Error bars denote 95% confidence intervals from non-parametric bootstrapping. (d) Simulation study under a stochastic bottleneck model according to the number of ICM founder cells. The relative contributions of the first four cells are shown (Methods).
Figure 4
Figure 4. Rates and mutational spectra of early embryonic mutations.
(a) Estimates of early embryonic mutation rates. Best-fitting asymmetric model (top), symmetric model (middle) and family study (bottom) provide similar rate. Broken lines represent 95% confidence intervals from bootstrapping (Methods). (b) Early embryonic mutations obtained from 3 large families. Each mutation is shown with a number (index) inside the white rectangles or circles in the pedigrees. Sequencing reads are shown for one of the mutations (#5) in family 569. (c) Similar mutational spectra (ref. 7) obtained from 163 early embryonic mutations and from 747 de novo mutations reported previously (ref. 20).

References

    1. Samuels ME, Friedman JM. Genetic mosaics and the germ line lineage. Genes. 2015;6:216–237. doi: 10.3390/genes6020216. - DOI - PMC - PubMed
    1. Erickson RP. Recent advances in the study of somatic mosaicism and diseases other than cancer. Current opinion in genetics & development. 2014;26:73–78. doi: 10.1016/j.gde.2014.06.001. - DOI - PubMed
    1. Laurie CC, et al. Detectable clonal mosaicism from birth to old age and its relationship to cancer. Nature genetics. 2012;44:642–650. doi: 10.1038/ng.2271. - DOI - PMC - PubMed
    1. Ruark E, et al. Mosaic PPM1D mutations are associated with predisposition to breast and ovarian cancer. Nature. 2013;493:406–410. doi: 10.1038/nature11725. - DOI - PMC - PubMed
    1. Behjati S, et al. Genome sequencing of normal cells reveals developmental lineages and mutational processes. Nature. 2014;513:422–425. doi: 10.1038/nature13448. - DOI - PMC - PubMed

Publication types