. 2017 May;74(5):205-218.
doi: 10.1002/cm.21364. Epub 2017 May 10.

Re-evaluating the roles of myosin 18Aα and F-actin in determining Golgi morphology

Affiliations

Re-evaluating the roles of myosin 18Aα and F-actin in determining Golgi morphology

Kyle Bruun et al. Cytoskeleton (Hoboken). 2017 May.

Abstract

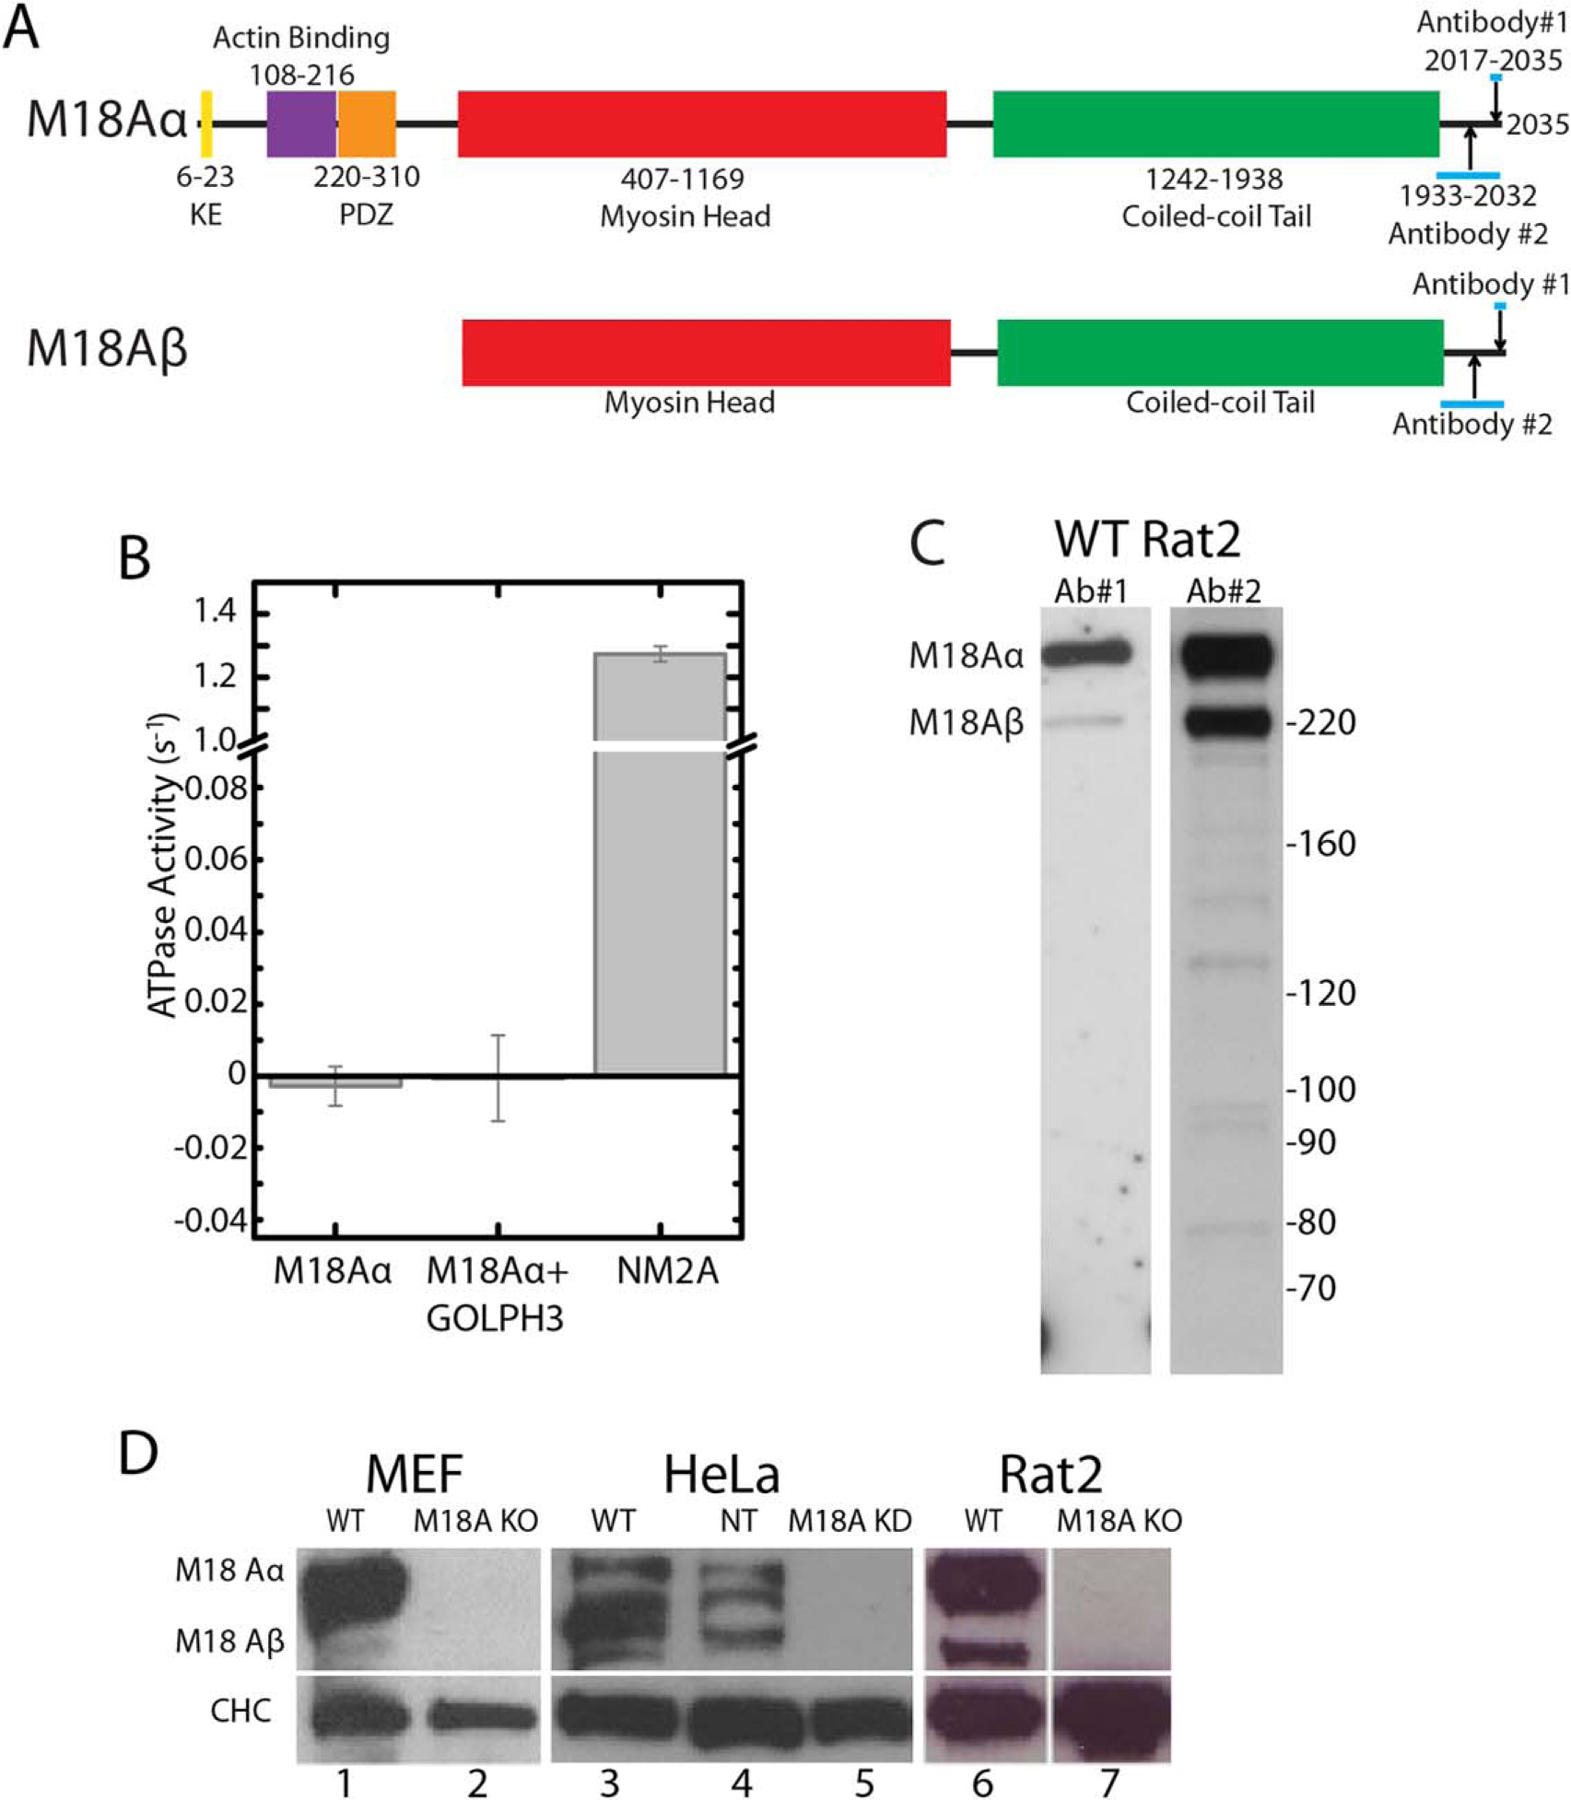
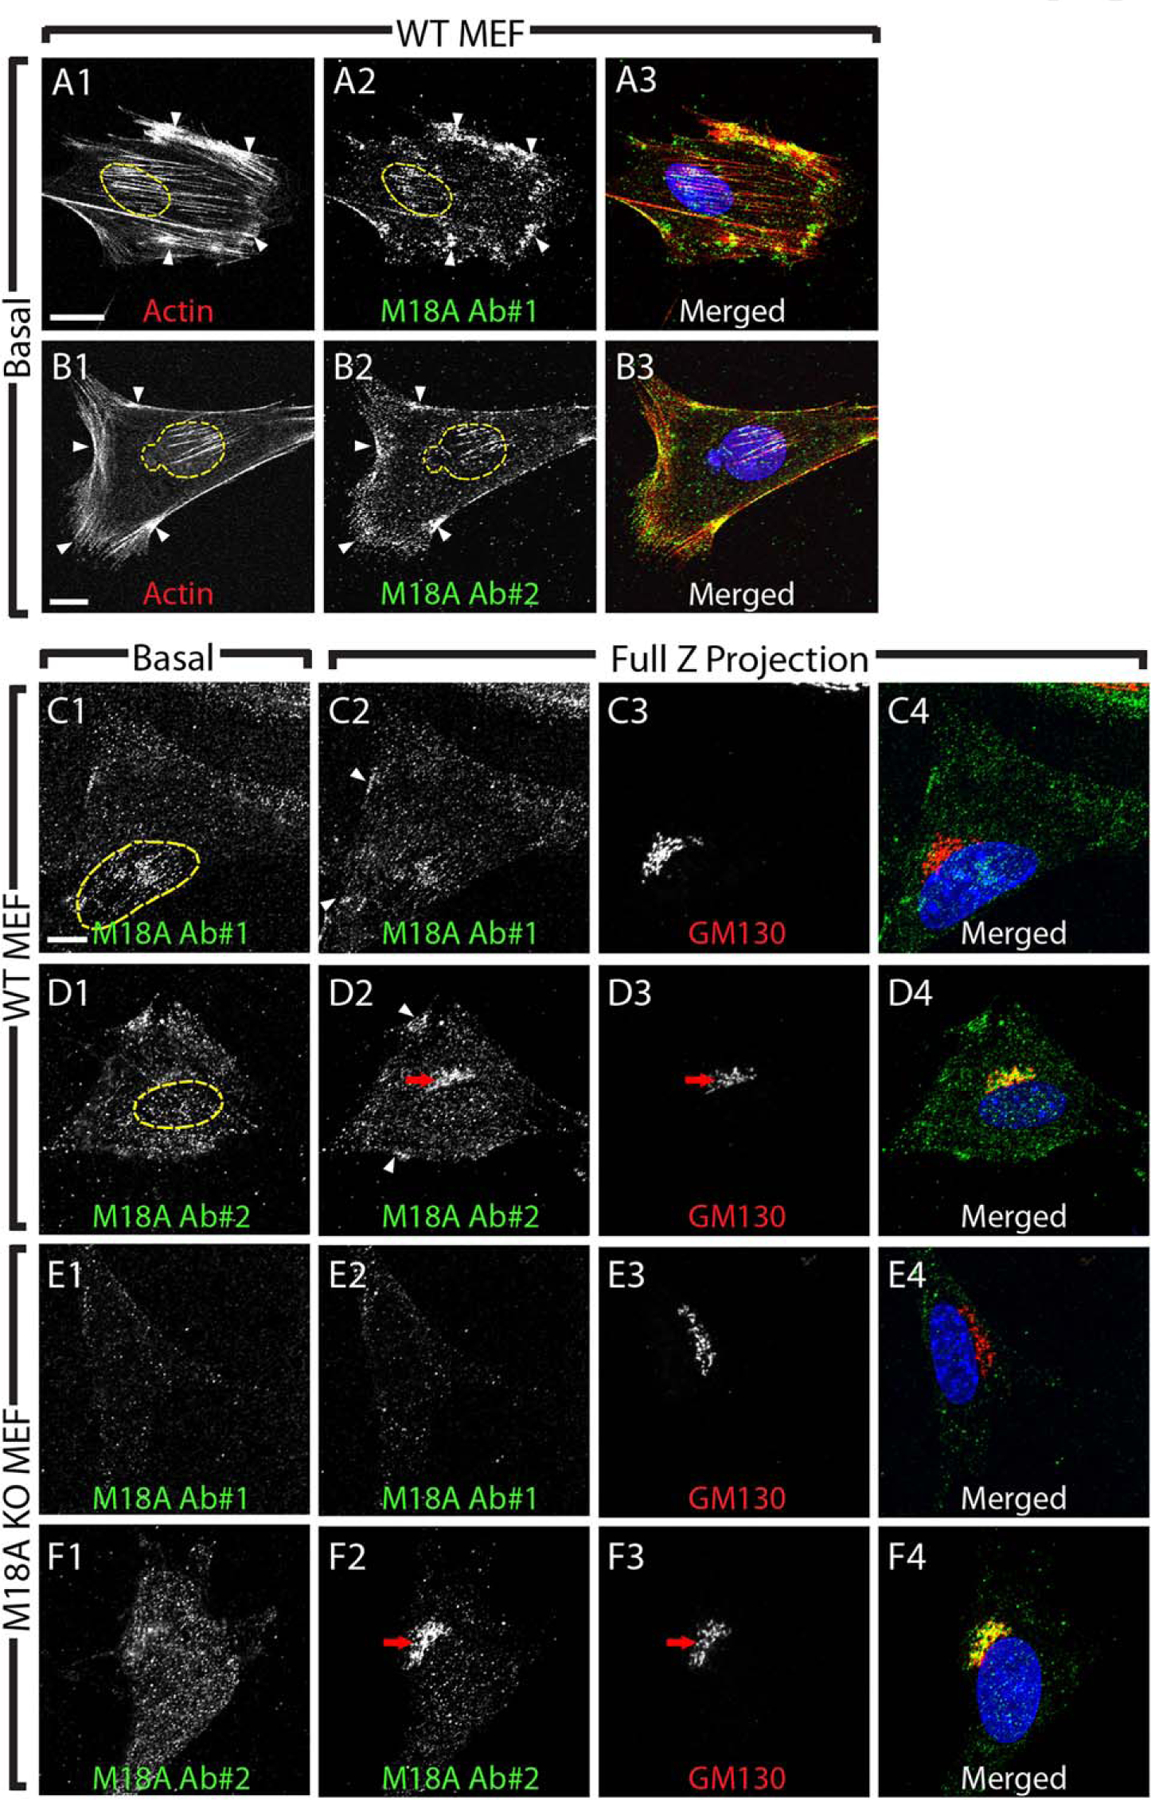
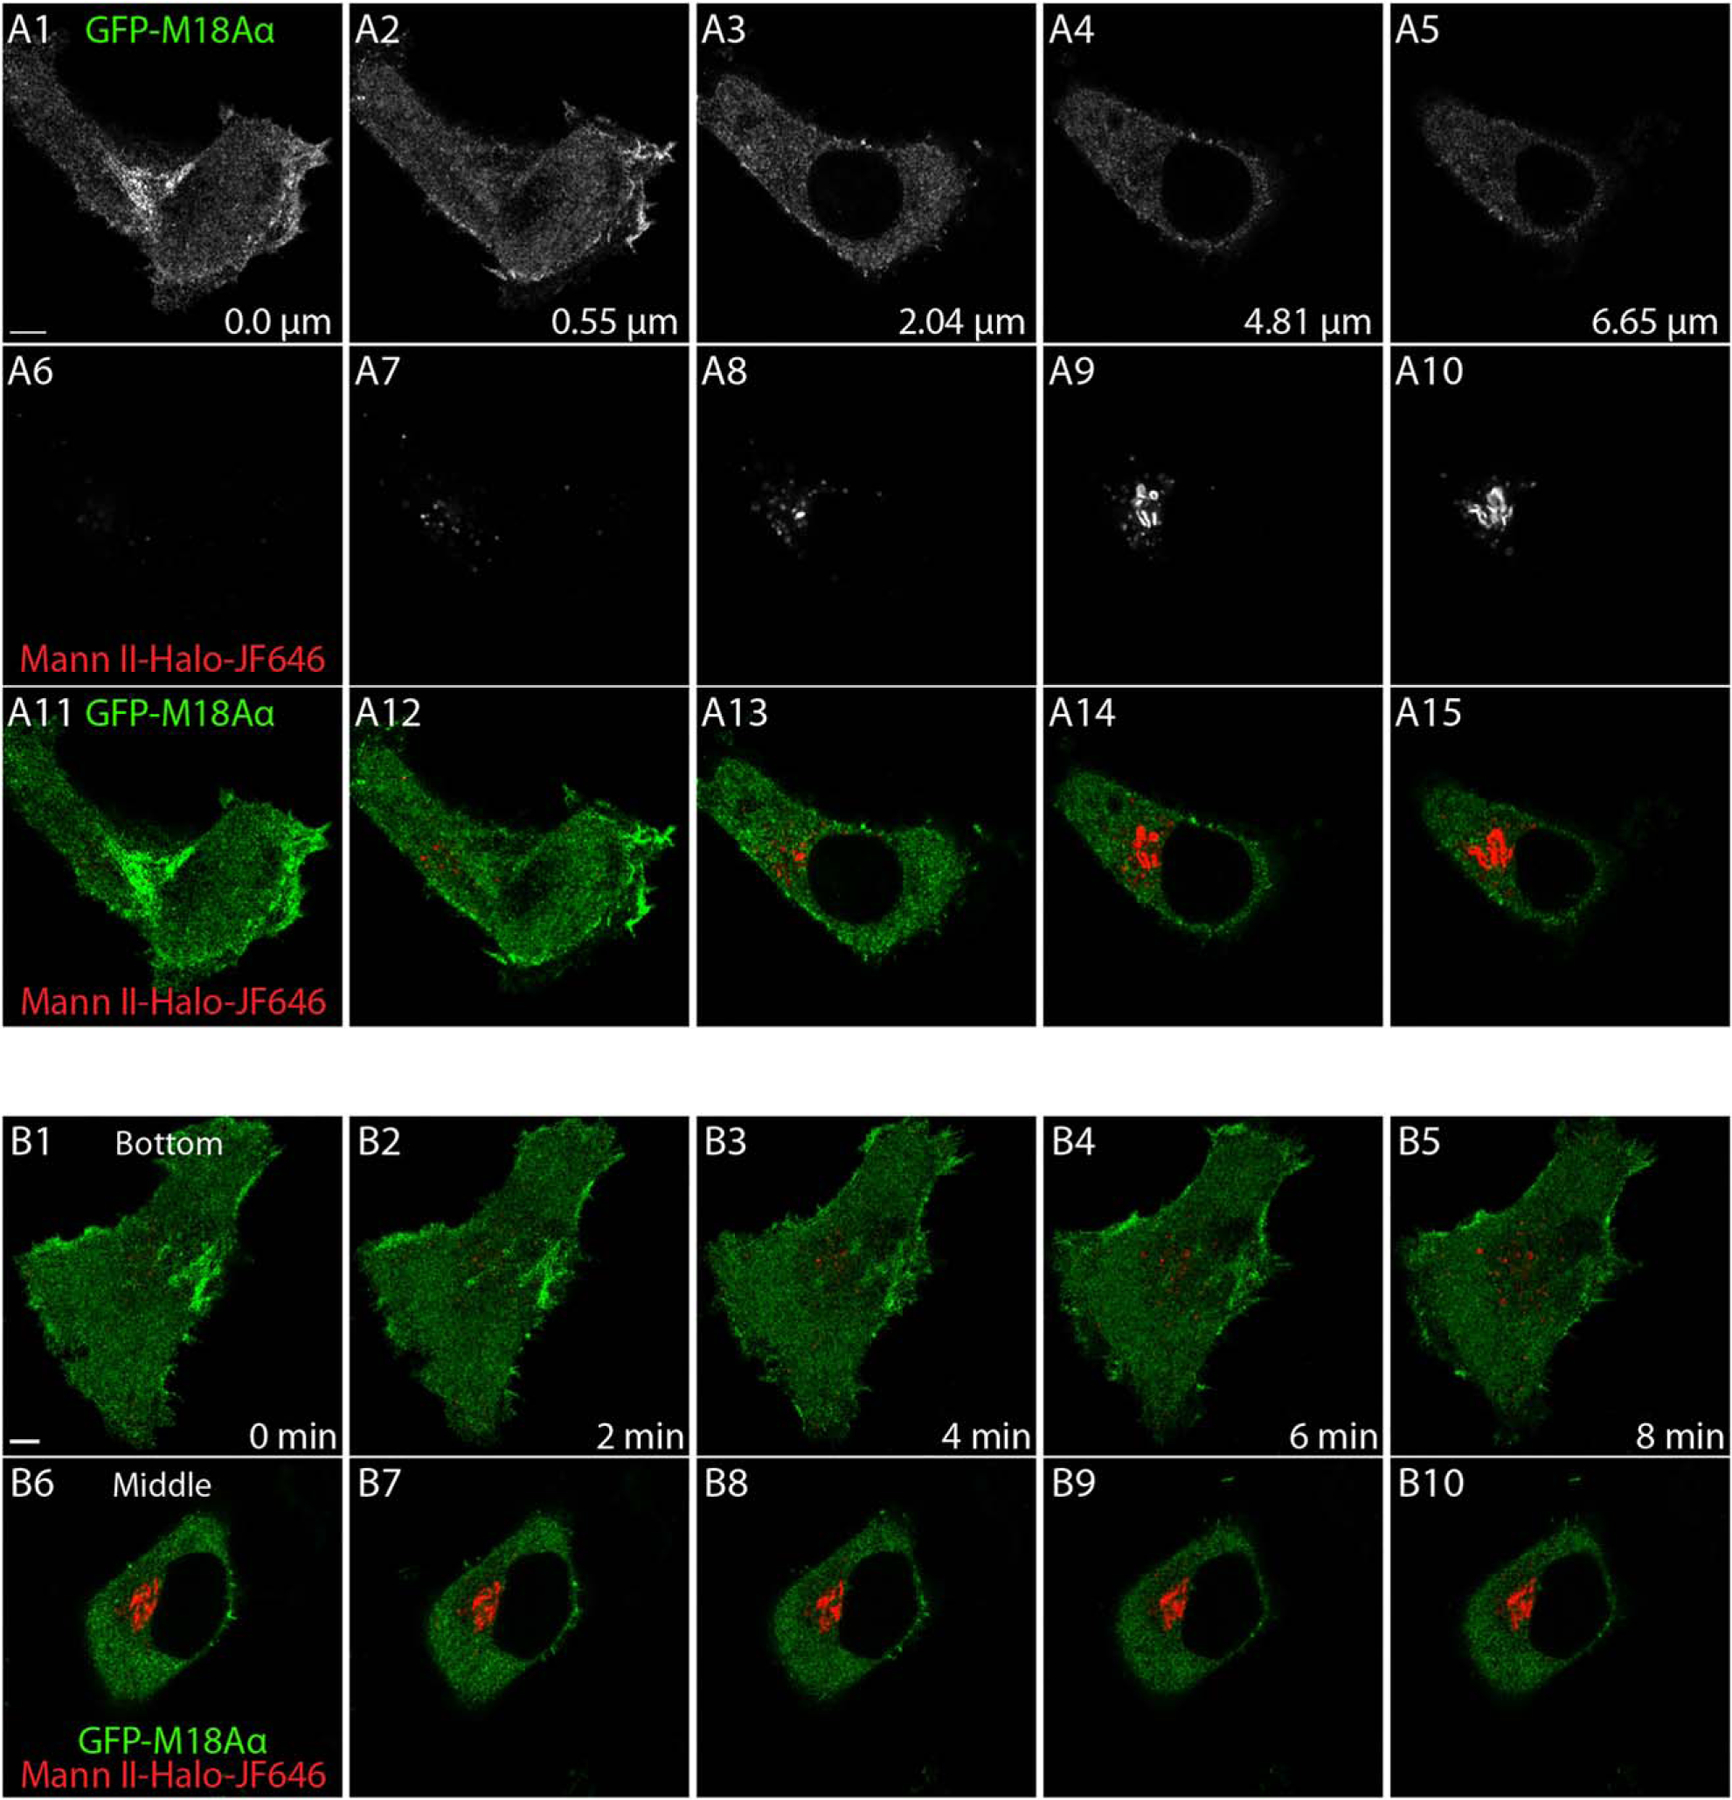
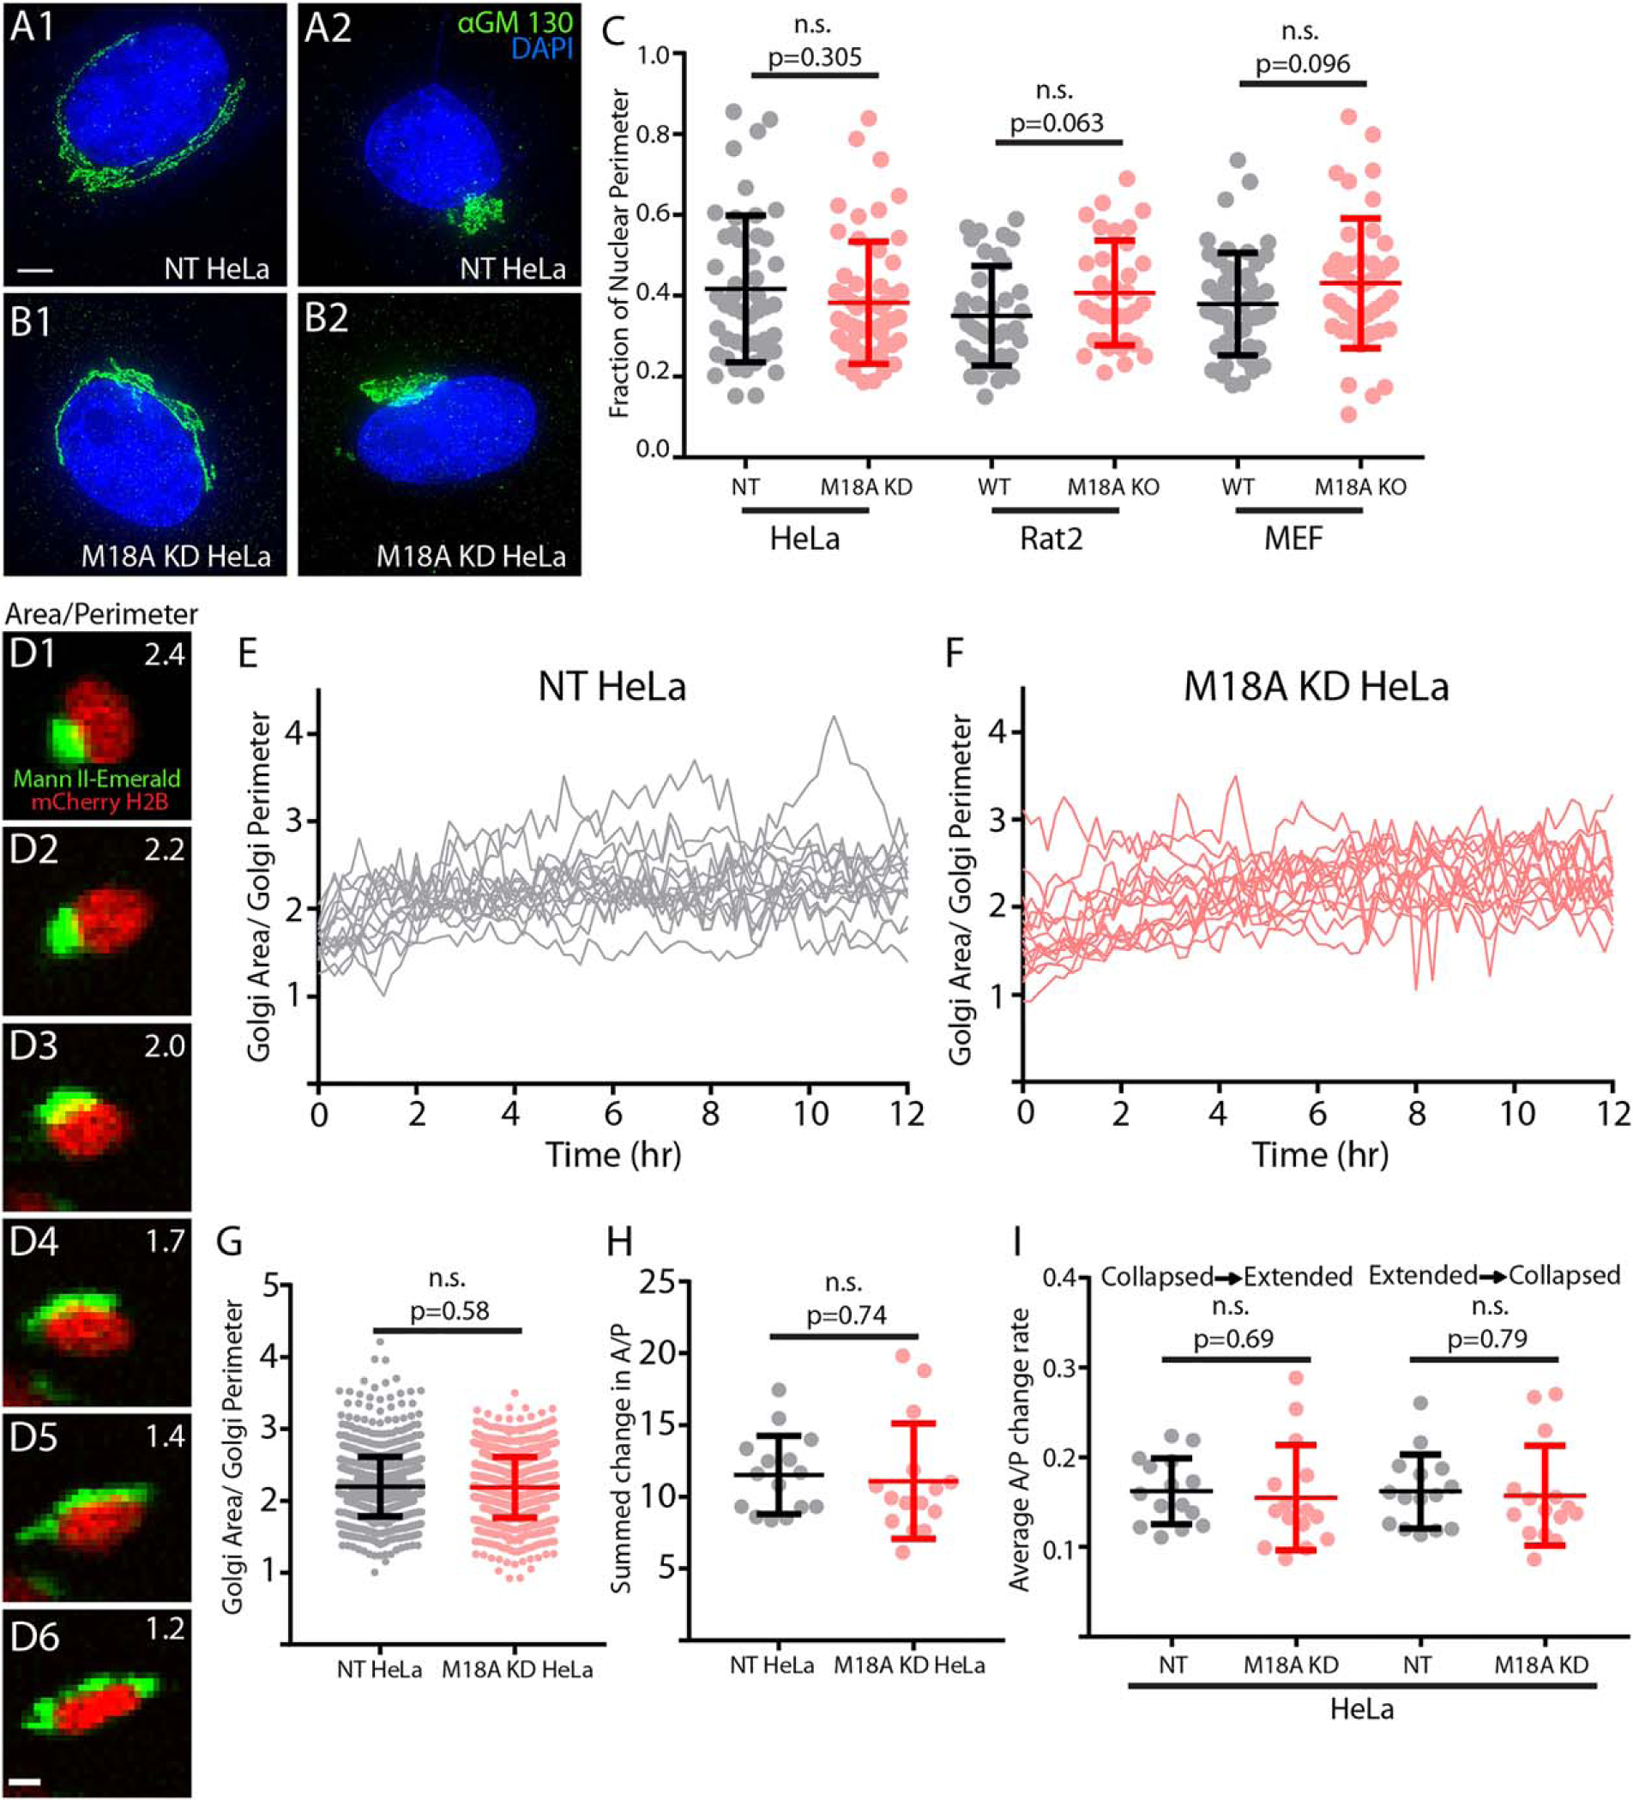
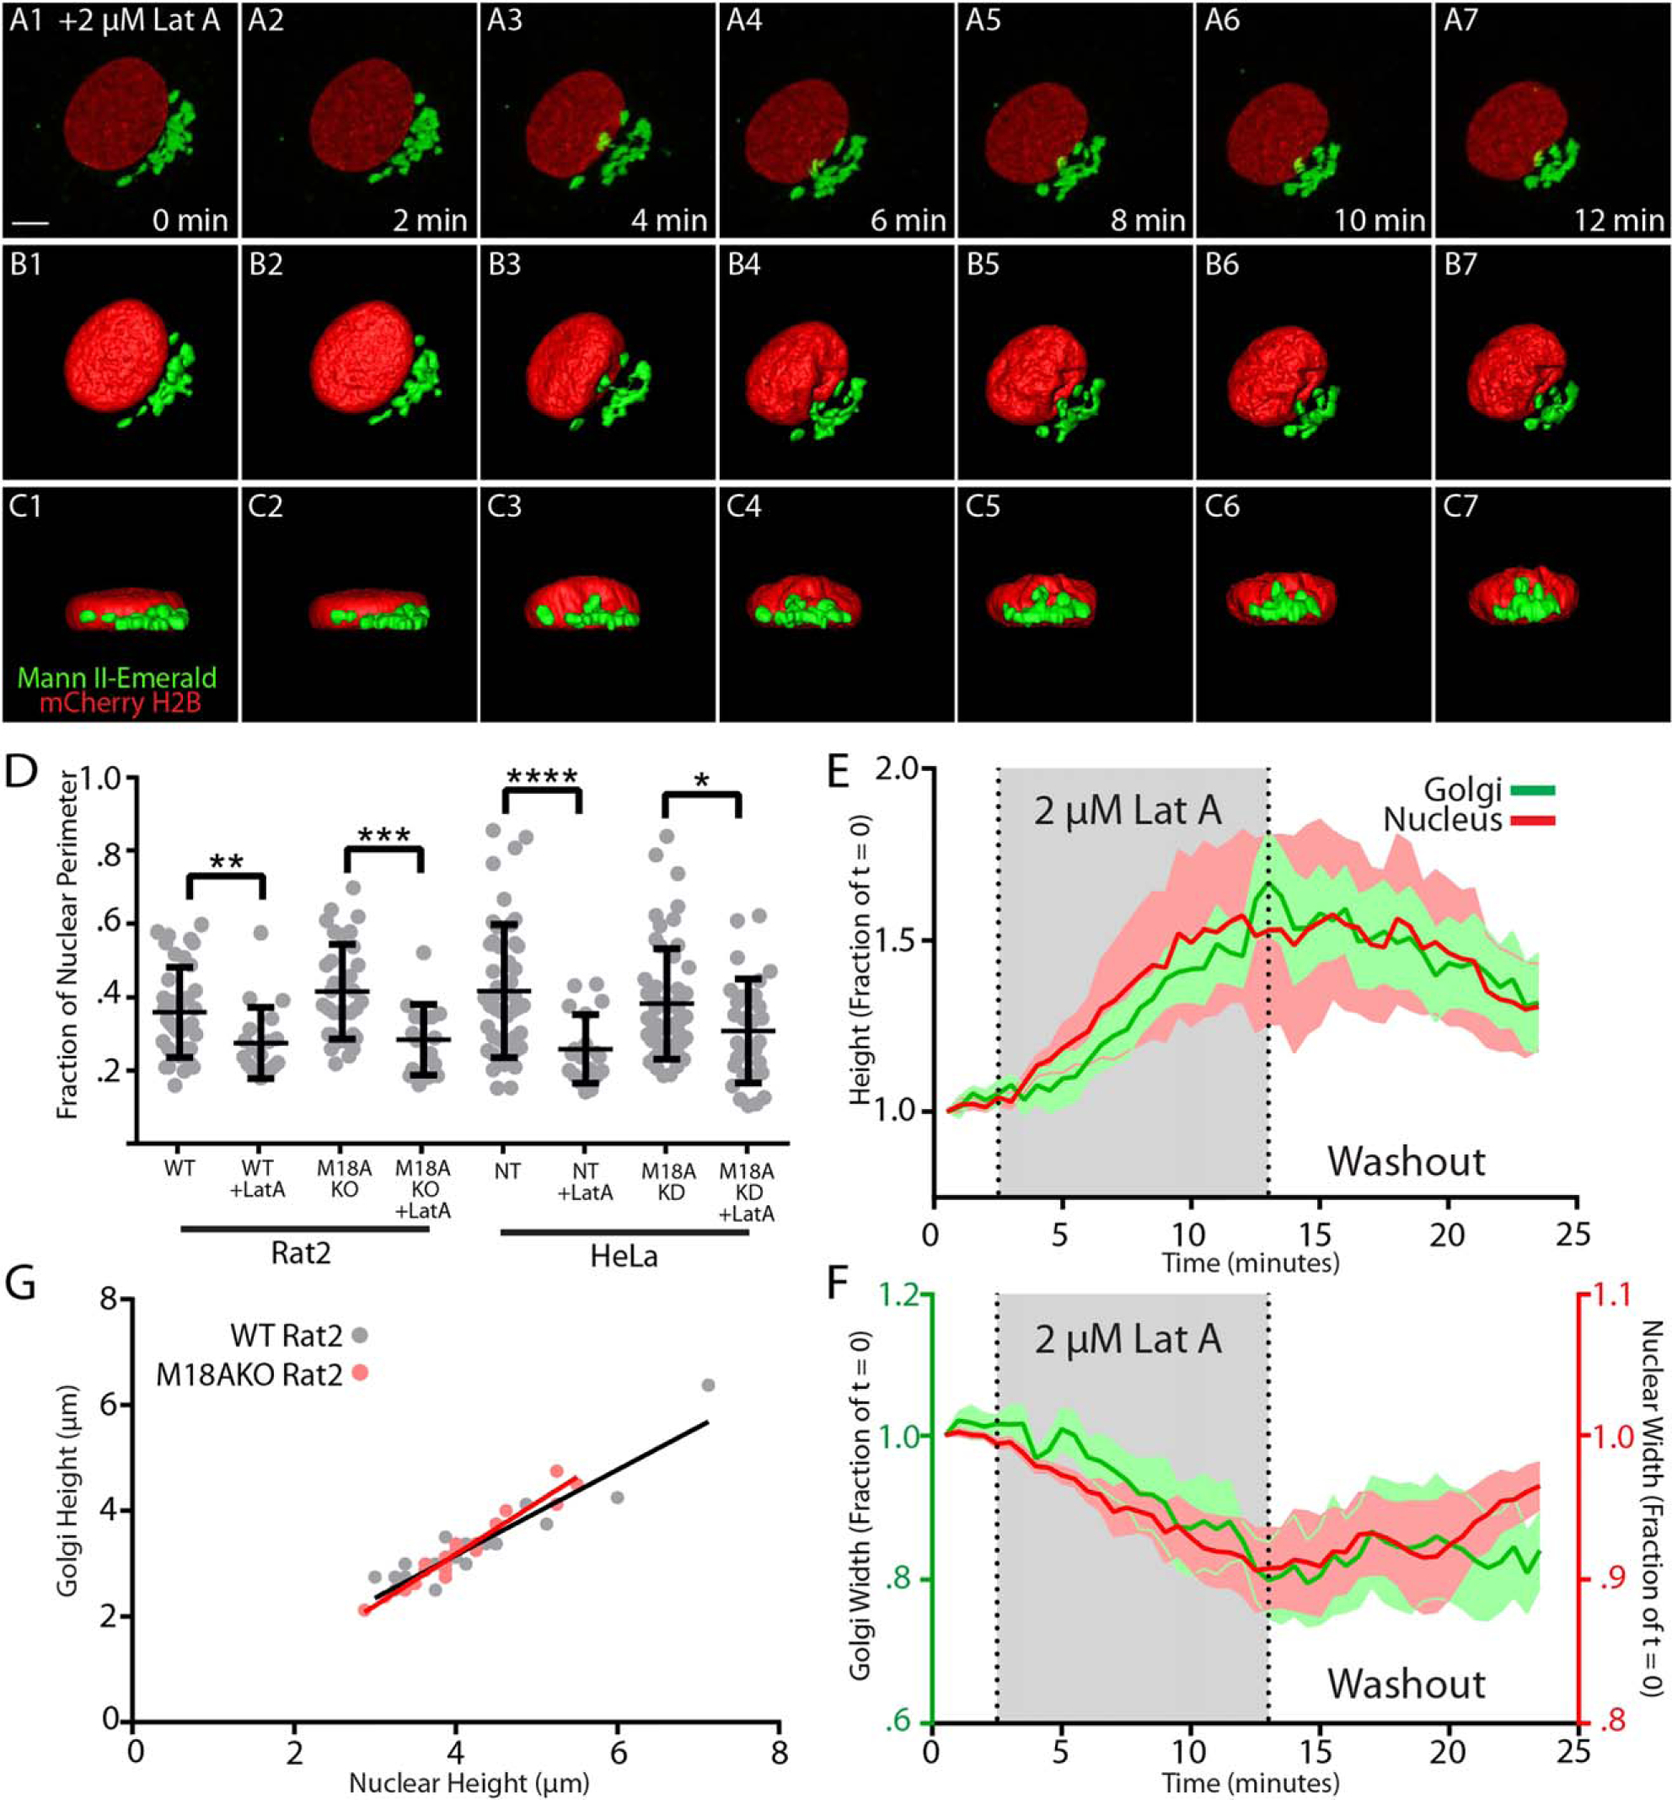
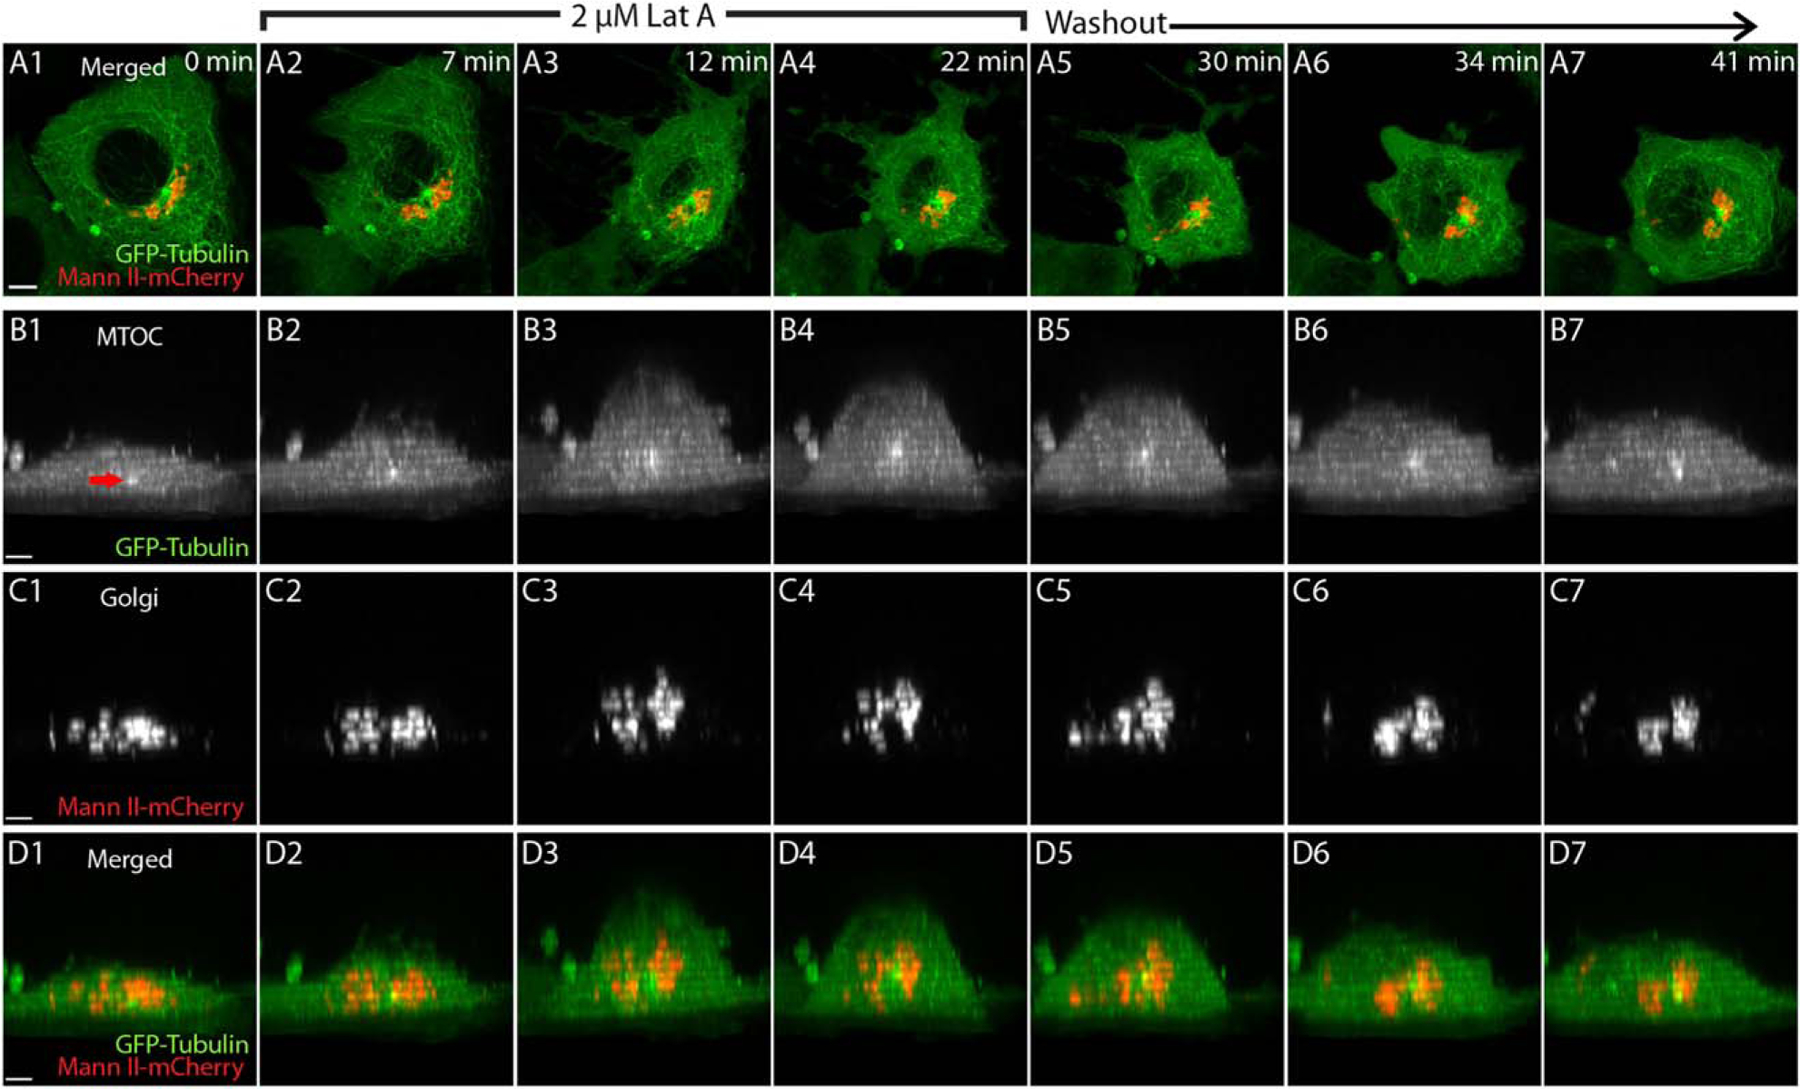
The peri-centrosomal localization and morphology of the Golgi apparatus depends largely on the microtubule cytoskeleton and the microtubule motor protein dynein. Recent studies proposed that myosin 18Aα (M18Aα) also contributes to Golgi morphology by binding the Golgi protein GOLPH3 and walking along adjacent actin filaments to stretch the Golgi into its classic ribbon structure. Biochemical analyses have shown, however, that M18A is not an actin-activated ATPase and lacks motor activity. Our goal, therefore, was to define the precise molecular mechanism by which M18Aα determines Golgi morphology. We show that purified M18Aα remains inactive in the presence of GOLPH3, arguing against the Golgi-specific activation of the myosin. Using M18A-specific antibodies and expression of GFP-tagged M18Aα, we find no evidence that it localizes to the Golgi. Moreover, several cell lines with reduced or eliminated M18Aα expression exhibited normal Golgi morphology. Interestingly, actin filament disassembly resulted in a marked reduction in lateral stretching of the Golgi in both control and M18Aα-deficient cells. Importantly, this reduction was accompanied by an expansion of the Golgi in the vertical direction, vertical movement of the centrosome, and increases in the height of both the nucleus and the cell. Collectively, our data indicate that M18Aα does not localize to the Golgi or play a significant role in determining its morphology, and suggest that global F-actin disassembly alters Golgi morphology indirectly by altering cell shape.

Keywords: Golgi; actin; microtubule organizing center; myosin 18A.


Figures

FIGURE 1
FIGURE 1
M18A domain organization, actin-activated ATPase activity, antibody specificity, and knockdown/knockout cell lines (a) Domain organization of M18Aα and M18Aβ with amino acid numbers indicated. Relative to M18Aβ, M18Aα possesses a ~332 residue N-terminal extension that contains a lysine/glutamate (KE)-rich domain (yellow), an actin binding domain (purple), and a PDZ domain (orange). The regions of sequence used to generate Antibodies #1 and #2, which are identical in both isoforms, are shown in blue. (b) Actin-activated ATPase activities of purified M18Aα in the presence and absence of purified GOLPH3, and of NM2A (see Methods for details). (c) Western blot of a Rat2 whole cell extract probed with Antibody #1 (left lane) and Antibody #2 (right lane). Molecular weight markers are shown on the right in kDa. Both antibodies specifically recognize M18Aα and M18Aβ. (d) Western blots of extracts from the indicated cell types probed with Antibody #1 (WT stands for wild-type, NT stands for nontargeting shRNA). The positions of M18Aα and M18Aβ are indicated. The bottom panels show the loading control (anti-clathrin heavy chain; CHC). See also Figure S1 in Supporting Information [Color figure can be viewed at wileyonlinelibrary.com]
FIGURE 2
FIGURE 2
Endogenous M18Aα does not localize to the Golgi. (a) Wild-type (WT) MEF fixed and stained for F-actin (phalloidin, a1) and M18A (Antibody #1, a2). The merged image in (a3) includes the signal for the nucleus (DAPI, blue). The position of the nucleus is marked with a yellow dashed line in (a1 and a2). White arrowheads mark cortical regions where M18A and actin are enriched. The images are maximum intensity projections of the bottom five 0.236 µm slices from a z-stack acquired on a Nikon A1R confocal microscope (“Basal”). Scale bar, 20 µm. (b) Exactly as in (a) except using Antibody #2. (c) WT MEF fixed and stained for M18A (Antibody #1, c1 and c2) and the Golgi (GM130, c3). The merged image in (c4) includes the signal for the nucleus (DAPI, blue). The position of the nucleus is marked with a yellow dashed line in (c1). White arrowheads in (c2) mark cortical regions where M18A and actin are enriched. (c1) is a maximum intensity projection of the bottom five 0.236 µm slices from the full z-stack (“Basal”). (c2–c4) are maximum intensity projections of all 0.236 µm slices acquired on a Nikon A1R confocal microscope (“Full Z Projection”). Scale bar, 10 µm. (d) Exactly as in (c) except using Antibody #2. The apparent co-localization between M18A and the Golgi is marked with red arrows. (e and f) Exactly as in (c and d) except using a M18A KO MEF. Note that the apparent colocalization between M18A and the Golgi (red arrows) seen with Antibody #2 in (d) persists in cells lacking M18Aα and M18Aβ in (f) [Color figure can be viewed at wileyonlinelibrary.com]
FIGURE 3
FIGURE 3
GFP-tagged M18Aα does not localize to the Golgi. (a) HeLa cell expressing EGFP-M18Aα (green) and Mann II-Halo-646 (red) were imaged using a Zeiss Airyscan microscope. Selected optical sections from a complete z-stack are shown from left to right in increasing distance from the cell bottom (distance from the cell bottom indicated in lower right corner of a1–a5). (a1–a5) show M18Aα localization, (a6–a10) show Golgi localization, and (a11–a15) show the merged images. Scale bar, 5 µm. (b) HeLa cell prepared as in (a) was imaged over 8 min in just two planes: at the bottom (b1–b5) and in the middle (3.7 µm above the coverslip) of the cell (b6–b10), and all the panels are merged images of the M18Aα (green) and Golgi (red) at the indicated time points. See also Video S1 in Supporting Information [Color figure can be viewed at wileyonlinelibrary.com]
FIGURE 4
FIGURE 4
Abrogation of M18Aα expression does not alter Golgi morphology, which is highly variable. (a and b) Control HeLa cells expressing non-targeting (NT) shRNA (NT HeLa, a1 and a2) and Hela cells expressing M18A shRNA (M18A KD HeLa, b1 and b2) were fixed and stained with the cis-Golgi marker α-GM130 (green) and the nuclear marker DAPI (blue). The images are maximum intensity projections of wide-field z-stacks acquired on a Deltavision OMX microscope with 0.125 µm steps. These representative images show that the Golgi can exist in both extended and contracted states in both control and M18A KD cells. Scale bar, 5 µm. (c) Golgi size, quantified as a fraction of nuclear perimeter, was measured in the indicated cell types prepared and was imaged as in (a) and (b). The n values are as follows: NT HeLa (47), M18A KD HeLa (55), WT Rat2 (39), M18A KO Rat2 (49), WT MEF (49), and M18A KO MEF (43). (d) NT HeLa cell expressing mCherry-H2B to mark the nucleus (red) and Mann II-mEmerald to mark the Golgi (green) and was imaged using a Nikon A1R microscope. Shown are representative examples of the variations in Golgi morphology exhibited by this cell over time (A/P values are shown in the upper right corner). Scale bar, 10 µm. (e) A/P values for 15 randomly chosen NT HeLa cells (grey) imaged as described in (d) every 10 min over 12 hr. (f) Exactly as in (e) but with M18A KD HeLa cells (red). (g) Means and standard deviations for all the A/P values obtained over 12 hr for NT HeLa (grey) and M18A KD HeLa (red). (H) Means and standard deviations for the summed changes in A/P values over 12 hr for NT HeLa (grey) and M18A KD HeLa (red). (i) Means and standard deviations for the rates of change in A/P values per 10-min interval going from either collapsed to extended and or from extended to collapsed for NT HeLa (grey) and M18A KD HeLa (red). Where appropriate, p values are indicated (n.s. indicates a lack of significance) [Color figure can be viewed at wileyonlinelibrary.com]
FIGURE 5
FIGURE 5
Actin filament disassembly causes changes in Golgi morphology that correlate with changes in nuclear shape. (a–c) A Rat2 cell expressing mCherry-H2B to mark the nucleus (red) and Mann II-mEmerald to mark the Golgi (green) was imaged in 0.5 µm steps on a Zeiss Airyscan microscope every 2-min following addition of 2 µM Lat A (time indicated in lower right corner of a1–a7). Shown are maximum intensity projections from an overhead view (a1–a7), 3D surface-rendered images from an overhead view (b1–b7), and 3D surface-rendered images from an orthogonal view (c1–c7). Scale bar, 5 µm. Note in panels (c1–c7) that as the Golgi undergoes a reduction in width, it increases in height, and that the nucleus undergoes a similar reduction in width and increase in height. See also Video S3 in Supporting Information. (d) Golgi size, quantified as a fraction of nuclear perimeter, measured in the indicated cell types either before or 15 min after addition of 2 µM Lat A, and following fixation and staining with α-GM130 and DAPI. Lines indicate mean +/‒ standard deviation. The p values are as follows: WT Rat2 vs. WT Rat2 + Lat A, p = 0.0073; M18A KO Rat2 vs. M18A KO Rat2 + Lat A, p = 0.0003; NT HeLa vs. NT HeLa + Lat A, p < 0.0001; M18A KD HeLa vs. M18A KD HeLa + Lat A, p = 0.0295. The n values are as follows: WT Rat2 (39), WT Rat2 + Lat A (19), M18A KO Rat2 (34), M18A KO Rat2 + Lat A (16), NT HeLa (47), NT HeLa + Lat A (19), M18A KD HeLa (55), M18A KO HeLa + Lat A (29). (e and f) Eight Rat2 cells expressing Mann II-mEmerald and mCherry-H2B were imaged for 2.5 min prior to Lat A addition, for 10 min in the presence of 2 μM Lat A (grey background), and for 12.5 min after Lat A washout (white background). Panel (e) shows the heights of Golgi (green) and nuclei (red), plotted as fractions of t = 0, while Panel (f) shows the widths of Golgi (green) and nuclei (red), plotted as fractions of t = 0. In both panels, the mean values are indicated by the dark red and green lines, while the SEM values are indicated by the light red and green shaded areas. Note that the scales for Golgi and nuclei in Panel (f) are different. The changes in nuclear and Golgi shape are significantly correlated in both height (R2 = 0.88, p ≤0.0001) and width (R2 = 0.72, p ≤ 0.0001). (g) WT Rat2 cells (grey) and M18A KO Rat2 cells (red) were fixed and stained with the cis-Golgi marker α-GM130 (green) and the nuclear marker DAPI (blue), and the heights of their nuclei (x axis) and Golgi (y axis) measured (n = 23). Linear regression analyses demonstrated a strong positive correlation between Golgi height and nuclear height for both WT (R2 = 0. 86; slope = 0.81) and M18A KO cells (R2 = 0.94; slope = 0.97), and slopes that are significantly nonzero (p ≤ 0.0001) [Color figure can be viewed at wileyonlinelibrary.com]
FIGURE 6
FIGURE 6
Actin filament disassembly induces vertical movement of the MTOC that parallels the increase in Golgi height. (a–d) A Rat2 cell expressing GFP-tubulin to mark the MTOC (the single, bright, perinuclear green spot marked with a red arrow in Panel b1) and Mann II-mCherry to mark the Golgi (red) was imaged in 1 µm steps on a Zeiss Airyscan microscope at the indicated time points (upper right corner in a1–a7) before, during, and after treatment with 2 µM Lat A, as indicated. Shown are maximum intensity projections for the merged images from an overhead view (a1-a7), and maximum intensity projections for the MTOC (b1-b7, see arrowhead), Golgi (c1-c7), and merged (d1-d7) from orthogonal views. See also Video S4 in Supporting Information. The horizontal striping apparent in the orthogonal views stems from the suboptimal axial sampling required to execute super-resolution imaging and can be ignored. Scale bars, 4 µm in (a) and 3 µm in (b–d) [Color figure can be viewed at wileyonlinelibrary.com]

Similar articles

Cited by

References

    1. Billington N, Beach JR, Heissler SM, Remmert K, Guzik-Lendrum S, Nagy A, … Sellers JR (2015). Myosin 18A coassembles with nonmuscle myosin 2 to form mixed bipolar filaments. Current Biology, 25, 942–948. - PMC - PubMed
    1. Campellone KG, Webb NJ, Znameroski EA, & Welch MD (2008). WHAMM is an Arp2/3 complex activator that binds microtubules and functions in ER to Golgi transport. Cell, 134, 148–161. - PMC - PubMed
    1. Cao H, Weller S, Orth JD, Chen J, Huang B, Chen JL, … McNiven MA (2005). Actin and Arf1-dependent recruitment of a cortactin-dynamin complex to the Golgi regulates post-Golgi transport. Nature Cell Biology, 7, 483–492. - PubMed
    1. Carreno S, Engqvist-Goldstein AE, Zhang CX, McDonald KL, & Drubin DG (2004). Actin dynamics coupled to clathrin-coated vesicle formation at the trans-Golgi network. Journal of Cell Biology, 165, 781–788. - PMC - PubMed
    1. Chen JL, Lacomis L, Erdjument-Bromage H, Tempst P, & Stamnes M (2004). Cytosol-derived proteins are sufficient for Arp2/3 recruitment and ARF/coatomer-dependent actin polymerization on Golgi membranes. FEBS Letters, 566, 281–286. - PubMed

LinkOut - more resources