. 2017 Mar 23;9(1):27.
doi: 10.1186/s13073-017-0417-1.

A novel multi-network approach reveals tissue-specific cellular modulators of fibrosis in systemic sclerosis

Affiliations

A novel multi-network approach reveals tissue-specific cellular modulators of fibrosis in systemic sclerosis

Jaclyn N Taroni et al. Genome Med. .

Abstract

Background: Systemic sclerosis (SSc) is a multi-organ autoimmune disease characterized by skin fibrosis. Internal organ involvement is heterogeneous. It is unknown whether disease mechanisms are common across all involved affected tissues or if each manifestation has a distinct underlying pathology.

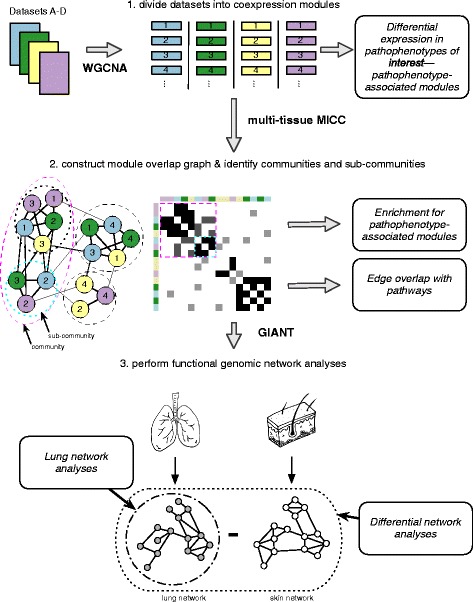
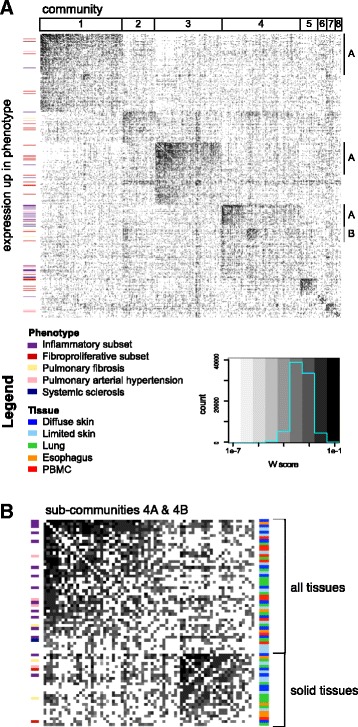
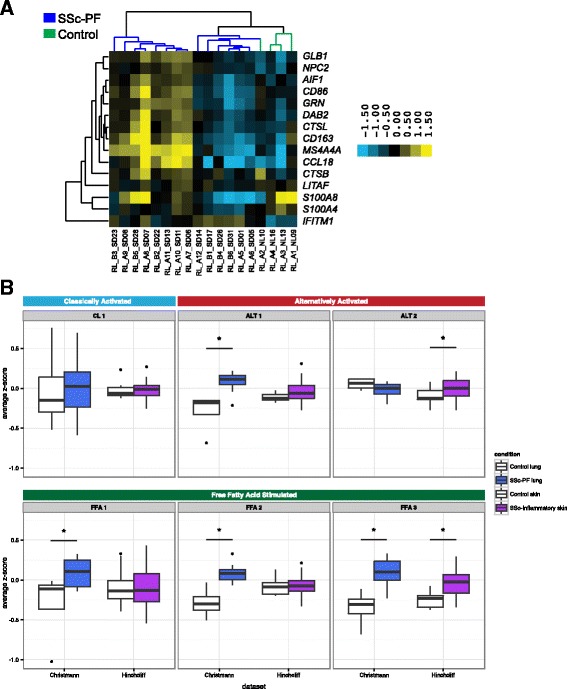
Methods: We used consensus clustering to compare gene expression profiles of biopsies from four SSc-affected tissues (skin, lung, esophagus, and peripheral blood) from patients with SSc, and the related conditions pulmonary fibrosis (PF) and pulmonary arterial hypertension, and derived a consensus disease-associate signature across all tissues. We used this signature to query tissue-specific functional genomic networks. We performed novel network analyses to contrast the skin and lung microenvironments and to assess the functional role of the inflammatory and fibrotic genes in each organ. Lastly, we tested the expression of macrophage activation state-associated gene sets for enrichment in skin and lung using a Wilcoxon rank sum test.

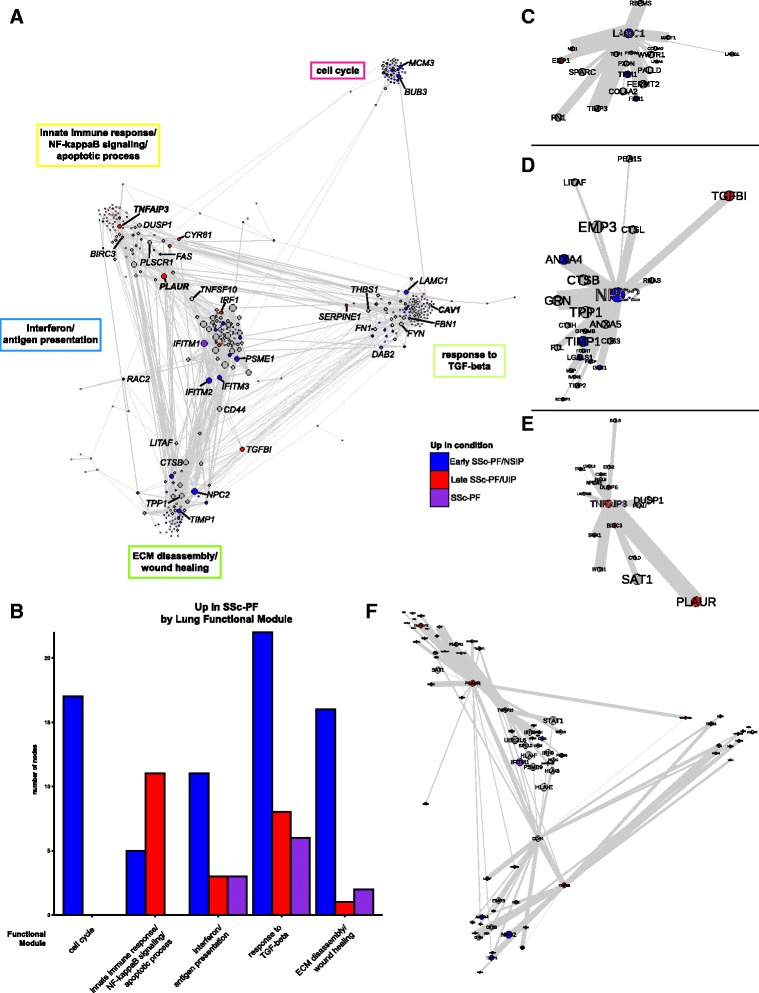
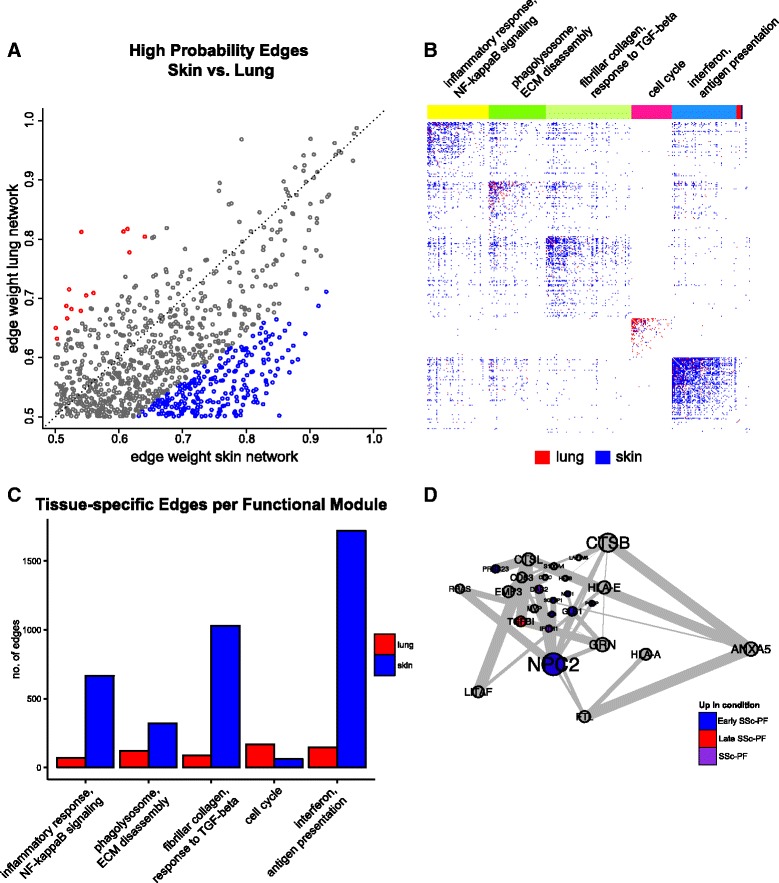
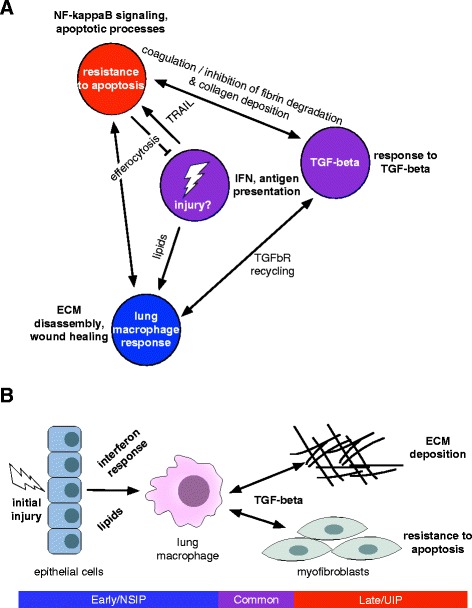
Results: We identified a common pathogenic gene expression signature-an immune-fibrotic axis-indicative of pro-fibrotic macrophages (MØs) in multiple tissues (skin, lung, esophagus, and peripheral blood mononuclear cells) affected by SSc. While the co-expression of these genes is common to all tissues, the functional consequences of this upregulation differ by organ. We used this disease-associated signature to query tissue-specific functional genomic networks to identify common and tissue-specific pathologies of SSc and related conditions. In contrast to skin, in the lung-specific functional network we identify a distinct lung-resident MØ signature associated with lipid stimulation and alternative activation. In keeping with our network results, we find distinct MØ alternative activation transcriptional programs in SSc-associated PF lung and in the skin of patients with an "inflammatory" SSc gene expression signature.

Conclusions: Our results suggest that the innate immune system is central to SSc disease processes but that subtle distinctions exist between tissues. Our approach provides a framework for examining molecular signatures of disease in fibrosis and autoimmune diseases and for leveraging publicly available data to understand common and tissue-specific disease processes in complex human diseases.

Keywords: Functional genomics; Lung disease; Macrophage; Scleroderma; Systemic sclerosis.


Figures

Fig. 1
Fig. 1
Schematic overview of the analysis pipeline. Four datasets are shown for simplicity. Each gene expression dataset was partitioned using WGCNA independently to obtain coexpression modules. Module eigengenes were tested for their differential expression in pathophenotypes of interest. Modules were compared across datasets using MICC to form the “module overlap graph” and community detection algorithms were used to identify communities and sub-communities in the graph. These communities correspond to molecular processes that are conserved across datasets. Each community was examined for enrichment of pathophenotype-associated modules and edge overlap with canonical biological pathways. Gene sets derived from these communities were used to query GIANT functional genomic networks. The resulting networks allow for tissue-specific interrogations of the gene sets. Differential network analysis was performed to compare the lung and skin networks
Fig. 2
Fig. 2
The multi-tissue module overlap graph demonstrates that severe pathophenotypes have similar underlying expression patterns. a The full adjacency matrix of the module overlap graph sorted to reveal hierarchical community structure. A darker cell color is indicative of a higher W score or larger edge weight. Communities (numbered) and sub-communities (lettered) are indicated by the annotation tracks above and on the right side of the matrix, respectively. Coexpression modules with expression that is increased in a phenotype of interest are marked by the annotation bar on the left side of the matrix. If a module was up in SSc as well as another pathophenotype of interest, the other pathophenotype color is displayed. b The adjacency matrix of sub-communities 4A and 4B indicates that these clusters contain modules that are up in all pathophenotypes of interest and show that there are many edges between the two sub-communities. Sub-community 4A contains modules from all tissues whereas 4B contains mostly solid tissue modules as indicated by the tissue annotation track to the left of the matrix
Fig. 3
Fig. 3
Genes that are overexpressed in late and early SSc-PF are distributed throughout the lung network. a The lung network shows functional connections between inflammatory and fibrotic processes. Genes in the largest connected component were clustered into functional modules using community detection. Biological processes associated with the functional modules are in boxes next to the modules. Genes are colored by whether they are overexpressed in late SSc-PF/UIP (red), early SSc-PF/NSIP (blue), both (SSc-PF, purple), or neither (grey). NSIP non-specific interstitial pneumonia, UIP usual interstitial pneumonia. Gene symbols in bold have putative SSc risk polymorphisms. Node (gene) size is determined by degree (number of functional interactions) and edge width is determined by the weight (probability of interaction between pairs of genes). The layout is determined by community membership, the strength of connections between communities, and finally the interactions between individual genes in the network. A fully labeled network is supplied as Additional file 30: Figure S3 and is intended to be viewed digitally. b Quantification of differentially expressed genes in each of the five largest functional modules. ce Hubs of the consensus lung network; only the first neighbors of the hub that are in the same functional module are shown. c LAMC1 is a hub of the response to TGF-beta module. d NPC2 is a hub of the ECM disassembly, wound healing module. e TNFAIP3 is a hub of the innate immune response, NF-κB signaling, and apoptotic processes module. f Bridges of the consensus lung network. First neighbors of PLAUR, CD44, TNFSF10, and TGFBI are shown
Fig. 4
Fig. 4
The lung and skin network structures indicate distinct tissue microenvironments influence fibrosis. The skin and lung networks were compared by first finding the giant component of the lung network and then collapsing to nodes only found in both the skin and lung networks (which are termed the common skin and common lung networks). a A scatterplot of high probability edges (>0.5 in both networks) illustrates that pairs of genes with a higher probability of interacting in skin than lung exist and vice versa. Edges are colored red if the weight (probability) is 1.25 times higher in lung or blue if it is 1.25 times higher in skin. b The differential adjacency matrix where a cell is colored if the edge weight in a given tissue is over and above the weight in the global average and tissue comparator networks. For instance, a cell is red if the edge weight was positive following the successive subtraction of the global average weight and skin weight. Community detection was performed on the common lung network to identify functional modules; common functional modules largely recapitulate modules from the full lung network. Representative processes that modules are annotated to are above the adjacency matrix. The annotation track indicates a gene’s functional module membership. Nodes (genes) are ordered within their community by common lung within community degree. A fully labeled heatmap is supplied as Additional file 30: Figure S4 and is intended to be viewed digitally. c Quantification of tissue-specific interactions in each of the five largest functional modules. d The lung-resident MØ module found in the differential lung network (consists only of edges in red in b)
Fig. 5
Fig. 5
Evidence for alternative activation of MØs in SSc-PF lung that is distinct from SSc skin. a Genes identified by differential network analysis and inferred to be indicative of lung-resident MØs are correlated with canonical markers of alternatively activated MØs such as CCL18 and CD163 in the Christmann dataset. b Summarized expression values (mean standardized expression value) of gene sets (coexpression modules) upregulated in various MØ states from the Christmann and Hinchcliff datasets: module CL1, classic activation (IFN-γ); modules ALT 1 and 2, alternative activation (IL-4, IL-13); modules FFA 1, 2, and 3, treatment with free fatty acids. FFA free fatty acid. Modules from [34]. Asterisks (*) indicate significant differences (p < 0.05)
Fig. 6
Fig. 6
Overview of SSc-PF disease processes. a Network-centric overview. b Cell type-centric overview

References

    1. Greene CS, Krishnan A, Wong AK, Ricciotti E, Zelaya RA, Himmelstein DS, Zhang R, Hartmann BM, Zaslavsky E, Sealfon SC, Chasman DI, FitzGerald GA, Dolinski K, Grosser T, and Troyanskaya OG. Understanding multicellular function and disease with human tissue-specific networks. Nat Genet. 2015;47:569–576. - PMC - PubMed
    1. Gross AM, Ideker T. Molecular networks in context. Nat Biotechnol. 2015;33(7):720–1. doi: 10.1038/nbt.3283. - DOI - PubMed
    1. Hofree M, Shen JP, Carter H, Gross A, Ideker T. Network-based stratification of tumor mutations. Nat Methods. 2013;10(11):1108–15. doi: 10.1038/nmeth.2651. - DOI - PMC - PubMed
    1. Chen S, Wang Q, Wu Z, Li Y, Li P, Sun F, Zheng W, Wu Q, Wu C, Deng C, Zhang F, Li Y. Genetic association study of TNFAIP3, IFIH1, IRF5 polymorphisms with polymyositis/dermatomyositis in Chinese Han population. PLoS One. 2014;9(10) doi: 10.1371/journal.pone.0110044. - DOI - PMC - PubMed
    1. Chen JC, Cerise JE, Jabbari A, Clynes R, Christiano AM. Master regulators of infiltrate recruitment in autoimmune disease identified through network-based molecular deconvolution. Cell Syst. 2015;1(5):326–37. doi: 10.1016/j.cels.2015.11.001. - DOI - PMC - PubMed

Publication types