. 2017 May 12;292(19):7971-7983.
doi: 10.1074/jbc.M117.776179. Epub 2017 Mar 22.

Molecular mechanisms of isocitrate dehydrogenase 1 (IDH1) mutations identified in tumors: The role of size and hydrophobicity at residue 132 on catalytic efficiency

Affiliations

Molecular mechanisms of isocitrate dehydrogenase 1 (IDH1) mutations identified in tumors: The role of size and hydrophobicity at residue 132 on catalytic efficiency

Diego Avellaneda Matteo et al. J Biol Chem. .

Abstract

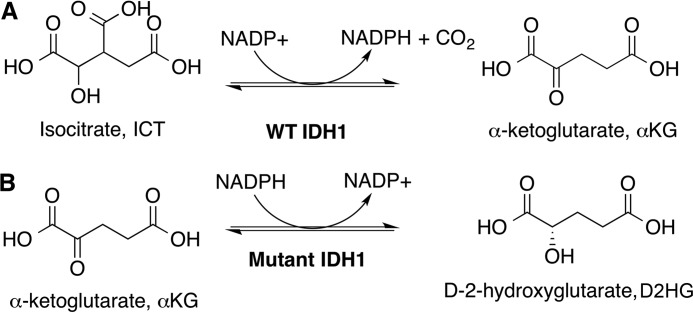
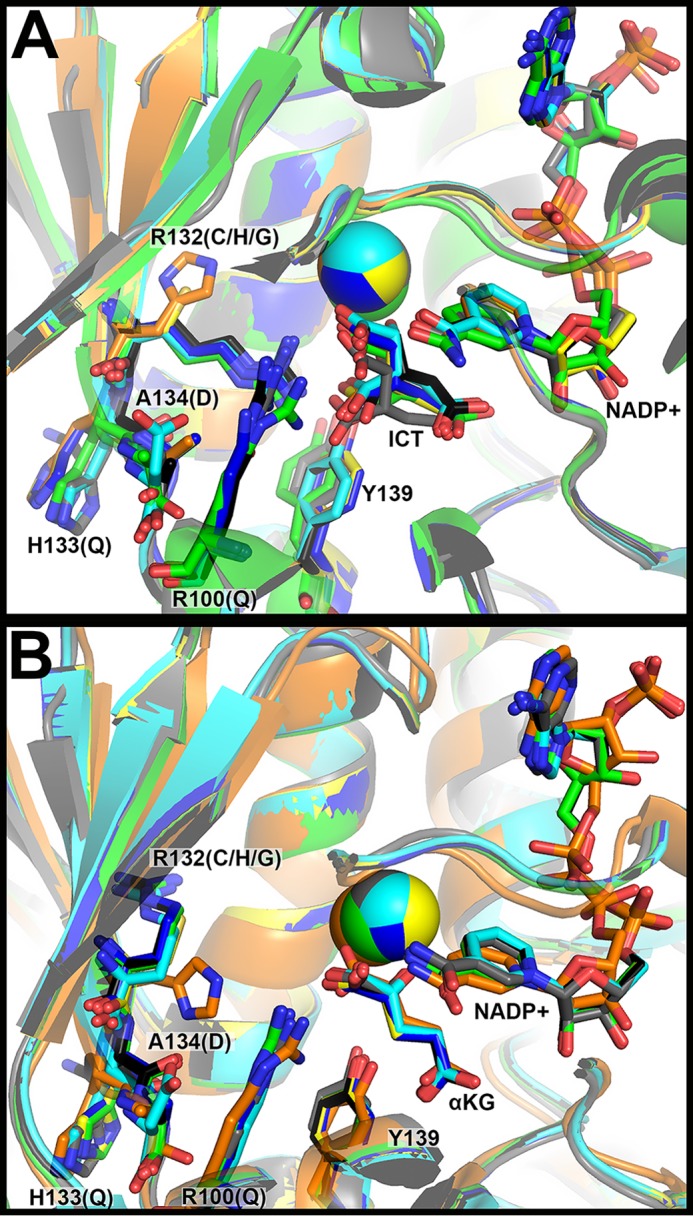
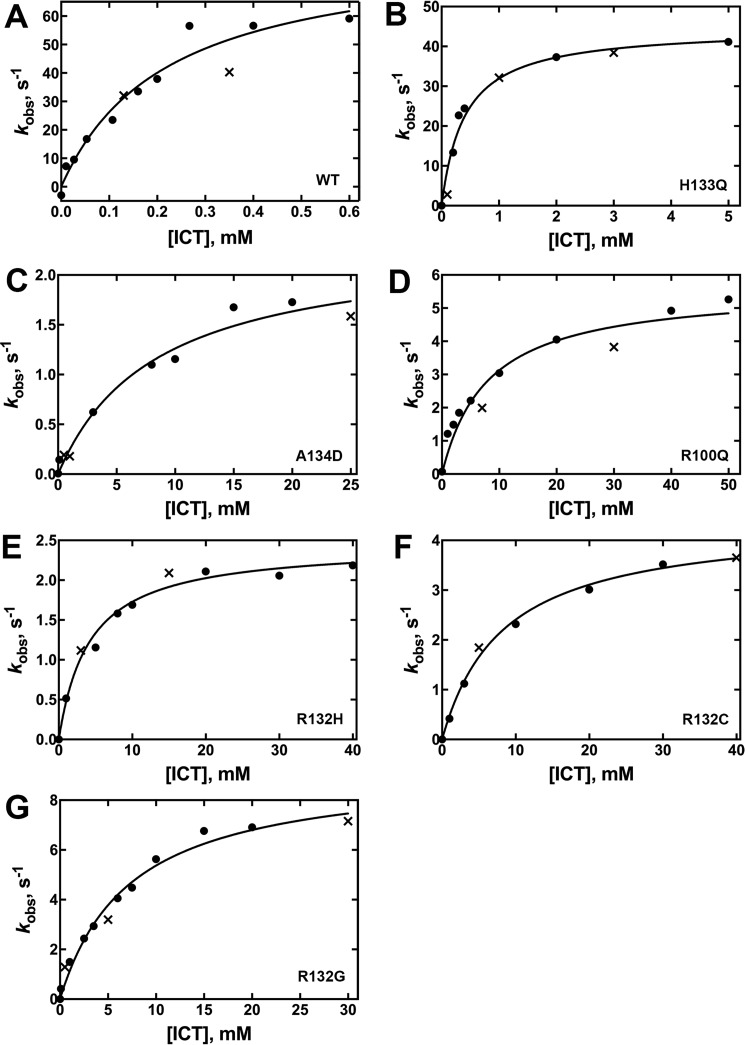
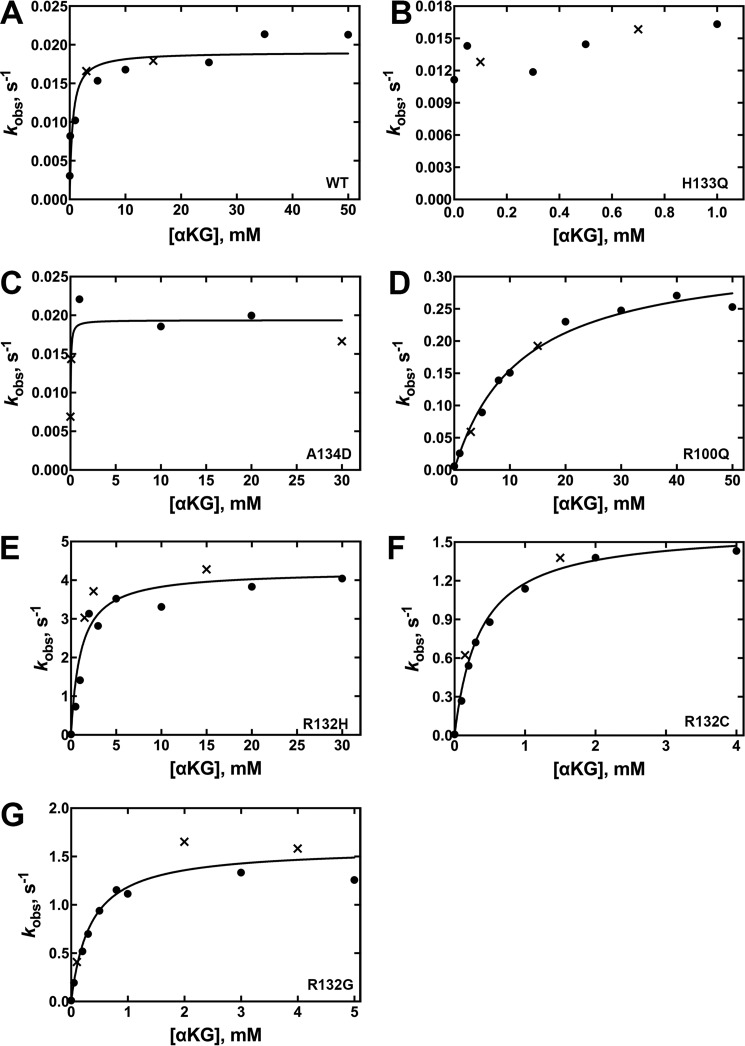
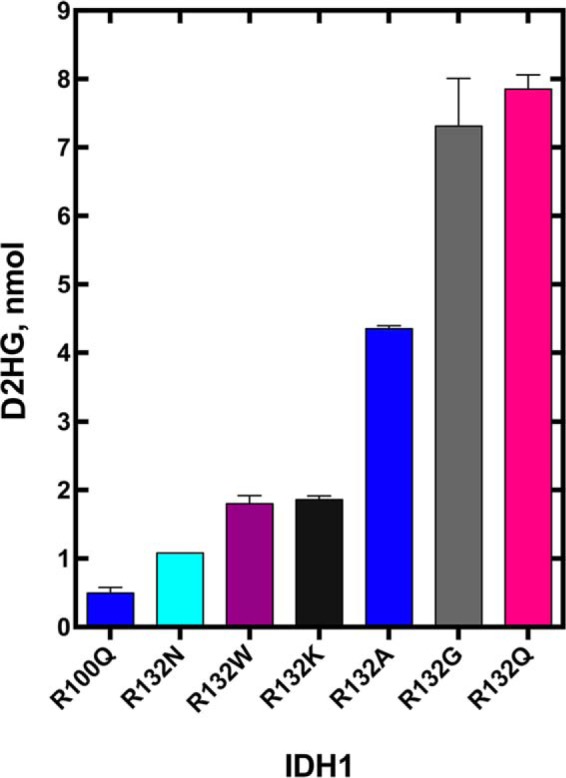
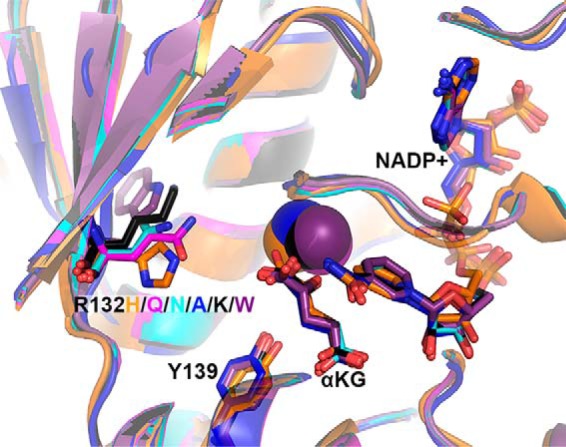
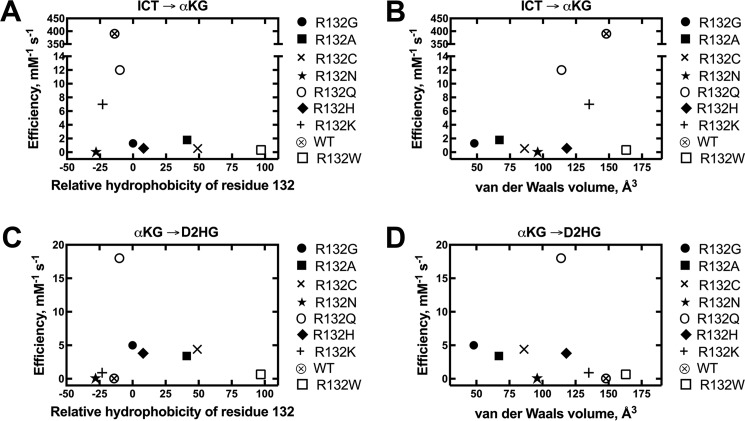
Isocitrate dehydrogenase 1 (IDH1) catalyzes the reversible NADP+-dependent conversion of isocitrate (ICT) to α-ketoglutarate (αKG) in the cytosol and peroxisomes. Mutations in IDH1 have been implicated in >80% of lower grade gliomas and secondary glioblastomas and primarily affect residue 132, which helps coordinate substrate binding. However, other mutations found in the active site have also been identified in tumors. IDH1 mutations typically result in a loss of catalytic activity, but many also can catalyze a new reaction, the NADPH-dependent reduction of αKG to d-2-hydroxyglutarate (D2HG). D2HG is a proposed oncometabolite that can competitively inhibit αKG-dependent enzymes. Some kinetic parameters have been reported for several IDH1 mutations, and there is evidence that mutant IDH1 enzymes vary widely in their ability to produce D2HG. We report that most IDH1 mutations identified in tumors are severely deficient in catalyzing the normal oxidation reaction, but that D2HG production efficiency varies among mutant enzymes up to ∼640-fold. Common IDH1 mutations have moderate catalytic efficiencies for D2HG production, whereas rarer mutations exhibit either very low or very high efficiencies. We then designed a series of experimental IDH1 mutants to understand the features that support D2HG production. We show that this new catalytic activity observed in tumors is supported by mutations at residue 132 that have a smaller van der Waals volume and are more hydrophobic. We report that one mutation can support both the normal and neomorphic reactions. These studies illuminate catalytic features of mutations found in the majority of patients with lower grade gliomas.

Keywords: brain tumor; enzyme kinetics; enzyme mechanism; enzyme mutation; tumor metabolism.


Conflict of interest statement

The authors declare that they have no conflicts of interest with the contents of this article

Figures

Figure 1.
Figure 1.
WT and mutant IDH1 catalytic activities. Shown are the: A, normal oxidative decarboxylation, and B, the neomorphic reduction.
Figure 2.
Figure 2.
Structural modeling of IDH1 mutations identified in tumors. A, the structure of WT IDH1 complexed with ICT, NADP+, and Ca2+ (PDB 1T0L (33)) and B, R132H IDH1 complexed with αKG, NADP+, and Ca2+ (PDB 4KZO (27)) were used to model additional mutations. In both panels, WT IDH1 is shown in green, A134D in cyan, H133Q in black, R100Q in dark blue, R132H in orange, R132C in yellow, and R132G in gray. Substrates and residues that are mutated are highlighted in stick format, as well as catalytic residue Tyr-139. Ca2+ is shown as a sphere. Ligand restraint generation and optimization of provided cif files were generated using eLBOW in the Phenix software suite (35), and mutations were made using Coot (54). Geometry Minimization (Phenix software suite) (35) was used to regularize geometries of the models, with 500 iterations and 5 macro cycles.
Figure 3.
Figure 3.
Concentration dependence of the ICT concentration on the observed rate of NADPH production in the normal reaction (37 °C). The determined kobs values were obtained from two different enzyme preparations to ensure reproducibility. The kobs values resulting from each of the two enzyme preparations are distinguished by using either a circle or an × in the plots. The observed rate constants (kobs) were calculated from the linear range of the slopes of plots of concentration versus time using GraphPad Prism software (GraphPad, San Diego, CA). These kobs values were then fit to a hyperbolic equation to generate kcat and Km values, and the standard error listed in Table 1 results from the deviance from these hyperbolic fits is indicated. The determined kobs values were obtained from two different enzyme preparations to ensure reproducibility. Results from assays at 21 °C are shown in supplemental Fig. S3. A, WT IDH1. B, H133Q IDH1. C, A134D IDH1. D, R100Q IDH1. E, R132H IDH1. F, R132C IDH1. G, R132G IDH1.
Figure 4.
Figure 4.
Concentration dependence of αKG concentration on the observed rate of NADPH depletion in the neomorphic reaction (37 °C). The determined kobs values were obtained from two different enzyme preparations to ensure reproducibility. The kobs values resulting from each of the two enzyme preparations are distinguished by using either a circle or an × in the plots. The observed rate constants (kobs) were calculated from the linear range of the slopes of plots of concentration versus time using GraphPad Prism software (GraphPad). These kobs values were then fit to a hyperbolic equation to generate kcat and Km values, and the S.E. results from the deviance from these hyperbolic fits is indicated. Km values and efficiency are in terms of [αKG]. Due to limits of detection, Km values could not be obtained for low efficiency IDH1 enzymes because only saturating kobs rates could be detected. In this case, kobs rates are reported, which approximate kcat rates. Results from assays at 21 °C are shown in supplemental Fig. S4. A, WT IDH1. B, H133Q IDH1. D, R100Q IDH1. E, R132H IDH1. F, R132C IDH1. G, R132G IDH1.
Figure 5.
Figure 5.
Absolute quantitation of D2HG present in an incubation of IDH1 mutants with αKG and NADPH. Measurements are reported as a calculated mean ± S.E. Only trace amounts of ICT (<0.1 nmol, based on limits of detection) were generated under these experimental conditions, indicating that NADPH oxidation was coupled to D2HG production, rather than ICT production.
Figure 6.
Figure 6.
Structural models of experimental IDH1 mutants. The structure of R132H IDH1 complexed with αKG, NADP+, and Ca2+ (PDB 4KZO (27)) was used to model mutations of the tool IDH1 mutations. R132H IDH1 is shown in orange, R132Q in magenta, R132N in cyan, R132A in dark blue, R132K in black, and R132W in purple. Substrates and residues that are mutated are highlighted in stick format, as well as catalytic residue Tyr-139. Ca2+ is shown as a sphere. Ligand restraint generation and optimization of provided cif files were generated using eLBOW in the Phenix software suite (35), and mutations were made using Coot (54). Geometry Minimization (Phenix software suite) (35) was used to regularize geometries of the models, with 500 iterations and 5 macro cycles.
Figure 7.
Figure 7.
Comparisons of catalytic efficiency by IDH1 with mutations at residue 132. The observed rate constants (kobs) were calculated from the linear range of the slopes of plots of concentration versus time, and then fit to a hyperbolic equation to generate kcat and Km values. All experiments were performed at 37 °C. These catalytic parameters result from fits of kinetic data resulting from two different enzyme preparations to ensure reproducibility. A, relative catalytic efficiencies (kcat/Km) of the conversion of ICT to αKG using Km values for ICT are plotted against relative hydrophobicity (43). B, relative catalytic efficiencies (kcat/Km) of the conversion of ICT to αKG using Km values for ICT are plotted against van der Waals volume (44). C, relative catalytic efficiencies (kcat/Km) of the conversion of αKG to D2HG using Km values for αKG are plotted against relative hydrophobicity (43). D, relative catalytic efficiencies (kcat/Km) of the conversion of αKG to D2HG using Km values for αKG are plotted against van der Waals volume (44).

References

    1. Warburg O. (1925) Über den Stoffwechsel der Carcinomzelle. Klin. Wochenschr. 4, 534–536
    1. Warburg O. (1956) Origin of cancer cells. Oncologia 9, 75–83 - PubMed
    1. Racker E. (1972) Bioenergetics and the problem of tumor growth. Am. Sci. 60, 56–63 - PubMed
    1. Parsons D. W., Jones S., Zhang X., Lin J. C., Leary R. J., Angenendt P., Mankoo P., Carter H., Siu I. M., Gallia G. L., Olivi A., McLendon R., Rasheed B. A., Keir S., Nikolskaya T., et al. (2008) An integrated genomic analysis of human glioblastoma multiforme. Science 321, 1807–1812 - PMC - PubMed
    1. Balss J., Meyer J., Mueller W., Korshunov A., Hartmann C., and von Deimling A. (2008) Analysis of the IDH1 codon 132 mutation in brain tumors. Acta Neuropathol. 116, 597–602 - PubMed

Publication types

LinkOut - more resources