. 2017 Apr 26;37(17):4450-4461.
doi: 10.1523/JNEUROSCI.2446-16.2017. Epub 2017 Mar 22.

Electrocorticographic Dynamics as a Novel Biomarker in Five Models of Epileptogenesis

Affiliations

Electrocorticographic Dynamics as a Novel Biomarker in Five Models of Epileptogenesis

Dan Z Milikovsky et al. J Neurosci. .

Abstract

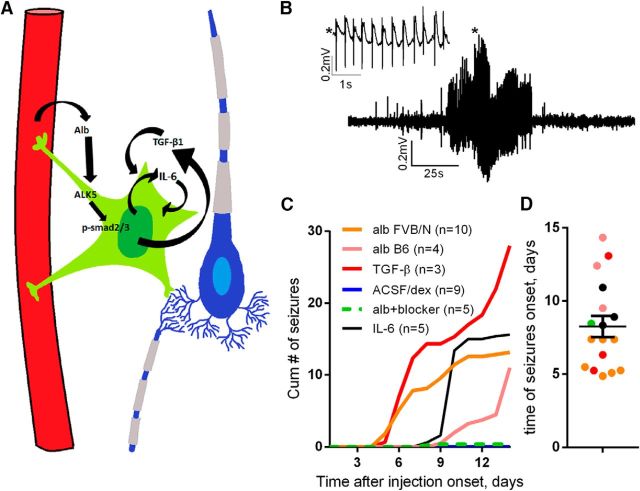
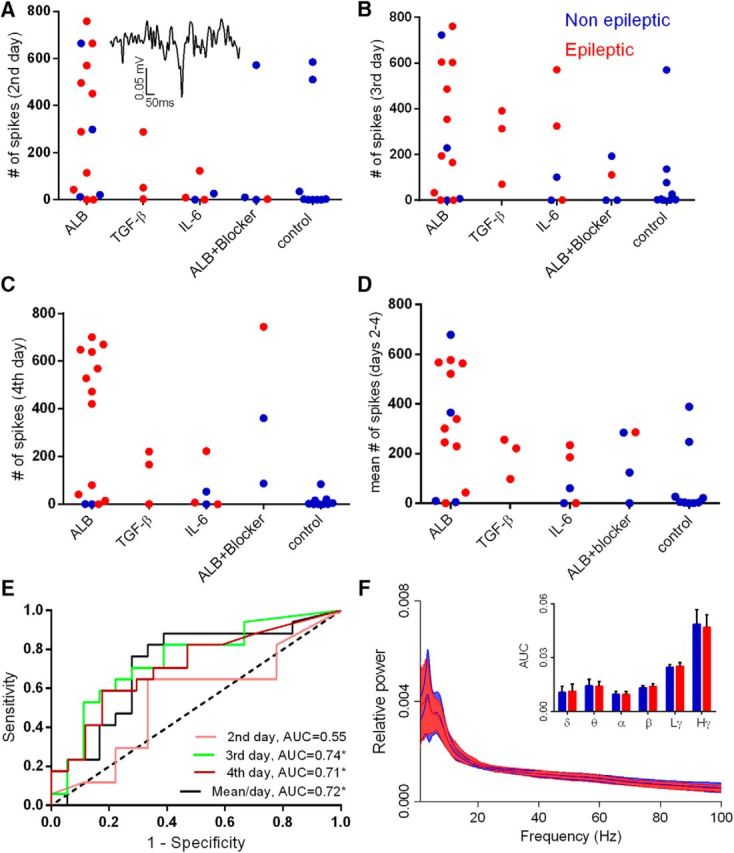
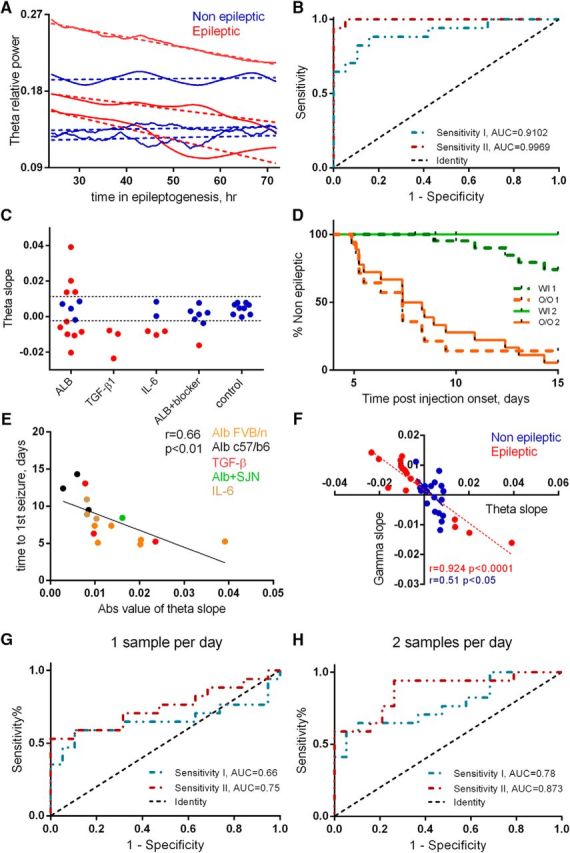
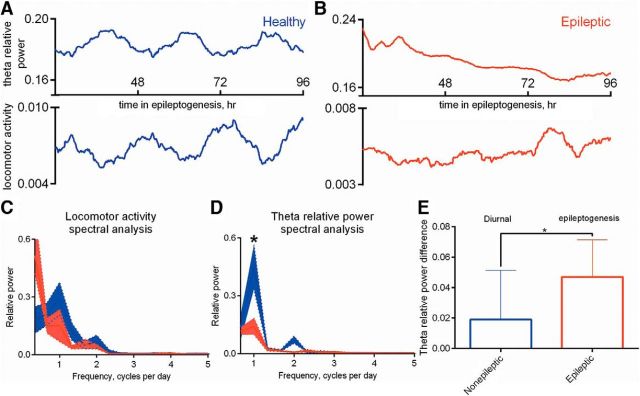
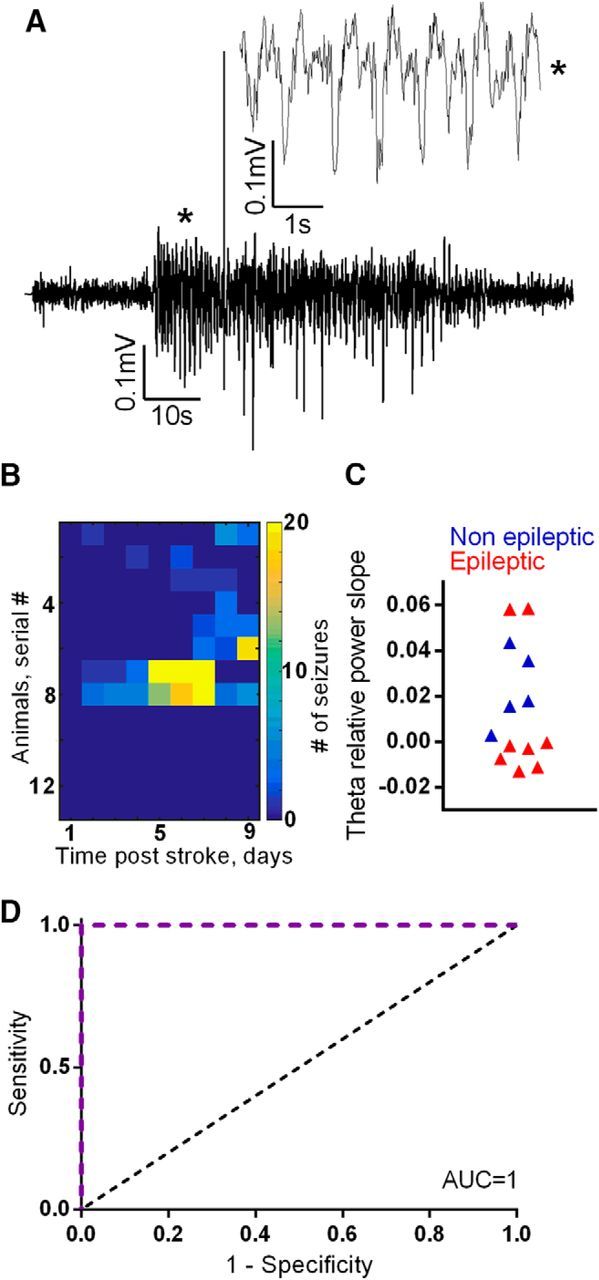
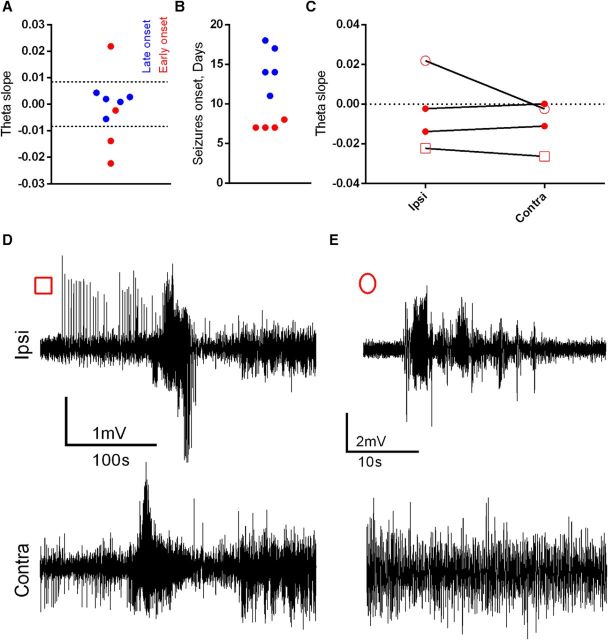
Postinjury epilepsy (PIE) is a devastating sequela of various brain insults. While recent studies offer novel insights into the mechanisms underlying epileptogenesis and discover potential preventive treatments, the lack of PIE biomarkers hinders the clinical implementation of such treatments. Here we explored the biomarker potential of different electrographic features in five models of PIE. Electrocorticographic or intrahippocampal recordings of epileptogenesis (from the insult to the first spontaneous seizure) from two laboratories were analyzed in three mouse and two rat PIE models. Time, frequency, and fractal and nonlinear properties of the signals were examined, in addition to the daily rate of epileptiform spikes, the relative power of five frequency bands (theta, alpha, beta, low gamma, and high gamma) and the dynamics of these features over time. During the latent pre-seizure period, epileptiform spikes were more frequent in epileptic compared with nonepileptic rodents; however, this feature showed limited predictive power due to high inter- and intra-animal variability. While nondynamic rhythmic representation failed to predict epilepsy, the dynamics of the theta band were found to predict PIE with a sensitivity and specificity of >90%. Moreover, theta dynamics were found to be inversely correlated with the latency period (and thus predict the onset of seizures) and with the power change of the high-gamma rhythm. In addition, changes in theta band power during epileptogenesis were associated with altered locomotor activity and distorted circadian rhythm. These results suggest that changes in theta band during the epileptogenic period may serve as a diagnostic biomarker for epileptogenesis, able to predict the future onset of spontaneous seizures.SIGNIFICANCE STATEMENT Postinjury epilepsy is an unpreventable and devastating disorder that develops following brain injuries, such as traumatic brain injury and stroke, and is often associated with neuropsychiatric comorbidities. As PIE affects as many as 20% of brain-injured patients, reliable biomarkers are imperative before any preclinical therapeutics can find clinical translation. We demonstrate the capacity to predict the epileptic outcome in five different models of PIE, highlighting theta rhythm dynamics as a promising biomarker for epilepsy. Our findings prompt the exploration of theta dynamics (using repeated electroencephalographic recordings) as an epilepsy biomarker in brain injury patients.

Keywords: EEG; biomarker; epilepsy; epileptogenesis; stroke; traumatic brain injury.


Figures

Figure 1.
Figure 1.
Mechanism-based models of PIE. A, The mechanisms mediating epileptogenesis in the studied PIE models include the following: serum albumin (Alb) extravasation (in regions with dysfunctional BBB) → activation of astrocytic TGF-β receptors → alk5-mediated smad2/3 phosphorylation → transcriptional inflammatory changes promoting further TGF-β1 and IL-6 secretion → reorganization of the neural network → spontaneous seizures. B, A representative spontaneous seizure, as recorded in a mouse treated intraventricularly with albumin. C, Plot of the accumulating number of seizures per day in the six treatment groups demonstrates a minimum duration of 4 d as the epileptogenic period. D, Distribution of seizure onsets in the different models. dex, Dextran; B6, C57BL/6.
Figure 2.
Figure 2.
Spike rate and nondynamic representation of brain rhythms do not predict epilepsy. A–C, The daily rate of epileptiform spikes (see inset) for each animal calculated for days 2, 3, and 4 after treatment initiation in each treatment group. D, Mean number of spikes per day for each animal. E, ROC analysis reveals AUCs up to 0.74 for days 3 and 4 and the mean of days 2–4, with only a 0.55 AUC for day 2 (not significantly different from randomized classification; AUC of 0.5 dotted black line). F, Spectral analysis during the fourth day shows no significant differences in the tested frequency bands when comparing epileptic to nonepileptic animals. Solid lines represent the mean value, and background color depicts the SD. Dex, Dextran; ALB, albumin; Lγ, low gamma; Hγ, high gamma.
Figure 3.
Figure 3.
Theta dynamics as a biomarker for epilepsy. A, Theta activity during the epileptogenic period from representative epileptic and nonepileptic animals (N = 3 in both groups). The smoothed raw traces and the corresponding linear fits are represented by continuous vs dashed lines, respectively. B, ROC analysis was used to assess the predictive potential of two measures of theta dynamics: absolute value of the slope (sensitivity I: AUC = 0.9102, p < 0.0001) and the distance of each slope from the mean slope of control group (sensitivity II: AUC = 0.9969, p < 0.0001). The dotted black line indicates an AUC of 0.5, a reference to randomized classification. C, Slopes of theta activity, superimposed on the margins of the safety range (dashed lines) calculated based on the OOP of sensitivity II. D, Kaplan–Meier analysis shows a significant difference between the OOP-classified groups (p < 0.0001, based on sensitivity I or II). W/I, Within safety range; O/O, out of safety range. E, Theta slopes are inversely correlated with the duration of the epileptogenic period (N = 17, r = 0.66, p = 0.0036). F, Theta and high-gamma slopes are inversely correlated in both epileptic (N = 17, r = 0.924, p < 0.0001) and nonepileptic (N = 19, r = 0.51, p = 0.021) animals. dex, Dextran. G, ROC analyses of a single sample per day (1-h-long segment): AUC = 0.66 (p = 0.1 CI = 0.46–0.86) and AUC = 0.75 (p = 0.018, CI = 0.58–0.92), respectively, to sensitivity I and II. H, ROC analyses of two samples per day (1-h-long segment, every 12 h) AUC = 0.78 (p = 0.004, CI = 0.63–0.94) and AUC = 0.873 (p = 0.0001, CI = 0.76–0.99).
Figure 4.
Figure 4.
Circadian rhythm is disturbed during epileptogenesis. A, B, Representative examples of smoothed theta relative power and locomotor activity signals in nonepileptic mice (A) or in mice undergoing epileptogenesis (B). C, D, Comparison of FFT analysis applied over the locomotor activity (C) and theta relative power (D) signals plotted in A and B between nonepileptic mice (N = 8) and mice undergoing epileptogenesis (N = 8). Comparison of the mean pick-to-pick theta relative power difference among nonepileptic animals (N = 8) and the difference between the start and end of epileptogenesis among animals undergoing epileptogenesis. E, Presented are the median values plus the range. *p = 0.0378.
Figure 5.
Figure 5.
Theta dynamics as a biomarker for epilepsy in a stroke model of PIE. A, An example of a hippocampal seizure in a model of poststroke epilepsy. B, A heat map of daily seizure rates shows that 5 of the 14 stroke animals remained nonepileptic throughout the recorded period. Among the epileptic animals, the seizure-free period ranged between 1 and 7 d. C, D, Theta slopes (during the first 24 h from treatment initiation) of nonepileptic animals fall within a distinctive range (C), the distance from which can accurately classify disease outcome, as evidenced in the ROC analysis (D), revealing an AUC of 1 (p = 0.003). The dotted black line indicates an AUC of 0.5, a reference to randomized classification.
Figure 6.
Figure 6.
Theta dynamics as a biomarker for epilepsy in an EISE model of PIE. A, B, The k-means classification (dashed lines) of theta slopes (as recorded from the electrode ipsilateral to stimulation (A) resulted in a division corresponding to the latency of the epileptogenic period (B), with higher absolute slopes associated with earlier epilepsy onsets, whereas slow theta changes corresponded to slower disease development (p = 0.035). C, Comparison of ipsilateral and contralateral theta slopes in early-onset animals highlights one animal (outlined circle) with remarkably different values between the two hemispheres. D, E, Interestingly, this animal (E) also had evident differences in intrahemispheric seizure propagation compared with an animal with relatively consistent slopes [D (outlined square in C)].

Comment in

  • Theta is the New Alpha.
    Velíšek L. Velíšek L. Epilepsy Curr. 2017 Sep-Oct;17(5):314-316. doi: 10.5698/1535-7597.17.5.314. Epilepsy Curr. 2017. PMID: 29225550 Free PMC article. No abstract available.

References

    1. Adeli H, Zhou Z, Dadmehr N (2003) Analysis of EEG records in an epileptic patient using wavelet transform. J Neurosci Methods 123:69–87. 10.1016/S0165-0270(02)00340-0 - DOI - PubMed
    1. Aeschbach D, Matthews JR, Postolache TT, Jackson MA, Giesen HA, Wehr TA (1997) Dynamics of the human EEG during prolonged wakefulness: evidence for frequency-specific circadian and homeostatic influences. Neurosci Lett 239:121–124. 10.1016/S0304-3940(97)00904-X - DOI - PubMed
    1. Arabadzisz D, Antal K, Parpan F, Emri Z, Fritschy JM (2005) Epileptogenesis and chronic seizures in a mouse model of temporal lobe epilepsy are associated with distinct EEG patterns and selective neurochemical alterations in the contralateral hippocampus. Exp Neurol 194:76–90. 10.1016/j.expneurol.2005.01.029 - DOI - PubMed
    1. Bankstahl M, Müller CJ, Wilk E, Schughart K, Löscher W (2012) Generation and characterization of pilocarpine-sensitive C57BL/6 mice as a model of temporal lobe epilepsy. Behav Brain Res 230:182–191. 10.1016/j.bbr.2012.02.004 - DOI - PubMed
    1. Bar-Klein G, Cacheaux LP, Kamintsky L, Prager O, Weissberg I, Schoknecht K, Cheng P, Kim SY, Wood L, Heinemann U, Kaufer D, Friedman A (2014) Losartan prevents acquired epilepsy via TGF-β signaling suppression. Ann Neurol 75:864–875. 10.1002/ana.24147 - DOI - PMC - PubMed

Publication types