. 2017 Apr 19;37(16):4381-4390.
doi: 10.1523/JNEUROSCI.4601-15.2017. Epub 2017 Mar 22.

Linear Summation of Repulsive and Attractive Serial Dependencies: Orientation and Motion Dependencies Sum in Motion Perception

Affiliations

Linear Summation of Repulsive and Attractive Serial Dependencies: Orientation and Motion Dependencies Sum in Motion Perception

David Alais et al. J Neurosci. .

Abstract

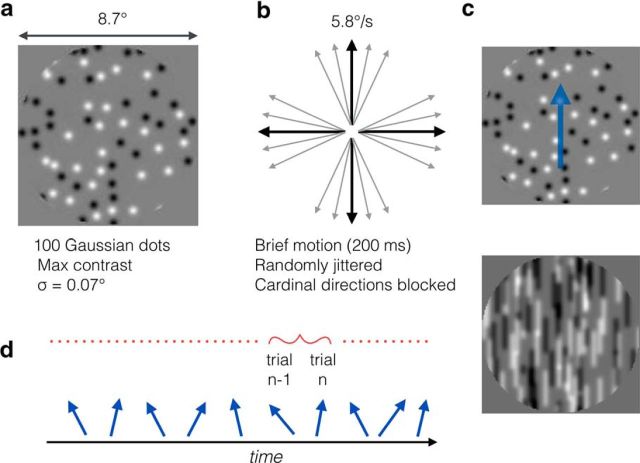
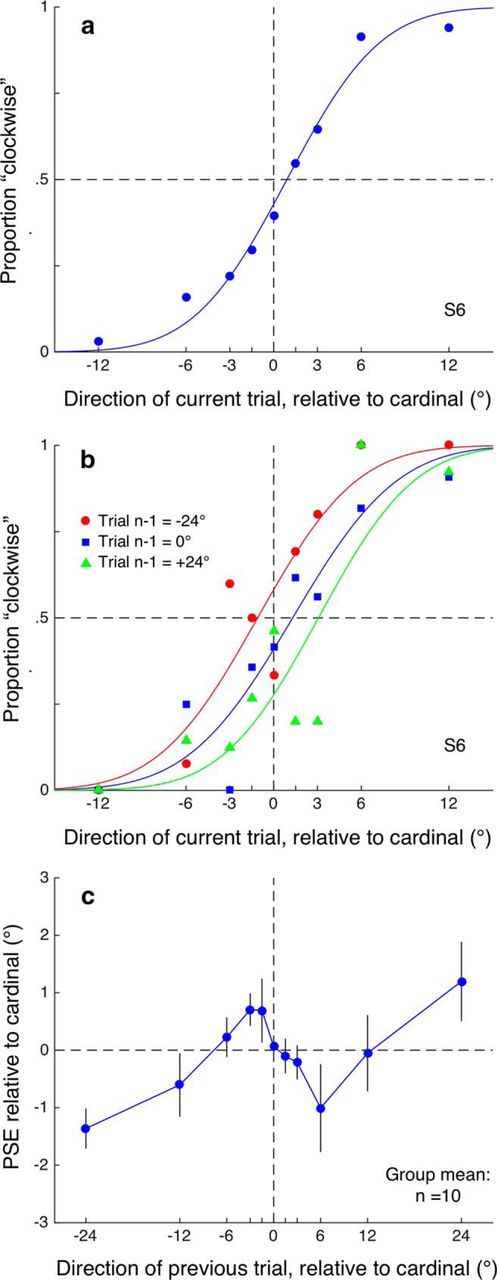
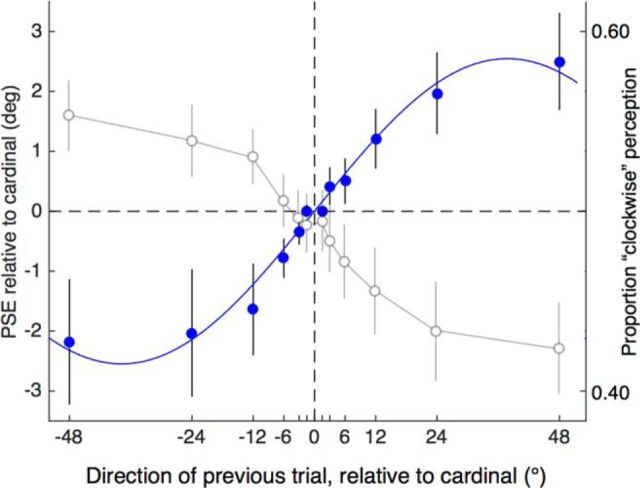
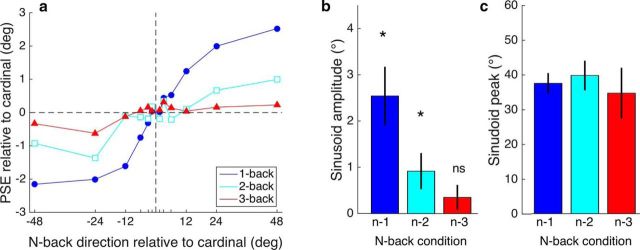
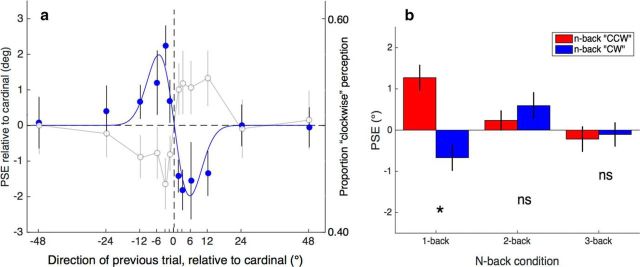
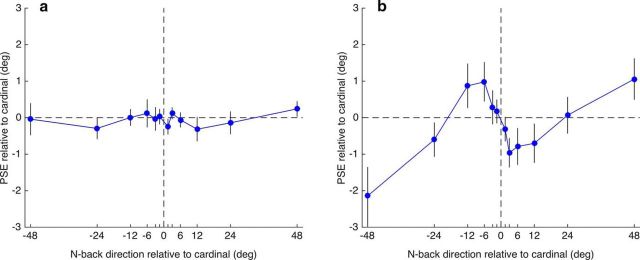
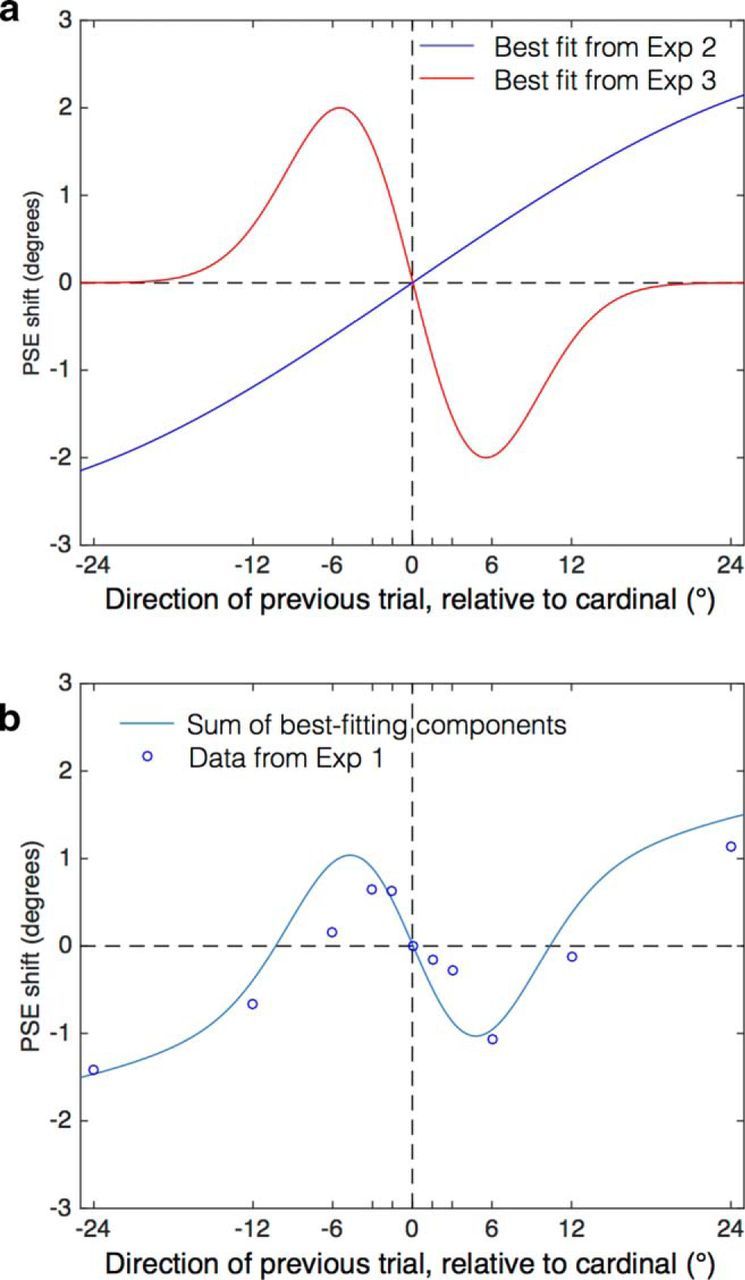
Recent work from several groups has shown that perception of various visual attributes in human observers at a given moment is biased toward what was recently seen. This positive serial dependency is a kind of temporal averaging that exploits short-term correlations in visual scenes to reduce noise and stabilize perception. To date, this stabilizing "continuity field" has been demonstrated on stable visual attributes such as orientation and face identity, yet it would be counterproductive to apply it to dynamic attributes in which change sensitivity is needed. Here, we tested this using motion direction discrimination and predict a negative perceptual dependency: a contrastive relationship that enhances sensitivity to change. Surprisingly, our data showed a cubic-like pattern of dependencies with positive and negative components. By interleaving various stimulus combinations, we separated the components and isolated a positive perceptual dependency for motion and a negative dependency for orientation. A weighted linear sum of the separate dependencies described the original cubic pattern well. The positive dependency for motion shows an integrative perceptual effect and was unexpected, although it is consistent with work on motion priming. These findings suggest that a perception-stabilizing continuity field occurs pervasively, occurring even when it obscures sensitivity to dynamic stimuli.SIGNIFICANCE STATEMENT Recent studies show that visual perception at a given moment is not entirely veridical, but rather biased toward recently seen stimuli: a positive serial dependency. This temporal smoothing process helps perceptual continuity by preserving stable aspects of the visual scene over time, yet, for dynamic stimuli, temporal smoothing would blur dynamics and reduce sensitivity to change. We tested whether this process is selective for stable attributes by examining dependencies in motion perception. We found a clear positive dependency for motion, suggesting that positive perceptual dependencies are pervasive. We also found a concurrent negative (contrastive) dependency for orientation. Both dependencies combined linearly to determine perception, showing that the brain can calculate contrastive and integrative dependencies simultaneously from recent stimulus history when making perceptual decisions.

Keywords: adaptation; motion perception; motion streaks; sequential dependency; serial dependency.


Figures

Figure 1.
Figure 1.
Methods and stimuli used in these experiments. a, Motion stimuli were 100 Gaussian profile luminance blobs at maximum contrast, with 50 having positive and 50 having negative contrast. b, Blobs translated rigidly for 200 ms in a direction that was jittered around a cardinal direction. Cardinal directions were blocked and presented in random order and jitter around the cardinal was randomly sampled from a set of directions: ±1.5°, ±3°, ±6°, ±12°, ±24°, and ±48° (Experiments 2, 3, and 4), or 0°, ±1.5°, ±3°, ±6°, ±12°, and ±24° (Experiment 1). c, Due to temporal integration, fast-moving random-dot patterns leave oriented trails that can be encoded by orientation-selective mechanisms. In this example, a translating random-dot pattern has been linearly integrated over 100 ms. The summed motion frames take on a streaky appearance with a clear but slightly noisy orientation along the motion trajectory. d, Intertrial data analysis. On each trial, participants judged if the direction was clockwise or anticlockwise of the cardinal direction. For every trial in the sequence, the response to a given trial n was binned into a category determined by the direction presented in the preceding trial n − 1.
Figure 2.
Figure 2.
Results from Experiment 1. a, Data from a single participant in Experiment 1 plotting a psychometric function obtained by pooling all trials by direction and fitting a cumulative Gaussian to the data. This is the classical approach to analyzing perceptual discrimination data and the point of subjective equality PSE (given by parameter μ) and function width (σ) are the parameters of interest. Here, the observer's perceptual bias is very small (error from true cardinal is only 0.90°) and the discrimination threshold (5.03°) shows good precision for motion discrimination. b, Intertrial analysis. Instead of pooling all responses into a single function, each response is binned into one of 11 categories depending on the direction presented on the preceding trial. Separate psychometric functions are then fitted for each of the 11 preceding directions. As shown for one observer for several levels of preceding direction (−24°, 0°, and 24°), the horizontal position of the psychometric functions varied systematically with the preceding trial's direction, indicating a sequential dependency. This dependency, typical of all observers, would tend to broaden discrimination functions calculated in the traditional manner by conflating laterally shifted functions. In all subsequent plots, only the PSEs are shown, plotted as a function of the preceding trial's direction. c, Group mean data from Experiment 1 plotting the PSE (indicating the subjective cardinal, the direction where motions are equally judged leftward or rightward of the cardinal) as a function of the preceding trial's direction. Error bars indicate ±1 SEM.
Figure 3.
Figure 3.
Group mean data from Experiment 2. Filled symbols plot the PSE for direction discrimination as a function of the preceding trial's motion direction. These data were obtained with translating dots that alternated in direction between up and down, canceling motion adaptation between trials but not orientation adaptation. The results show a strong positive relationship for between PSE and the preceding trial's direction attributable to the orientation component. The continuous line shows the best-fitting sinusoidal function with the following parameters: amplitude = 2.55°, peak = 37.8°, and r2 = 0.99. Open symbols relate to the second y-axis and show mean proportion of “perceived clockwise” responses and thus reflect the observers' perception. Each data point is the mean of all points on the psychometric function that was calculated for each preceding direction. The proportion of clockwise perception and PSE location exhibit an inverse relationship, illustrating that the positive PSE function is a negative one in perceptual terms: a repulsion effect or negative dependency. Error bars indicate ±1 SEM.
Figure 4.
Figure 4.
Group mean data from Experiment 2. a, PSE for direction discrimination as a function of the n-back trial's motion direction. The PSE shifts for the one-back direction are compared with PSEs for two-back and three-back directions. b, Data for each n-back level in a were fitted with a sinusoid function (as in Fig. 3). The amplitudes of the best-fitting functions show a strong decline to near-zero amplitude at the three-back level. Asterisks show a significant difference from zero on a one-tailed t test (α = 0.05). c, Peak of the best-fitting sinusoid is very similar across the three n-back levels. Error bars indicate ±1 SE of measurement.
Figure 5.
Figure 5.
Group mean data from Experiment 3. a, Filled symbols plot the PSE for direction discrimination as a function of the n-back trial's motion direction. These data were obtained with translating dots alternating from trial to trial with a translating grating to isolate the intertrial motion component. The results show a strong repulsive effect on PSE (cf. Fig. 3). The continuous line shows the best-fitting Gaussian first derivative with the following parameters: SD = 5.44, amplitude = 3.31, and r2 = 0.87. Open symbols show mean proportion of “perceived clockwise” responses (second y-axis). Each data point is the mean of all points on the psychometric function that was calculated for each preceding direction. The two curves illustrate that the positive PSE function is a negative one in perceptual terms: a perceptual attraction effect or positive dependency. b, As for the intertrial orientation component (Fig. 4), the amplitude of the intertrial motion component declines as the n-back level increases. Red columns show the mean PSE for all counterclockwise n-back directions and blue columns show the mean PSE for all clockwise n-back directions. Only the one-back direction had a significant effect on mean PSE. Asterisks show a significant difference between n-back directions on a two-tailed t test (α = 0.05). Error bars indicate ±1 SEM.
Figure 6.
Figure 6.
Group mean data from Experiment 4. a, Results of the first analysis examining the intertrial effect between a motion stimulus moving along a vertical trajectory and a subsequent vertical grating. The PSE for orientation discrimination is shown as a function of the previous trial's motion direction. None of the data points is significantly different from zero, indicating that adaptation to orientation signals from rapid motion stimuli does not transfer to static oriented stimuli. b, Results of the second analysis examining the intertrial effect between a vertical grating and a subsequent motion stimulus moving along a vertical trajectory. The PSE for direction discrimination is shown as a function of the previous trial's orientation and exhibits a strong cubic trend, as observed in Experiment 1, indicating that adaptation to static oriented stimuli strongly influences the perceived direction of rapid motion stimuli. Error bars indicate ±1 SEM.
Figure 7.
Figure 7.
a, Best-fitting sinusoidal function from Experiment 2 overlaid with the best-fitting Gaussian first-derivative from Experiment 3. These functions illustrate the orientation and motion components, respectively, of the rapidly translating dot stimuli. b, Data points showing the results of Experiment 1. The continuous line is the sum of the two components from a, which produces a cubic function that captures the pattern of the data. The data are well described by combining the components with a single free parameter: an amplitude weight that is applied to both components. Here, an amplitude of 0.57 is shown and provides a good fit to the data (r2 = 0.85).

References

    1. Alais D, Verstraten FA, Burr DC (2005) The motion aftereffect of transparent motion: two temporal channels account for perceived direction. Vision Res 45:403–412. 10.1016/j.visres.2004.09.005 - DOI - PubMed
    1. Alais D, Apthorp D, Karmann A, Cass J (2011) Temporal integration of movement: the time-course of motion streaks revealed by masking. PLoS One 6:e28675. 10.1371/journal.pone.0028675 - DOI - PMC - PubMed
    1. Alais D, Orchard-Mills E, Van der Burg E (2015) Auditory frequency perception adapts rapidly to the immediate past. Atten Percept Psychophys 77:896–906. 10.3758/s13414-014-0812-2 - DOI - PubMed
    1. Anstis S, Verstraten FA, Mather G (1998) The motion aftereffect. Trends Cogn Sci 2:111–117. 10.1016/S1364-6613(98)01142-5 - DOI - PubMed
    1. Apthorp D, Alais D (2009) Tilt aftereffects and tilt illusions induced by fast translational motion: evidence for motion streaks. J Vis 9:1–11. - PubMed

LinkOut - more resources