. 2017 May 1;198(9):3526-3535.
doi: 10.4049/jimmunol.1601949. Epub 2017 Mar 22.

Adaptive Immune Responses to Zika Virus Are Important for Controlling Virus Infection and Preventing Infection in Brain and Testes

Affiliations

Adaptive Immune Responses to Zika Virus Are Important for Controlling Virus Infection and Preventing Infection in Brain and Testes

Clayton W Winkler et al. J Immunol. .

Abstract

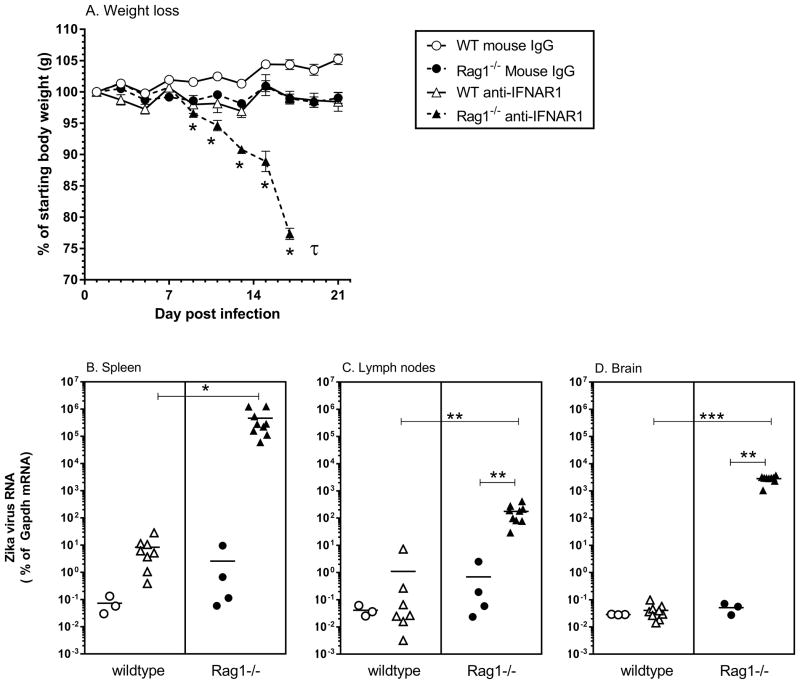
The recent association between Zika virus (ZIKV) and neurologic complications, including Guillain-Barré syndrome in adults and CNS abnormalities in fetuses, highlights the importance in understanding the immunological mechanisms controlling this emerging infection. Studies have indicated that ZIKV evades the human type I IFN response, suggesting a role for the adaptive immune response in resolving infection. However, the inability of ZIKV to antagonize the mouse IFN response renders the virus highly susceptible to circulating IFN in murine models. Thus, as we show in this article, although wild-type C57BL/6 mice mount cell-mediated and humoral adaptive immune responses to ZIKV, these responses were not required to prevent disease. However, when the type I IFN response of mice was suppressed, then the adaptive immune responses became critical. For example, when type I IFN signaling was blocked by Abs in Rag1-/- mice, the mice showed dramatic weight loss and ZIKV infection in the brain and testes. This phenotype was not observed in Ig-treated Rag1-/- mice or wild-type mice treated with anti-type I IFNR alone. Furthermore, we found that the CD8+ T cell responses of pregnant mice to ZIKV infection were diminished compared with nonpregnant mice. It is possible that diminished cell-mediated immunity during pregnancy could increase virus spread to the fetus. These results demonstrate an important role for the adaptive immune response in the control of ZIKV infection and imply that vaccination may prevent ZIKV-related disease, particularly when the type I IFN response is suppressed as it is in humans.


Figures

Fig. 1
Fig. 1. ZIKV infection induces CD4+ T cell proliferation, but not an increase in activation markers
Adult wild type mice were infected with 104 PFU of ZIKV. At 3, 7, 10, 14, and 21 dpi, spleens were removed and splenocytes analyzed by flow cytometry as described in the methods. (A) CD4+ T cells were separated into helper (Foxp3−) and regulatory (Foxp3+) cells. Examples of splenocytes from (B) mock and (C) ZIKV infected mice at 7 dpi labeled for CD43/CD69 and CD11a/Ki67 are shown. (D, E) CD4+ T cells were separated into helper (Foxp3−) and regulatory (Foxp3+) cells. The overall percentages of (E) helper T cells or (D) regulatory T cells did not change over time following ZIKV infection. (F–I) Average percentage of helper CD4+ T cells expressing (F) CD43, (G) CD69, (H) CD11a and (I) Ki67 are plotted for each time point. Mock-infected mice are shown as 0 dpi. Dotted line represents the average for mock-infected controls. Data are mean +/− SD 3–6 mice per time point and are the combined data of two experiments. Statistical analysis was completed using a One-way ANOVA with a Dunnett’s multiple comparison post-test. ***P<0.001 compared to mock.
Fig. 2
Fig. 2. ZIKV infection induces CD8+ T cell proliferation and activation
Mice described in Fig 1 were also analyzed for CD8+ T cell activation. Cells were gated for (A) CD8+ expression. Examples of splenocytes from (B) mock and (C) ZIKV infected mice at 7 dpi labeled for Ki67/CD43 and CD11a/Granzyme B are shown. The overall percentages of (D) CD8+ T cells did not change over time following ZIKV infection. (E–H) Average percentage of CD8+ T cells expressing (E) Ki67, (F) CD43, (G) CD11a and (H) GranB are plotted for each time point. Mock-infected mice are shown as 0 dpi. Data are mean ± SD 3–6 mice per time point and are the combined data of two experiments. Statistical analysis was completed using a One-way ANOVA with a Dunnett’s multiple comparison post-test. * P<0.05, ** P<0.01, ***P<0.001 compared to mock.
Fig. 3
Fig. 3. Neutralizing antibody (NAb) response to ZIKV
Plasma from mice described in Fig 1 were also analyzed for NAbs. Diluted plasma was mixed at with virus prior to plating on Vero cells in a NAb assay described in the Methods. Data are plotted as the highest dilution of plasma that inhibited virus infection by 50%. Data are shown as individual animals at 7, 14 and 21 dpi from two independent experiments. Plasma from mock-infected mice showed no inhibition of virus and were scored as 0 on the graph.
Fig. 4
Fig. 4. T cell depletion results in ZIKV-induced weight loss in wildtype mice
Wild type mice were infected with 104 PFU of ZIKV or mock supernatant and treated with anti-CD4 and anti-CD8 antibodies as described in the methods. Mice were individually weighed every 2 days. Data are plotted as the average increase/decrease in weight over time of 6 mice per group per strain. Statistical analysis was done using a two-way ANOVA with a Tukey’s multiple comparison analysis. * P<0.05, ** P<0.01, ***P<0.001 compared to vehicle control.
Fig. 5
Fig. 5. T cell depletion results in ZIKV-induced weight loss in Mavs−/− mice
Wildtype C57BL/6, Unc93b1 3D, and Mavs−/− mice were infected with 104 PFU of ZIKV and followed for either (A) splenic viral RNA, (B) weight loss or (C) NAb production. (A) At 3 and 7 dpi, spleens were removed and analyzed for viral RNA levels. Data are from 5–6 mice per group per time point. ***P<0.001 compared to wildtype control at each time point. (B) Mock and Zika-infected Mavs−/− mice were treated with anti-CD4 and anti-CD8 antibodies as described in the methods. Mice were individually weighed every 2 days. Data are plotted as the average increase/decrease in weight over time of 6 mice per group per strain. Statistical analysis was done using a two-way ANOVA with a Tukey’s multiple comparison analysis. * P<0.05, compared to vehicle control. (C) Plasma from Mavs−/− mice at 7 dpi or at the end of the weight loss experiment (25 dpi) were analyzed for neutralizing antibody as described in the Methods. Data are plotted for individual mice on a log 2 scale. No inhibition was observed in mock-infected mice indicated on the graph as a dotted line at the undiluted fraction.
Fig. 6
Fig. 6. Treatment with anti-IFNAR in Rag1−/− mice results in clinical disease and high levels of virus
(A–D) Wild type and Rag1−/− mice were infected with 104 PFU of ZIKV and followed for either (A) weight loss or (B–D) measured for viral RNA in the spleen, lymph nodes or brain. Mice were treated with anti-IFNAR1 (MAR1-5A3) on −1, 1, 3, 7, 11 and 15 dpi. Control mice were treated with an equivalent amount of normal mouse IgG antibody. Mice were individually weighed every 2 days. Data are plotted as the average increase/decrease in weight over time of 9 mice per group per strain. Statistical analysis was done using a two-way ANOVA with a Tukey’s multiple comparison analysis. * P<0.05 compared to wildtype B6 mouse IgG. Rag1−/− mice treated with anti-IFNAR1 were euthanized at 17 dpi due to a 20% loss in weight (τ). (B–D) At 17 dpi for anti-IFNAR1 treated Rag1−/− mice or 21 dpi for the other 3 groups, (B) spleen, (C) lymph nodes and (D) brain tissue was removed and analyzed for viral RNA by real-time PCR. Individual mice are plotted using the same symbols as for (A) with the mean average shown as a bar. Filled circles represent Ig treated mice. Filled triangles represent anti-IFNAR1 treated mice. Statistical analysis was completed by One-Way ANOVA with a Tukey multiple comparison post-test. * P<0.05, ** P<0.01, ***P<0.001
Fig. 7
Fig. 7. Zika infection of neurons, but not astrocytes or microglia in brain tissue from anti-IFNAR in Rag1−/− mice
(A–P) Brain tissue from anti-IFNAR treated Rag1−/− mice described in Fig 6, was processed for histology and stained for ZIKV NS5 protein (green fluorescence). Samples were co-stained with red (pseudo colored magenta) fluorescent label for (A–D) NeuN to detect neurons, (E–H) GFAP to detect astrocytes (I–L) Iba1 to detect microglia/macrophages and (M–P) active caspase 3 to detect apoptotic cells. Representative sections from the (A, E, I, M) CA1, (B, F, J, N) CA3 and (C, G, K, O) dentate gyrus regions of the hippocampus and (D, H, L, P) layers II/III of the cortex are shown. Samples with active caspase 3 costaining were also counterstained with DAPI (blue fluorescence) to indicate nuclei. (M–P) Arrows demonstrate active caspase 3, NS5 dual positive cells. Scale bar is the same for all images and is shown in A.
Fig. 8
Fig. 8. Zika infection of polygonal cells of the testes from anti-IFNAR treated Rag1−/− mice
(A–H) Testes from mock-treated (A, G) wildtype and (B–F, H) anti-IFNAR treated Rag1−/− mice described in Fig 6, was processed for histology and stained for (A, B and D–F) ZIKV NS5 protein (green fluorescence) and active Caspase 3 or (C) Vimentin (red fluorescence, pseudo colored magenta). Sections were also stained by in situ hybridization for (G and H) ZIKV sense RNA. ZIKV-positive cells localized primarily to (B) regions of polygonal cells in the testes and to a lesser extent (C) stromal and Sertoli cells and induced high levels of (B) apoptosis in anti-IFNAR treated Rag1−/− mice, but not in (A) mock-treated wildtype mice. (D–F) Higher resolution image of square in (B) showing some co-localization (white arrows) between ZIKV NS5 protein and active caspase 3 positive cells. Images are representative between mice. (G and H) Detection of ZIKV RNA is undetectable in (G) control animals, but the polygonal area is heavily positive for viral RNA in (H) anti-IFNAR treated Rag1−/− mice suggesting that a large numbers of cells are infected with virus. The scale bar in A is relevant to images shown in A–F. The scale bar shown in G is relevant to images shown in G and H.
Fig. 9
Fig. 9. Pregnancy suppresses CD4+ and CD8+ T cell response to ZIKV infection
Non-pregnant and pregnant mice were infected with 104 PFU of ZIKV at 7 days post-mating as described in the methods. At 7 dpi, spleens were removed and analyzed for flow cytometry. Cells were gated for (A) CD4+ or (B–F) CD8+ expression and then analyzed for (A–B) Ki67, (C) CD11a, (D) CD62L, (E) CD43 and (F) Granzyme B. Symbols indicate individual animals with lines shown as the mean per group. Data are the combined results of two experiments. Statistical analysis was completed using a One-way ANOVA with Tukey’s multiple comparison post-test. * P<0.05, ** P<0.01, ***P<0.001.

Similar articles

Cited by

References

    1. Dick GW, Kitchen SF, Haddow AJ. Zika virus. I. Isolations and serological specificity. Trans R Soc Trop Med Hyg. 1952;46:509–520. - PubMed
    1. Heukelbach J, Werneck GL. Surveillance of Zika virus infection and microcephaly in Brazil. Lancet. 2016;388:846–847. - PubMed
    1. Magalhaes-Barbosa MC, Prata-Barbosa A, Robaina JR, Raymundo CE, Lima-Setta F, Cunha AJ. Trends of the microcephaly and Zika virus outbreak in Brazil, January–July 2016. Travel Med Infect Dis. 2016;14:458–463. - PubMed
    1. Meltzer E, Leshem E, Lustig Y, Gottesman G, Schwartz E. The Clinical Spectrum of Zika Virus in Returning Travelers. Am J Med. 2016;129:1126–1130. - PubMed
    1. Simpson DI. Zika Virus Infection in Man. Trans R Soc Trop Med Hyg. 1964;58:335–338. - PubMed

Publication types

MeSH terms