

Expression analysis of platelet-derived growth factor receptor alpha and its ligands in the developing mouse lung
- PMID: 28330949
- PMCID: PMC5371545
- DOI: 10.14814/phy2.13092
Expression analysis of platelet-derived growth factor receptor alpha and its ligands in the developing mouse lung
Abstract
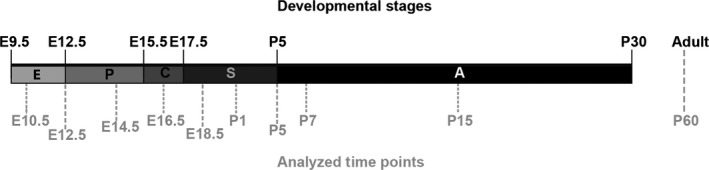
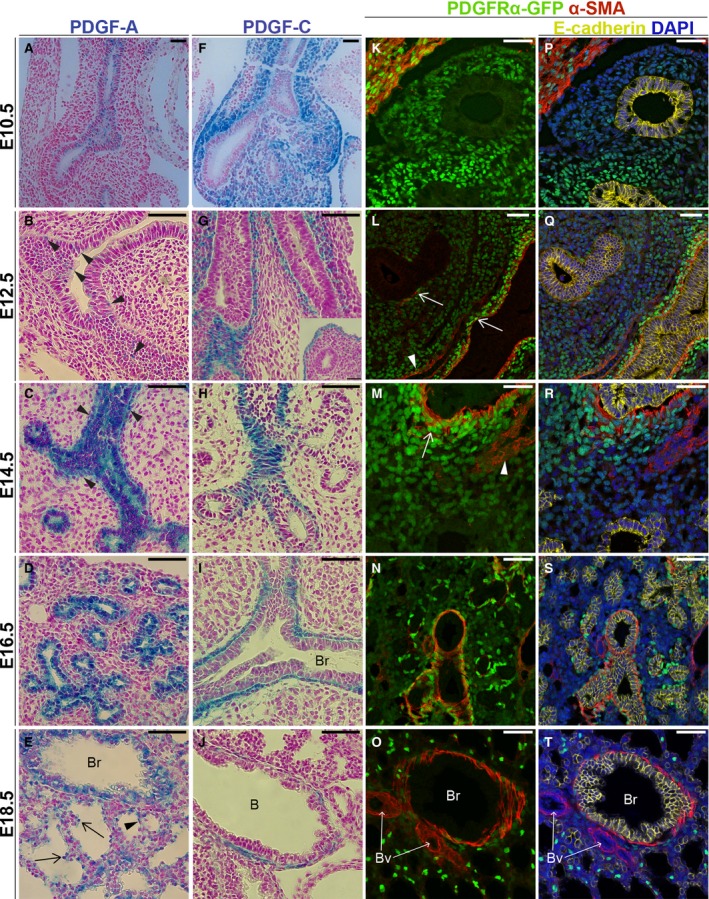
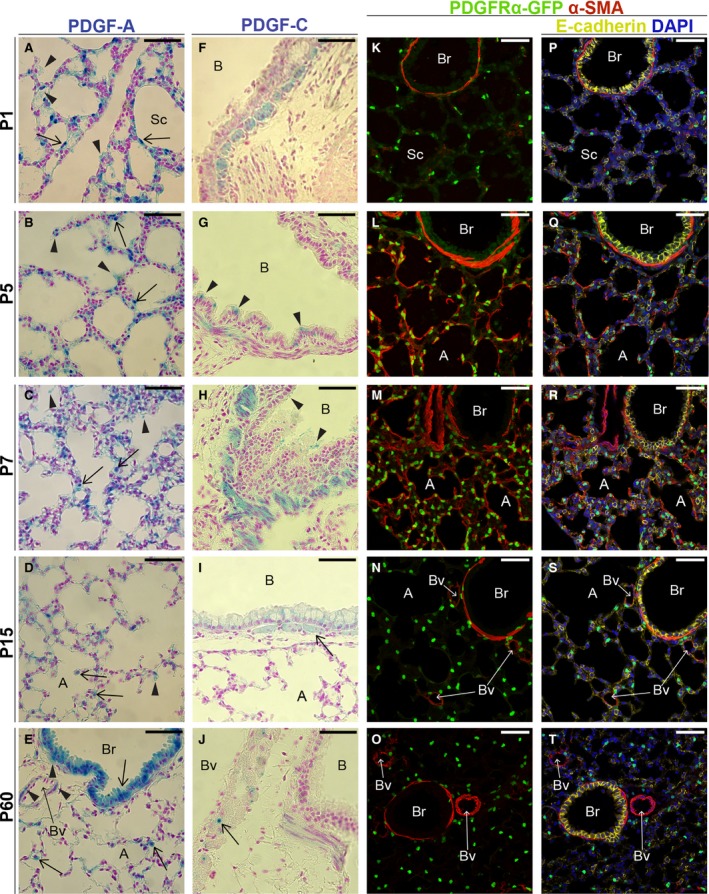
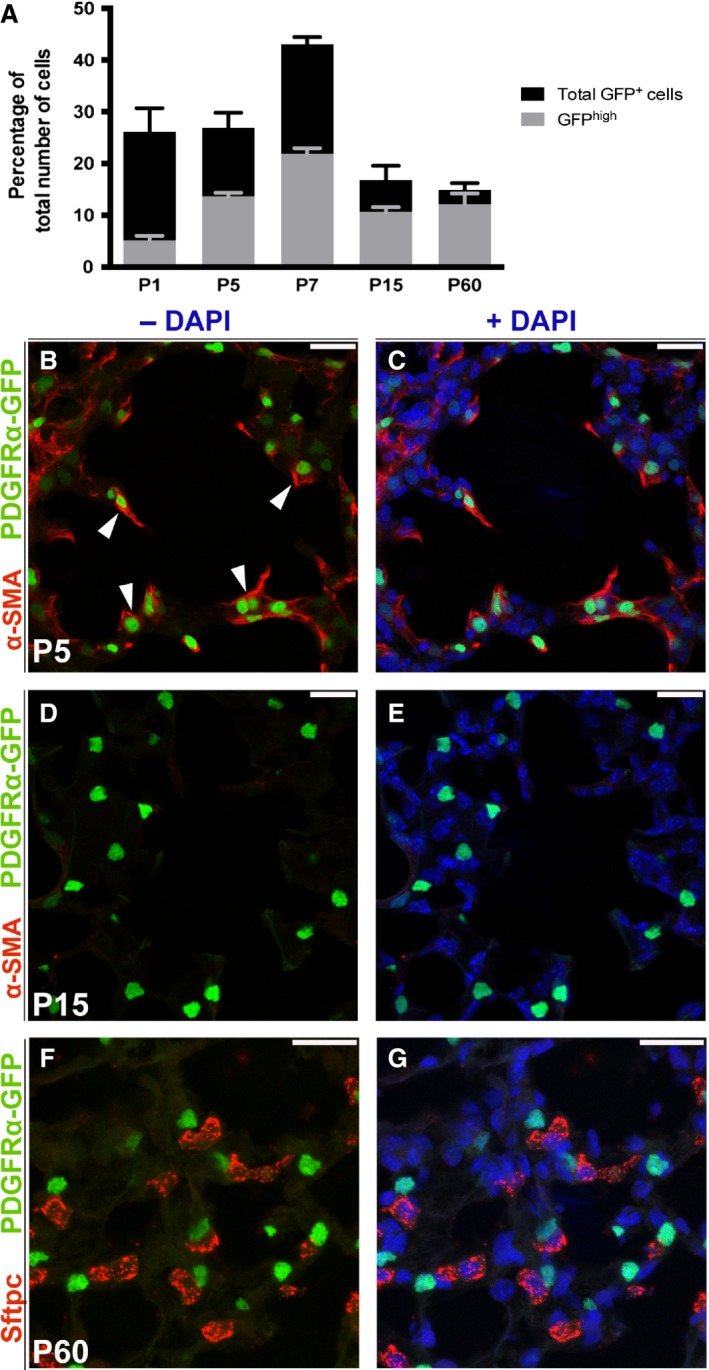
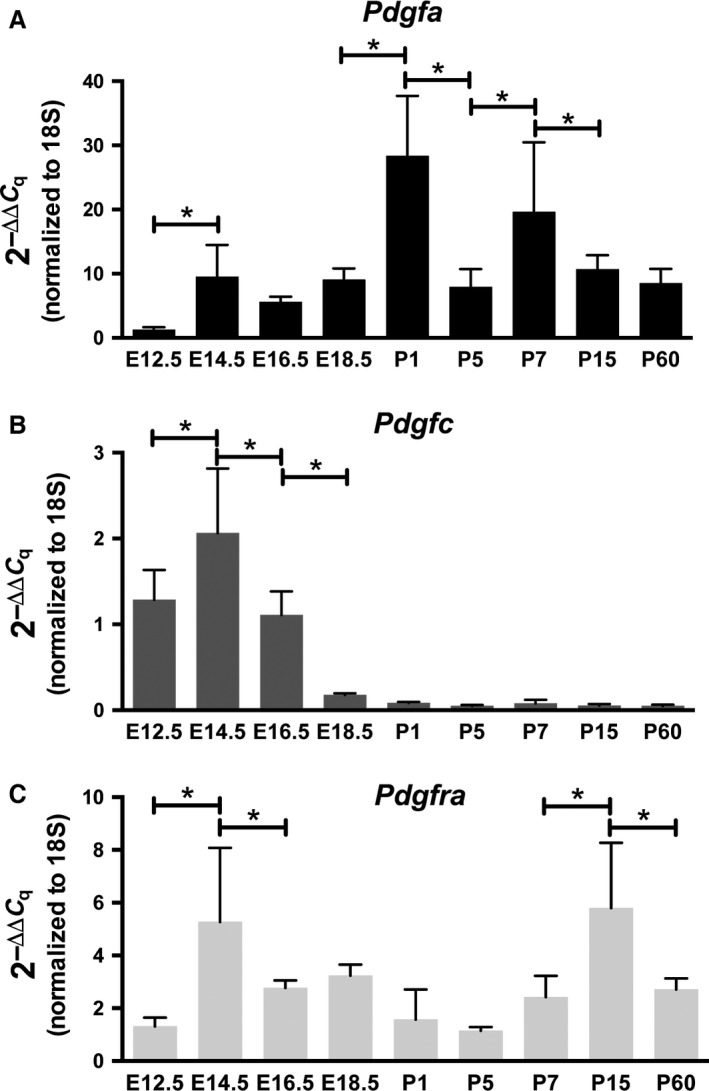
Activation of the platelet-derived growth factor receptor-α (PDGFRα) signaling pathway is critically important during lung alveogenesis, the process in lung development during which alveoli are formed from the terminal alveolar sacs. Several studies have aimed to characterize the expression patterns of PDGFRα and its two ligands (PDGF-A and -C) in the lung, but published analyses have been limited to embryonic and/or perinatal time points, and no attempts have been made to characterize both receptor and ligand expression simultaneously. In this study, we present a detailed map of the expression patterns of PDGFRα, PDGF-A and PDGF-C during the entire period of lung development, that is, from early embryogenesis until adulthood. Three different reporter mice were analyzed (Pdgfaex4-COIN-INV-lacZ , Pdgfctm1Nagy , and Pdgfratm11(EGFP)Sor ), in which either lacZ or H2B-GFP were expressed under the respective promoter in gene-targeted alleles. A spatiotemporal dynamic expression was identified for both ligands and receptor. PDGF-A and PDGF-C were located to distinct populations of epithelial and smooth muscle cells, whereas PDGFRα expression was located to different mesenchymal cell populations. The detailed characterization of gene expression provides a comprehensive map of PDGFRα signaling in lung cells, opening up for a better understanding of the role of PDGF signaling during lung development.
Keywords: Lung; platelet‐derived growth factor; platelet‐derived growth factor receptors; signal transduction.
© 2017 The Authors. Physiological Reports published by Wiley Periodicals, Inc. on behalf of The Physiological Society and the American Physiological Society.
Figures
Similar articles
-
PDGF-A signaling is required for secondary alveolar septation and controls epithelial proliferation in the developing lung.Development. 2018 Apr 10;145(7):dev161976. doi: 10.1242/dev.161976. Development. 2018. PMID: 29636361
-
Hedgehog and Platelet-derived Growth Factor Signaling Intersect during Postnatal Lung Development.Am J Respir Cell Mol Biol. 2023 May;68(5):523-536. doi: 10.1165/rcmb.2022-0269OC. Am J Respir Cell Mol Biol. 2023. PMID: 36693140 Free PMC article.
-
The HIF1α-PDGFD-PDGFRα axis controls glioblastoma growth at normoxia/mild-hypoxia and confers sensitivity to targeted therapy by echinomycin.J Exp Clin Cancer Res. 2021 Sep 1;40(1):278. doi: 10.1186/s13046-021-02082-7. J Exp Clin Cancer Res. 2021. PMID: 34470658 Free PMC article.
-
PDGF-C and PDGF-D signaling in vascular diseases and animal models.Mol Aspects Med. 2018 Aug;62:1-11. doi: 10.1016/j.mam.2018.01.005. Epub 2018 Feb 14. Mol Aspects Med. 2018. PMID: 29410092 Review.
-
Insight into the physiological functions of PDGF through genetic studies in mice.Cytokine Growth Factor Rev. 2004 Aug;15(4):215-28. doi: 10.1016/j.cytogfr.2004.03.005. Cytokine Growth Factor Rev. 2004. PMID: 15207813 Review.
Cited by
-
Environmental and Nutritional "Stressors" and Oligodendrocyte Dysfunction: Role of Mitochondrial and Endoplasmatic Reticulum Impairment.Biomedicines. 2020 Nov 30;8(12):553. doi: 10.3390/biomedicines8120553. Biomedicines. 2020. PMID: 33265917 Free PMC article. Review.
-
System-wide identification of myeloid markers of TB disease and HIV-induced reactivation in the macaque model of Mtb infection and Mtb/SIV co-infection.Front Immunol. 2022 Oct 5;13:777733. doi: 10.3389/fimmu.2022.777733. eCollection 2022. Front Immunol. 2022. PMID: 36275677 Free PMC article.
-
Functional Pdgfra fibroblast heterogeneity in normal and fibrotic mouse lung.JCI Insight. 2023 Nov 22;8(22):e164380. doi: 10.1172/jci.insight.164380. JCI Insight. 2023. PMID: 37824216 Free PMC article.
-
Acquisition of cellular properties during alveolar formation requires differential activity and distribution of mitochondria.Elife. 2022 Apr 6;11:e68598. doi: 10.7554/eLife.68598. Elife. 2022. PMID: 35384838 Free PMC article.
-
Acetaminophen for the patent ductus arteriosus: has safety been adequately demonstrated?J Perinatol. 2023 Oct;43(10):1230-1237. doi: 10.1038/s41372-023-01697-2. Epub 2023 May 11. J Perinatol. 2023. PMID: 37169914 Free PMC article. Review.
References
-
- Aase, K. , Abramsson A., Karlsson L., Betsholtz C., and Eriksson U.. 2002. Expression analysis of PDGF‐C in adult and developing mouse tissues. Mech. Dev. 110:187–191. - PubMed
MeSH terms
Substances
LinkOut - more resources
Full Text Sources
Other Literature Sources
Miscellaneous
