. 2017 May;16(5):891-910.
doi: 10.1074/mcp.M117.067439. Epub 2017 Mar 22.

Quantitative Tyrosine Phosphoproteomics of Epidermal Growth Factor Receptor (EGFR) Tyrosine Kinase Inhibitor-treated Lung Adenocarcinoma Cells Reveals Potential Novel Biomarkers of Therapeutic Response

Affiliations

Quantitative Tyrosine Phosphoproteomics of Epidermal Growth Factor Receptor (EGFR) Tyrosine Kinase Inhibitor-treated Lung Adenocarcinoma Cells Reveals Potential Novel Biomarkers of Therapeutic Response

Xu Zhang et al. Mol Cell Proteomics. 2017 May.

Abstract

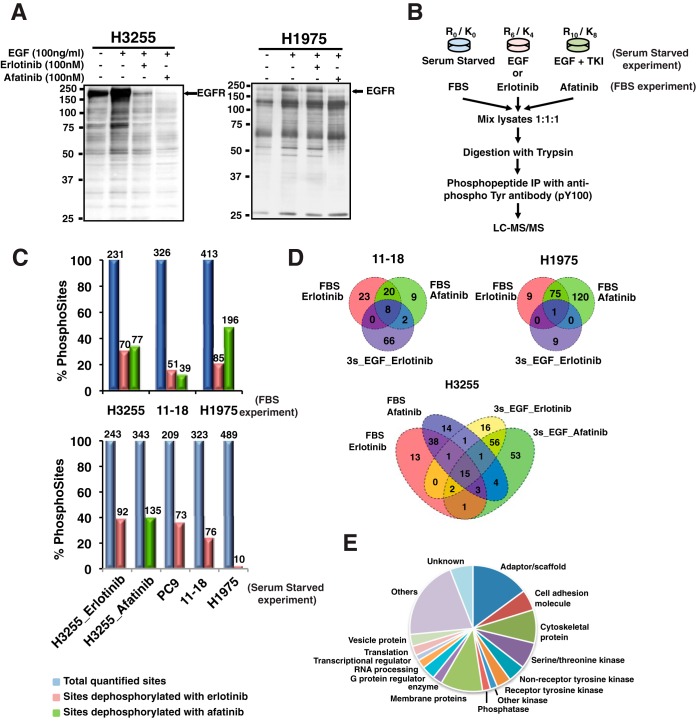
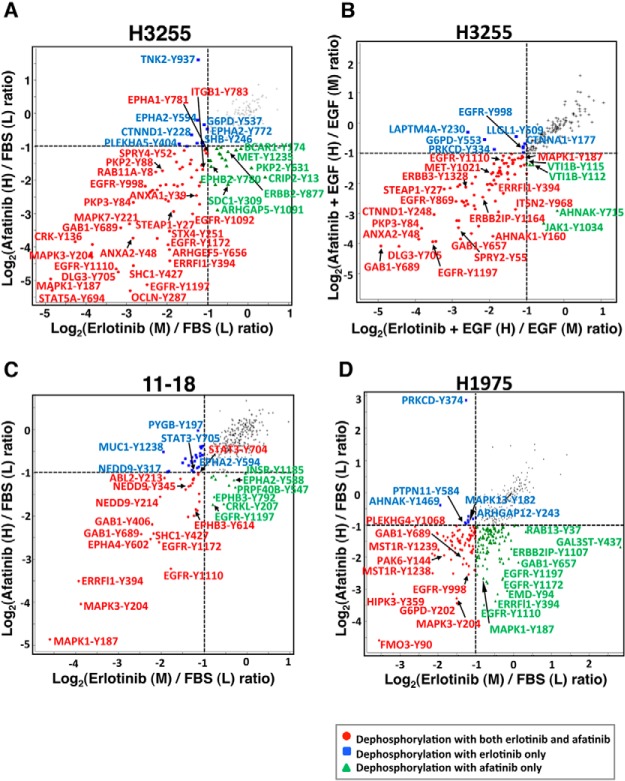
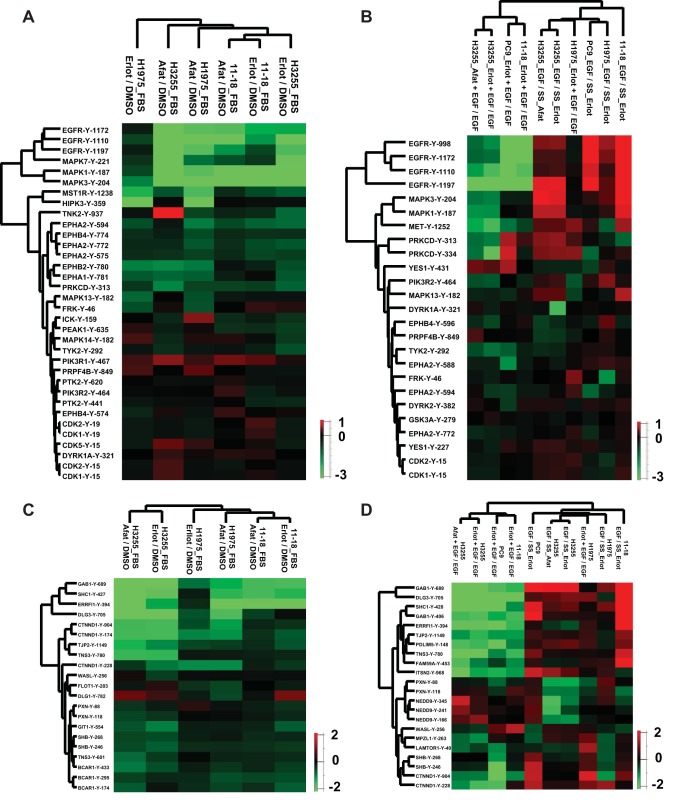
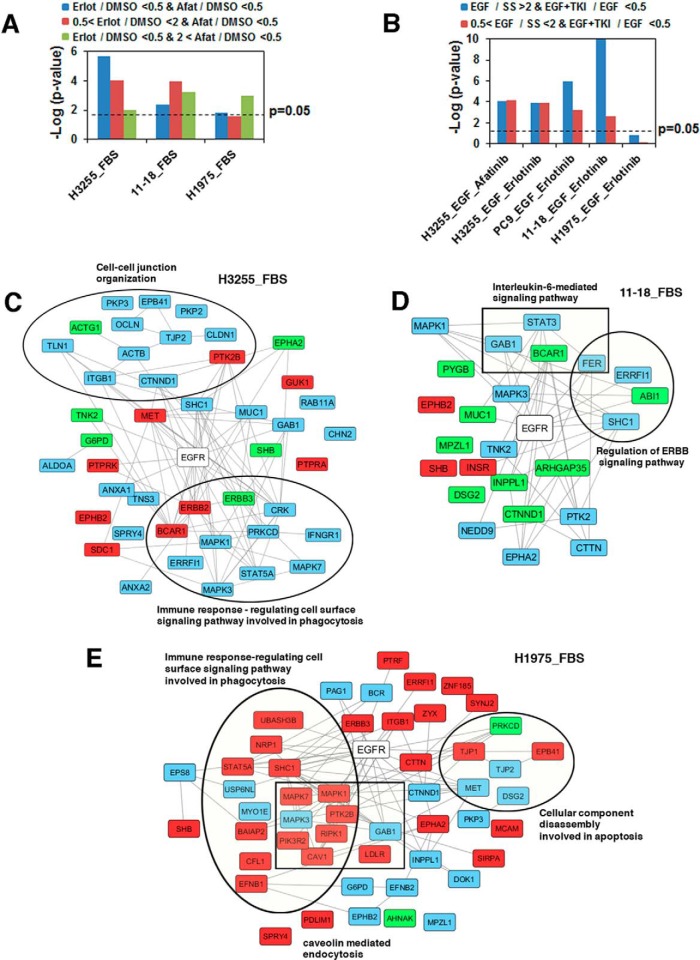
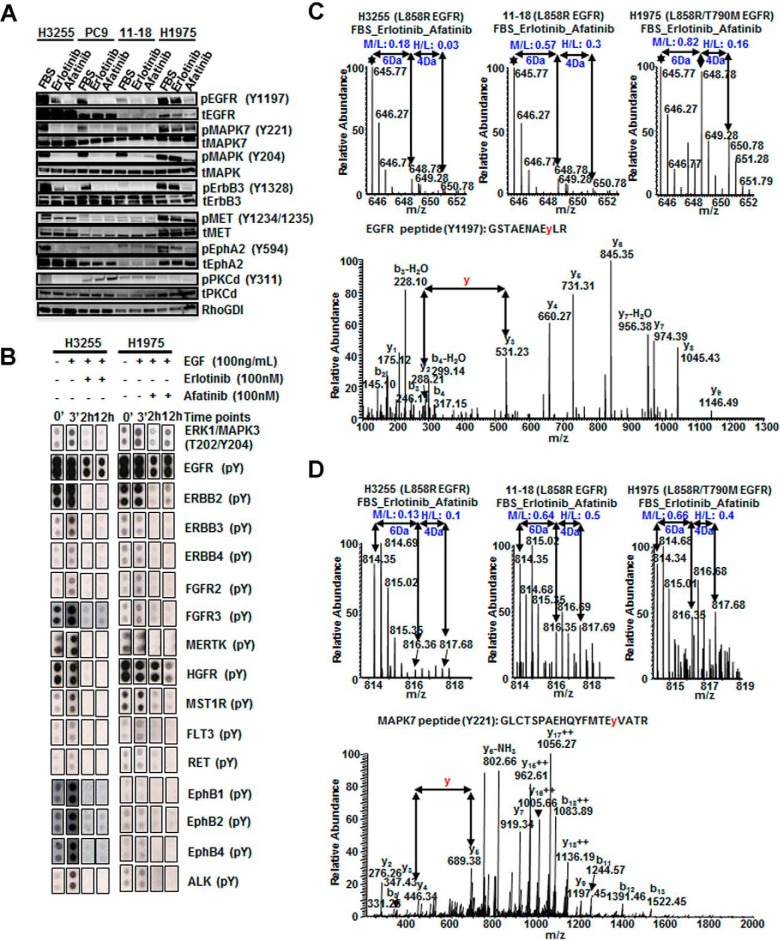
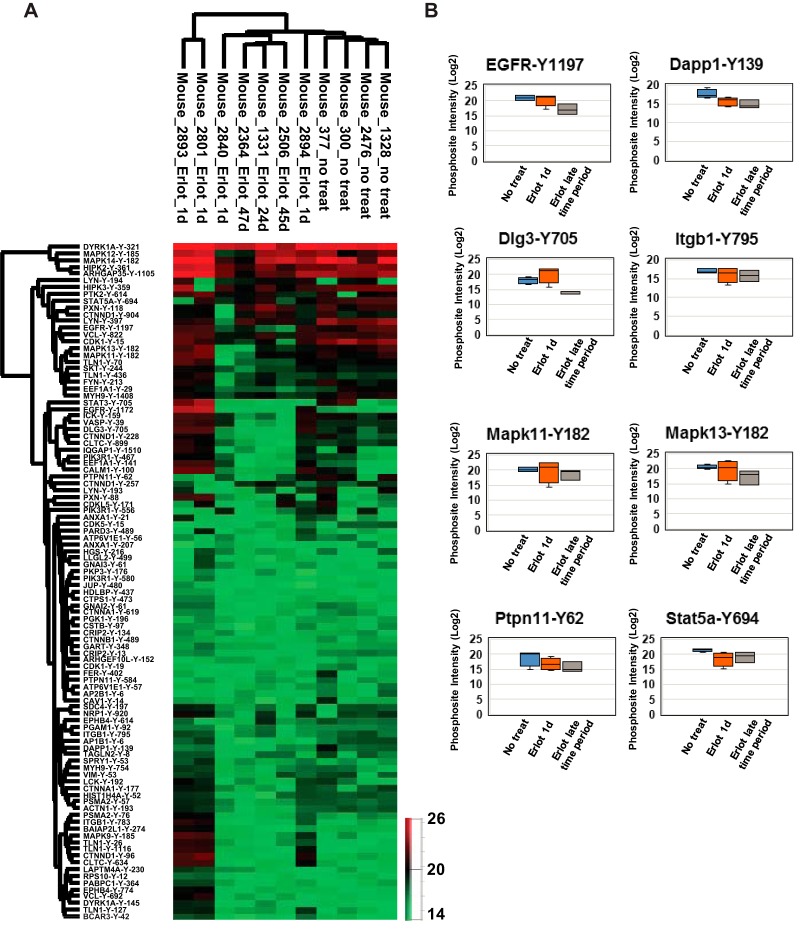
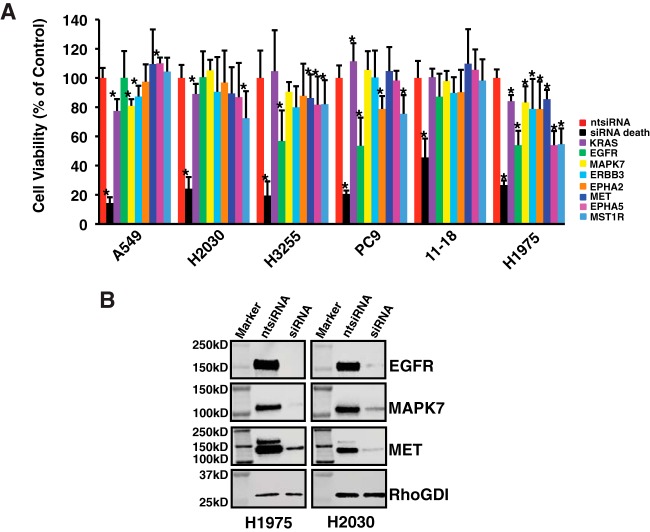
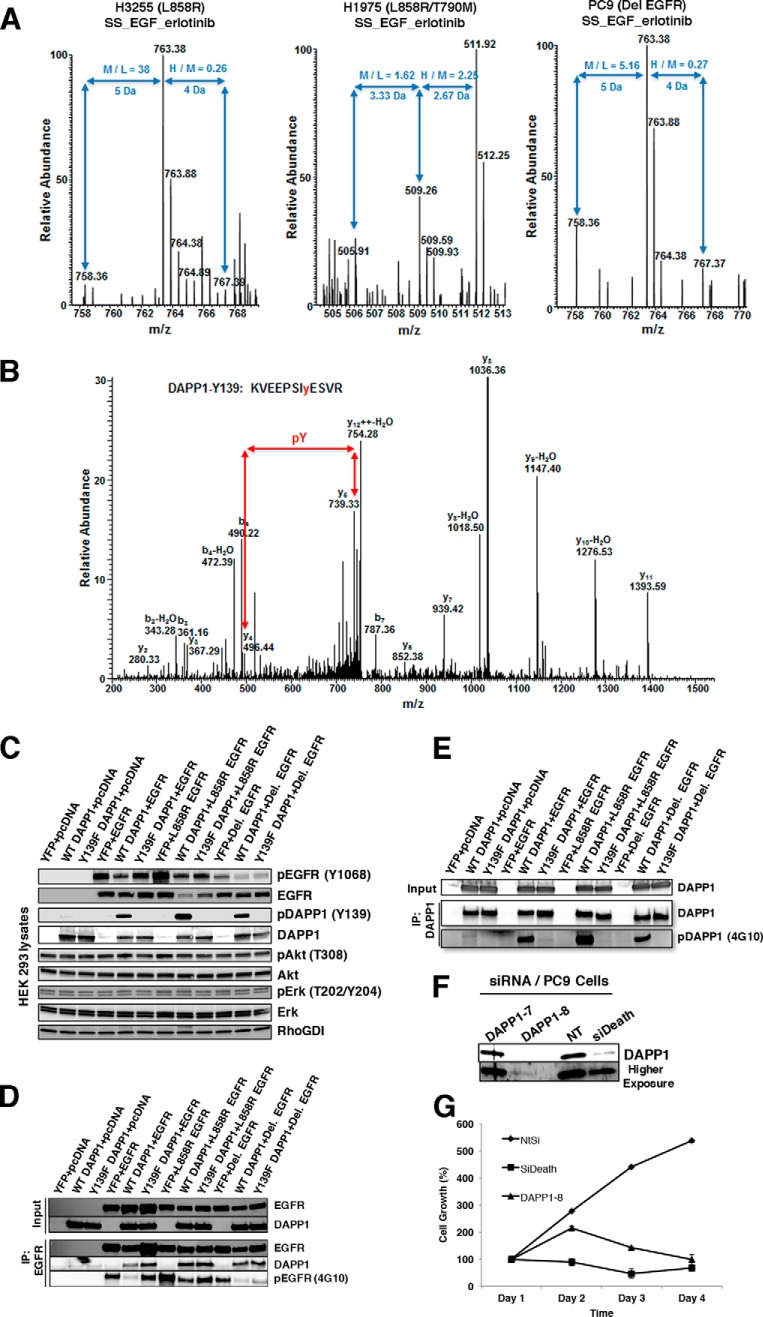
Mutations in the Epidermal growth factor receptor (EGFR) kinase domain, such as the L858R missense mutation and deletions spanning the conserved sequence 747LREA750, are sensitive to tyrosine kinase inhibitors (TKIs). The gatekeeper site residue mutation, T790M accounts for around 60% of acquired resistance to EGFR TKIs. The first generation EGFR TKIs, erlotinib and gefitinib, and the second generation inhibitor, afatinib are FDA approved for initial treatment of EGFR mutated lung adenocarcinoma. The predominant biomarker of EGFR TKI responsiveness is the presence of EGFR TKI-sensitizing mutations. However, 30-40% of patients with EGFR mutations exhibit primary resistance to these TKIs, underscoring the unmet need of identifying additional biomarkers of treatment response. Here, we sought to characterize the dynamics of tyrosine phosphorylation upon EGFR TKI treatment of mutant EGFR-driven human lung adenocarcinoma cell lines with varying sensitivity to EGFR TKIs, erlotinib and afatinib. We employed stable isotope labeling with amino acids in cell culture (SILAC)-based quantitative mass spectrometry to identify and quantify tyrosine phosphorylated peptides. The proportion of tyrosine phosphorylated sites that had reduced phosphorylation upon erlotinib or afatinib treatment correlated with the degree of TKI-sensitivity. Afatinib, an irreversible EGFR TKI, more effectively inhibited tyrosine phosphorylation of a majority of the substrates. The phosphosites with phosphorylation SILAC ratios that correlated with the TKI-sensitivity of the cell lines include sites on kinases, such as EGFR-Y1197 and MAPK7-Y221, and adaptor proteins, such as SHC1-Y349/350, ERRFI1-Y394, GAB1-Y689, STAT5A-Y694, DLG3-Y705, and DAPP1-Y139, suggesting these are potential biomarkers of TKI sensitivity. DAPP1, is a novel target of mutant EGFR signaling and Y-139 is the major site of DAPP1 tyrosine phosphorylation. We also uncovered several off-target effects of these TKIs, such as MST1R-Y1238/Y1239 and MET-Y1252/1253. This study provides unique insight into the TKI-mediated modulation of mutant EGFR signaling, which can be applied to the development of biomarkers of EGFR TKI response.


Conflict of interest statement

We have declared no conflicts of interest

Figures

Fig. 1.
Fig. 1.
Summary of SILAC-based quantitative phosphoproteomics to identify and quantify phosphotyrosine sites in lung adenocarcinoma cells treated with erlotinib or afatinib. A, H3255 and H1975 lung adenocarcinoma cells were serum starved, treated with EGF (100 ng/ml), or pretreated with erlotinib (100 nm) or afatinib (100 nm) before EGF stimulation. Cell lysates were immunoprecipitated with anti-phosphotyrosine antibody (4G10), then IP eluates immunoblotted with 4G10-HRP. B, Experimental workflow showing treatment of SILAC-labeled cells, enrichment of phosphotyrosine peptides, and detection by tandem mass spectrometry. C, Bar graphs showing the percentage of quantified phosphotyrosine sites, and hypo-phosphorylated sites (SILAC ratio < 0.5) upon erlotinib or afatinib treatment. Top panel shows phosphosites identified in cells grown in complete medium (FBS experiments); bottom panel from the serum starved experiments. Above each bar are the actual number of phosphosites. D, Venn diagrams depicting the number of peptides dephosphorylated upon erlotinib or afatinib treatment in three lung cancer cell lines. E, GO analysis of identified phosphoproteins.
Fig. 2.
Fig. 2.
Scatter plot comparison of ratios of phosphorylation at phosphotyrosine sites quantified from erlotinib and afatinib treated cells. Phosphosites with significant regulation upon kinase inhibitor treatment are highlighted by color-coded dots as indicated (A, C, and D). Comparison of SILAC ratios of phosphorylation in H3255, 11–18 and H1975 cells grown in complete medium with/without erlotinib or afatinib treatment. B, Comparison of SILAC ratios of phosphorylation in H3255 cells serum starved overnight followed by EGF stimulation with/without prior erlotinib or afatinib treatment.
Fig. 3.
Fig. 3.
Hierarchical clustering of phosphotyrosine sites based on the SILAC ratios of phosphorylation. Columns represent different cell lines treated as indicated. Rows represent quantified phosphotyrosine sites identified in all experimental conditions. A, C, Phosphotyrosine sites in kinases (A) and adaptor proteins (C) in three lung cancer cell lines in complete medium and treated with erlotinib or afatinib. B, D, Phosphotyrosine sites in kinases (B) and adaptor proteins (D) in four lung cancer cell lines treated with erlotinib or afatinib in serum starved condition before EGF stimulation. Erlot or Afat + EGF/EGF represents the SILAC ratio of phosphorylation upon TKI inhibition. EGF/SS_Erlot or _Afat is the SILAC ratio of phosphorylation upon EGF stimulation without TKI inhibition.
Fig. 4.
Fig. 4.
Enrichment of EGFR pathway substrates among proteins with phosphorylation modulated by erlotinib or afatinib treatment. A, Enrichment upon erlotinib or afatinib treatment of H3255, 11–18, and H1975 cells in the presence of complete medium. Colors of the bars represent specific SILAC ratio changes as indicated. B, Enrichment upon EGF stimulation and erlotinib or afatinib treatment of H3255, PC9, 11–18, and H1975 cells following serum starvation. Colors of the bars represent specific SILAC ratio changes as indicated. C–E, Networks of EGFR substrates whose phosphorylation was inhibited by erlotinib, afatinib or both in H3255 (C), 11–18 (D), and H1975 (E) cells grown in complete medium. Phosphorylation of proteins highlighted with blue was inhibited by both erlotinib and afatinib; with green by erlotinib only; and with red by afatinib only.
Fig. 5.
Fig. 5.
Validation of phosphosites modulated by erlotinib and/or afatinib in lung adenocarcinoma cell lines. A, Western blots showing the effect of erlotinib or afatinib on selected phosphorylation sites relative to the protein level in H3255, PC9, 11–18 and H1975 cell lines. B, Phospho MAPK array and RTK array antibody blots showing phosphorylation changes in response to EGF stimulation upon erlotinib or afatinib treatment of H3255 and H1975 cells. Cells were serum starved overnight then treated with EGF for 3 min or with 100 nm erlotinib or afatinib for 2 h or 12 h prior to EGF stimulation. C–D, MS and MS/MS spectra of EGFR peptide with Y1197 phosphorylation (C) and MAPK7 peptide with Y221 phosphorylation (D). Phosphorylation of both sites decreased upon erlotinib or afatinib inhibition of H3255 and 11–18 cells; whereas it was only inhibited upon afatinib treatment in H1975 cells, but did not change upon erlotinib treatment.
Fig. 6.
Fig. 6.
Phosphotyrosine sites validated in untreated or erlotinib-treated transgenic mice with doxycycline-inducible EGFRL858R lung tumors. A, Hierarchical clustering of phosphotyrosine sites identified in the mice based on label-free quantitation. Columns represent different mice of the same genotype (EGFRL858R) untreated or treated with erlotinib; rows represent quantified phosphotyrosine sites. Expression is based on the log2 intensity of the phosphopeptide. Only the sites identified in any of the human lung adenocarcinoma cell lines and mice are shown. B, Box plots of intensities of selected regulated phosphopeptides showing the label-free quantitation of tumor bearing mice, untreated, treated with erlotinib for 1 day, and mice receiving long term erlotinib treatment (24–47 days).
Fig. 7.
Fig. 7.
Functional characterization of lung adenocarcinoma cells upon siRNA-mediated knockdown of select target proteins with reduced tyrosine phosphorylation upon erlotinib or afatinib treatement. A, Two KRAS mutant cell lines (A549 and H2030) and four EGFR mutant cell lines (H3255, PC9, 11–18, and H1975) were transfected with 25 nm of non-targeted siRNA, siRNA death control or 8 selected siRNAs. Cell viability was measured using Cell Titer-Glo Luminescent assays. Results are shown as mean ± S.D. from three independent experiments. * p value less than 0.05 from the student t test. B, Western blots showing reduced expression of selected targets upon siRNA-mediated knockdown in H1975 and H2030.
Fig. 8.
Fig. 8.
Validation of DAPP1 Y139 phosphorylation as the major site of tyrosine phosphorylation modulated by mutant EGFR signaling. A–B, MS and MS/MS spectra of DAPP1 peptide with Y139 phosphorylation. Phosphorylation increased upon EGF stimulation (M/L ratio) and decreased upon erlotinib inhibition of H3255 cells and PC9 cells, but increased in H1975 cells (H/M ratio) (A). C, Immunoblot analysis of protein lysates from HEK 293 cells expressing wild type or mutant EGFR and DAPP1 or Y139F DAPP1 mutant. Lysates prepared in modified RIPA buffer were probed with pY1068-EGFR, EGFR, pY139-DAPP1, DAPP1, pAkt, Akt, pErk, Erk, and Rho-GDI (control) specific antibodies. D, Immunoprecipitation of wild type and mutant EGFRs with EGFR specific monoclonal antibodies followed by immunoblotting with anti-EGFR, pEGFR (4G10), and anti-DAPP1 antibodies. E, Immunoprecipitation of wild type and Y139F mutant DAPP1 from HEK 293 cells expressing DAPP1 and mutant DAPP1 followed by immunoblotting with anti-DAPP1 and anti-pTyr (4G10) antibodies indicated that Y139 is the major site of DAPP1 phosphorylation. F, PC9 cells (expressing EGFRDel 746–750) were transfected with DAPP1 siRNAs, or NT siRNA (negative control) and siDeath (positive control) for 72 h followed by immunoblot analysis of cell extracts with anti-DAPP1 antibodies. G, Growth curve of PC9 cells following transfection of PC9 cells with DAPP-1 siRNA, NT-siRNA, or siDeath, showing DAPP1 knock-down significantly reduces PC9 cell growth.

References

    1. Siegel R., Naishadham D., and Jemal A. (2013) Cancer statistics, 2013. CA Cancer J. Clin. 63, 11–30 - PubMed
    1. Dowell J., Minna J. D., and Kirkpatrick P. (2005) Erlotinib hydrochloride. Nat. Rev. Drug Discov. 4, 13–14 - PubMed
    1. Melnikova I., and Golden J. (2004) Targeting protein kinases. Nat. Rev. Drug Discov. 3, 993–994 - PubMed
    1. Copeman M. (2008) Prolonged response to first-line erlotinib for advanced lung adenocarcinoma. J. Exp. Clin. Cancer Res. 27, 59. - PMC - PubMed
    1. Sharma S. P. (2007) New predictors of survival for early-stage NSCLC. Lancet Oncol. 8, 288 - PubMed

MeSH terms