

Upregulation of distinct collagen transcripts in post-surgery scar tissue: a study of conjunctival fibrosis
- PMID: 28331057
- PMCID: PMC5483006
- DOI: 10.1242/dmm.028555
Upregulation of distinct collagen transcripts in post-surgery scar tissue: a study of conjunctival fibrosis
Abstract
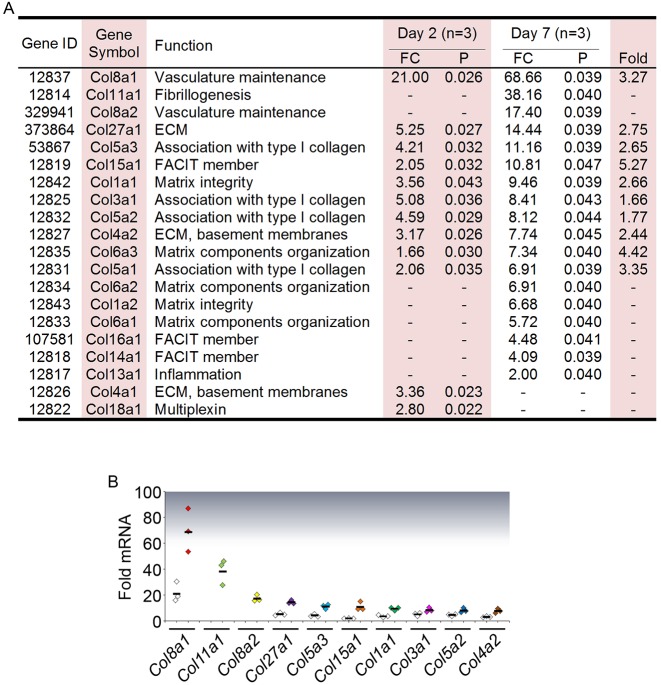
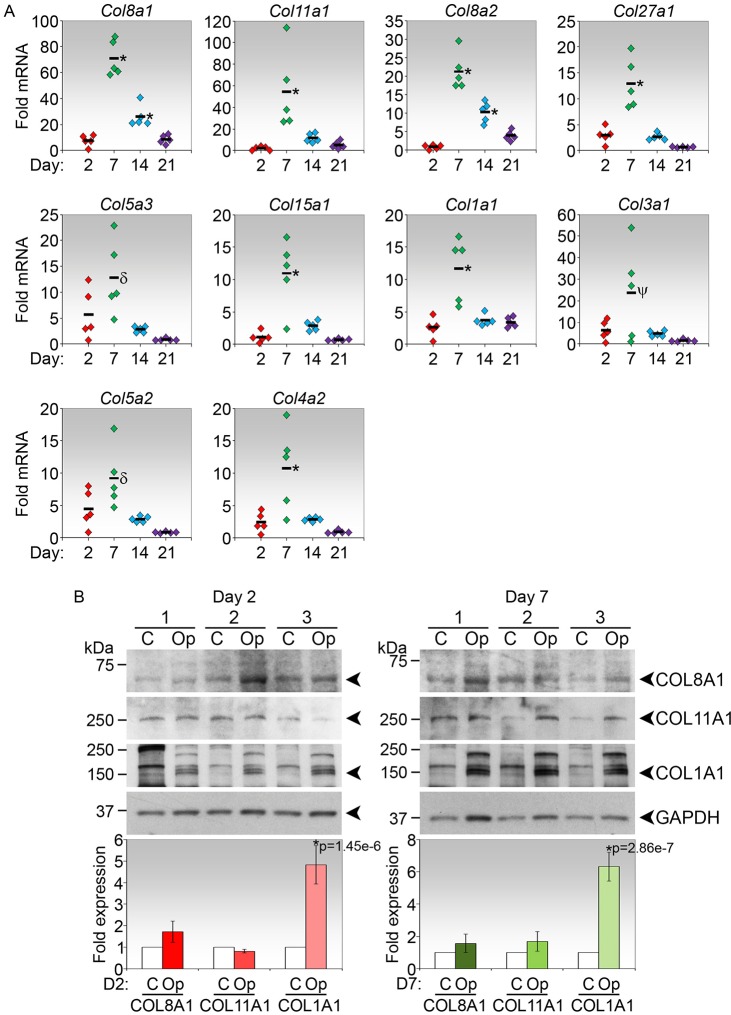
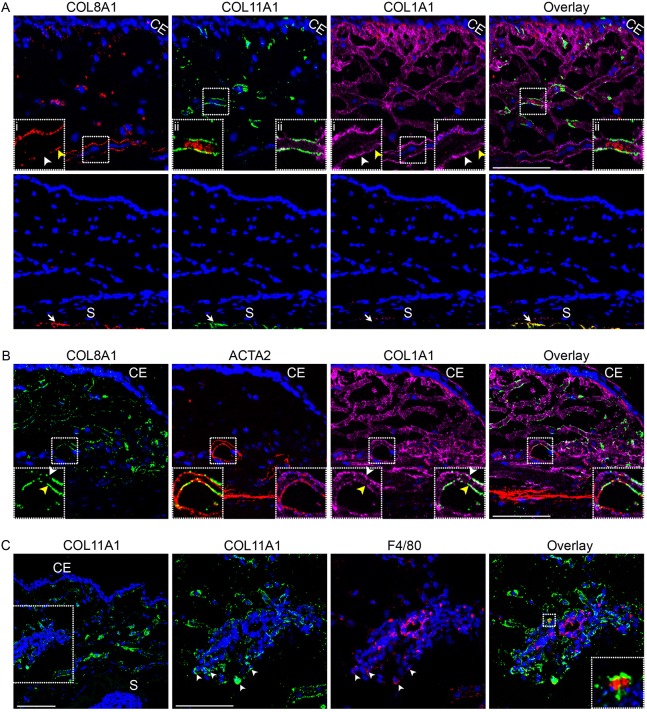
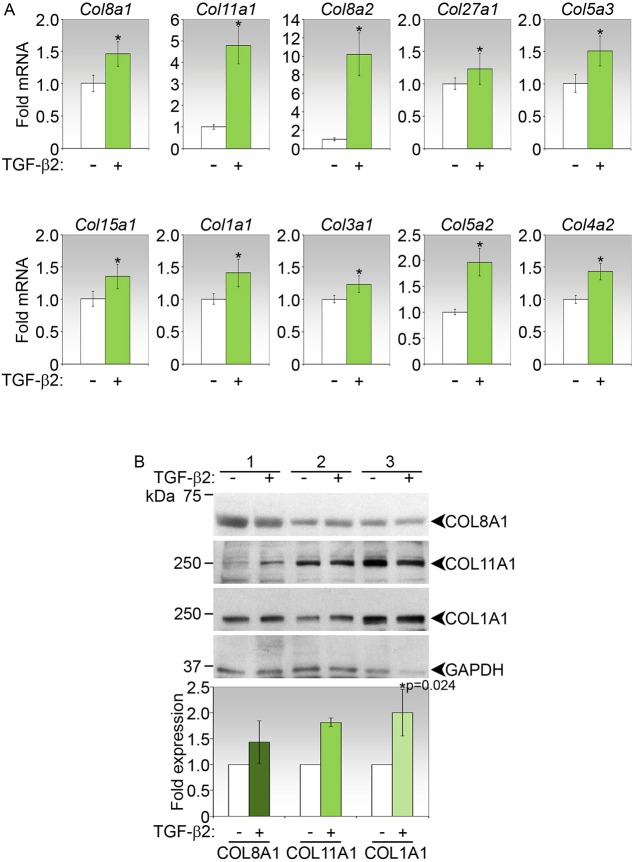
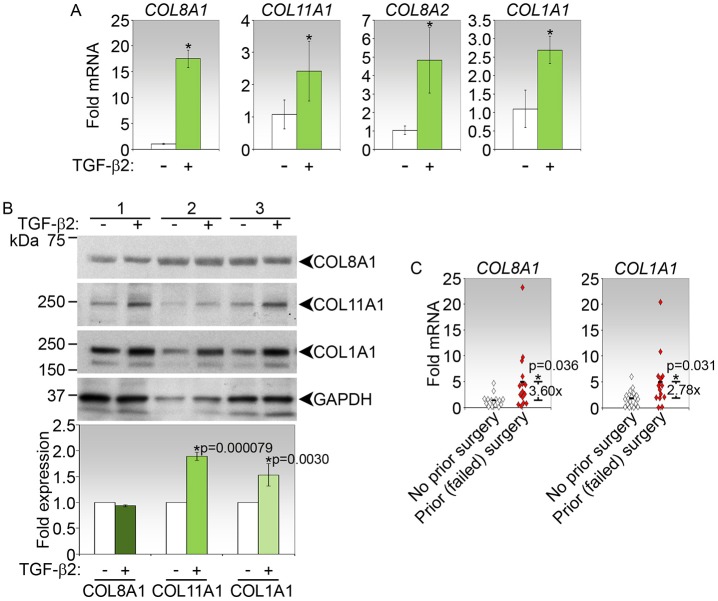
Excessive accumulation of collagen is often used to assess the development of fibrosis. This study aims to identify collagen genes that define fibrosis in the conjunctiva following glaucoma filtration surgery (GFS). Using the mouse model of GFS, we have identified collagen transcripts that were upregulated in the fibrotic phase of wound healing via RNA-seq. The collagen transcripts that were increased the most were encoded by Col8a1, Col11a1 and Col8a2 Further analysis of the Col8a1, Col11a1 and Col8a2 transcripts revealed their increase by 67-, 54- and 18-fold, respectively, in the fibrotic phase, compared with 12-fold for Col1a1, the most commonly evaluated collagen gene for fibrosis. However, only type I collagen was significantly upregulated at the protein level in the fibrotic phase. Type VIII and type I collagens colocalized in fibrous structures and in ACTA2-positive pericytes, and appeared to compensate for each other in expression levels. Type XI collagen showed low colocalization with both type VIII and type I collagens but can be found in association with macrophages. Furthermore, we show that both mouse and human conjunctival fibroblasts expressed elevated levels of the most highly expressed collagen genes in response to TGFβ2 treatment. Importantly, conjunctival tissues from individuals whose GF surgeries have failed due to scarring showed 3.60- and 2.78-fold increases in type VIII and I collagen transcripts, respectively, compared with those from individuals with no prior surgeries. These data demonstrate that distinct collagen transcripts are expressed at high levels in the conjunctiva after surgery and their unique expression profiles may imply differential influences on the fibrotic outcome.
Keywords: Collagen; Conjunctiva; Fibrosis.
© 2017. Published by The Company of Biologists Ltd.
Conflict of interest statement
Competing interestsThe authors declare no competing or financial interests.
Figures
Similar articles
-
Valproic acid suppresses collagen by selective regulation of Smads in conjunctival fibrosis.J Mol Med (Berl). 2016 Mar;94(3):321-34. doi: 10.1007/s00109-015-1358-z. Epub 2015 Oct 27. J Mol Med (Berl). 2016. PMID: 26507880 Free PMC article.
-
Valproic acid modulates collagen architecture in the postoperative conjunctival scar.J Mol Med (Berl). 2022 Jun;100(6):947-961. doi: 10.1007/s00109-021-02171-2. Epub 2022 May 18. J Mol Med (Berl). 2022. PMID: 35583819
-
The effects of ripasudil (K-115), a Rho kinase inhibitor, on activation of human conjunctival fibroblasts.Exp Eye Res. 2016 Aug;149:107-115. doi: 10.1016/j.exer.2016.07.001. Epub 2016 Jul 6. Exp Eye Res. 2016. PMID: 27394186
-
TGF-beta-induced fibrosis and SMAD signaling: oligo decoys as natural therapeutics for inhibition of tissue fibrosis and scarring.Wound Repair Regen. 2007 Sep-Oct;15 Suppl 1:S54-60. doi: 10.1111/j.1524-475X.2007.00226.x. Wound Repair Regen. 2007. PMID: 17727468 Review.
-
Modulation of Fibroblasts in Conjunctival Wound Healing.Ophthalmology. 2018 Feb;125(2):179-192. doi: 10.1016/j.ophtha.2017.08.028. Epub 2017 Nov 1. Ophthalmology. 2018. PMID: 29079272 Review.
Cited by
-
Targeted therapy for the post-operative conjunctiva: SPARC silencing reduces collagen deposition.Br J Ophthalmol. 2018 Oct;102(10):1460-1470. doi: 10.1136/bjophthalmol-2018-311937. Epub 2018 Jul 18. Br J Ophthalmol. 2018. PMID: 30021812 Free PMC article.
-
Candidate SNP Markers Significantly Altering the Affinity of the TATA-Binding Protein for the Promoters of Human Genes Associated with Primary Open-Angle Glaucoma.Int J Mol Sci. 2024 Nov 28;25(23):12802. doi: 10.3390/ijms252312802. Int J Mol Sci. 2024. PMID: 39684516 Free PMC article.
-
Adaptations in Hippo-Yap signaling and myofibroblast fate underlie scar-free ear appendage wound healing in spiny mice.Dev Cell. 2021 Oct 11;56(19):2722-2740.e6. doi: 10.1016/j.devcel.2021.09.008. Epub 2021 Oct 4. Dev Cell. 2021. PMID: 34610329 Free PMC article.
-
A multi-omic single-cell landscape of the aging mouse ovary.Geroscience. 2025 Jun;47(3):4485-4498. doi: 10.1007/s11357-025-01556-2. Epub 2025 Feb 11. Geroscience. 2025. PMID: 39934558 Free PMC article.
-
PNP Hydrogel Prevents Formation of Symblephara in Mice After Ocular Alkali Injury.Transl Vis Sci Technol. 2022 Feb 1;11(2):31. doi: 10.1167/tvst.11.2.31. Transl Vis Sci Technol. 2022. PMID: 35191963 Free PMC article.
References
-
- Andersen C. L., Jensen J. L. and Ørntoft T. F. (2004). Normalization of real-time quantitative reverse transcription-PCR data, a model-based variance estimation approach to identify genes suited for normalization, applied to bladder and colon cancer data sets. Cancer Res. 64, 5245-5250. 10.1158/0008-5472.CAN-04-0496 - DOI - PubMed
-
- Benjamini Y. and Hochberg Y. (1995). Controlling the false discovery rate: a practical and powerful approach to multiple testing. J. R. Stat. Soc. Series B Stat. Methodol. 57, 289-300.
Publication types
MeSH terms
Substances
LinkOut - more resources
Full Text Sources
Other Literature Sources
Medical
Miscellaneous
